Chapter 9. What Next?

It is impossible for a man to learn what he thinks he already knows.
Fully implementing the core practices laid out in the last five chapters takes time. If you have implemented some or all of these practices, you have already seen significant increases in both productivity and quality. This means that you no longer need to be convinced; rather, you are excited about the possibilities and anxious to learn what to do next.
Lean Thinking and the Analysis Practices
Lean is a way of thinking, a certain perspective on improving productivity and quality. This mindset cuts across all areas to which Lean has been applied (or will be applied). The more you read about how Lean thinking has been applied in other areas of business, the more you will come to understand how to apply these techniques to your own situation in software development.
Overall, the Lean software development practices can be roughly divided into two categories: the concrete practices and the analysis practices. Up to this point we have been presenting the core concrete practices. In this chapter we introduce you to some of the analysis practices that will help you identify the remaining bottlenecks and how to further improve your software development process.
You could start your Lean software development journey with the analysis practices. The problem is that this would require you to more fully understand the Lean perspective and principles at the outset. In the end, if done correctly, it would probably lead you (at first) to the very same concrete practices. We think it’s better just to start with the concrete practices and learn as you go.
Although the concrete practices will definitely bring significant quality and productivity improvements, that is just the tip of the iceberg. The analysis practices have the potential for even greater productivity and quality gains, especially when they take into account the larger business processes in which the software development occurs. Implementing the concrete practices will give you the experience and knowledge you need to effectively use the analysis practices.
It can be very beneficial to read some of the classic books on Lean manufacturing and some related areas. This will help you to think from a Lean perspective. Some of our recommended reading would include Lean Thinking by James Womack et al. (Free Press, 2003), The Toyota Way by Jeffrey Liker (McGraw-Hill, 2003), The Toyota Product Development System by James Morgan and Jeffrey Liker (Productivity Press, 2006), and The Goal by Eliyahu Goldratt and Jeff Cox (North River Press, 2004).
The remainder of this chapter will describe some of the Lean analysis practices as well as some closely related practices from other business management strategies, such as Six Sigma and the Theory of Constraints. Lean isn’t above adopting practices from other areas. As such, Agile methodologies, Six Sigma, and ToC would all be considered valid Lean practices if they result in delivering more value to the customer more quickly.
Probably the most well-known Lean analysis practice is value stream mapping (VSM). We cover VSM as well as a number of other analysis practices, such as Kaizen Workshops, root cause analysis, and some practices that straddle the gray area between concrete and analytical.
In this chapter we discuss:
Kaizen
Kaizen Workshops
Value stream mapping
Root cause analysis
Kanban
Other complementary approaches
Kaizen
In Japanese, Kaizen means “continuous improvement.” It is derived from the Japanese words kai (meaning “change”) and zen (meaning “good”).
Kaizen is therefore a system of slow, continuous, incremental improvements. As such, it involves every employee, from top management to the clerk. Everyone is encouraged, even expected, to come up with small suggestions for improvements on a regular basis. Typically, a supervisor will review an improvement suggestion within 24 hours, and if approved, it will be quickly implemented.
Toyota, for example, has been practicing company-wide Kaizen for over 50 years, and it still implements tens of thousands of improvements each year. At Canon, Inc., supervisors are required to set aside 30 minutes each day for workers to identify problems and suggest solutions. Other meetings are not to be held during “Kaizen Time,” and supervisors are not even supposed to answer the phone.
This is a cultural system that must be actively supported by top management. It is literally the opposite of the “if it isn’t broke, don’t fix it” mentality, being more of an “improve it even if it isn’t broken, because if we don’t, we can’t compete with those that do” mentality.
Driving the cultural changes required to bring Kaizen to an entire company is only possible with strong and consistent support from the very top. It is not possible for an individual manager or engineer involved in software development to do this alone. But you can bring it to your team, project, or department, and the Kaizen basics are quite simple:
Standardize a process
Measure the performance of that process
Implement a change and measure its effect on performance
Change the standard to include the improvement
Repeat the cycle forever
The key to making this work is to institutionalize the whole process in some way (as Canon did) so that there really is a steady stream of small improvements (not just one or two a year). The number of suggested improvements by a worker should be an important part of the assessment of his supervisor’s performance. Management must work hard to consider and implement suggestions, and workers need to be recognized for their contributions.
Kaizen requires a deep cultural commitment and can be difficult to sustain, but it is worth striving for. (As Toyota has demonstrated, it creates a long-term competitive advantage.) However, when you are new to Lean and you’ve just finished implementing the concrete practices, it would be better to begin your first foray into the analysis practices with Kaizen Workshops.
Kaizen Workshops
When the term Kaizen is used in the West, people are usually talking about a Kaizen Workshop and not the Kaizen system described in the previous section. The Kaizen Workshop has been used under several other names: Kaizen Blitz, Kaizen Event, Accelerated Improvement Workshop, Rapid Process Improvement Workshop, and even simply Workouts. In this chapter, we will use the term Kaizen Workshop.
A Kaizen Workshop is an intense, focused project to improve a process, where a team or department throws all of its resources into the effort for a short period of time. The intensity and urgency is designed to overcome any institutionalized resistance. The execution is swift, and it is expected that there will be significant results very quickly.
There are two fundamental principles behind a Kaizen Workshop:
Don’t just plan…act!
It’s better to get a 50% improvement now than to wait months hoping for perfection.
First, you must identify a specific problem that you want to address. Then you can hold a Kaizen Workshop to find and implement solutions.
A Kaizen Workshop is a structured rapid improvement process that has three phases:
Plan (4 to 6 weeks)
Workshop (3 to 5 days)
Implement (1 to 3 months)
A Kaizen Workshop requires considerable planning because it must bring together all stakeholders into an integrated team. All required information and material must be gathered before the workshop, and the relevant leadership must empower the workshop team to implement the resulting changes.
During the planning phase you assess your current situation and define the problem you want to address. Your major activities revolve around getting leadership commitment, lining up stakeholders to participate, and creating a formal charter for the Kaizen Workshop that everyone can agree to.
The Kaizen Workshop charter will define the problem to be addressed, the desired outcome, and the boundaries or scope of the resulting solution(s). It is vital that the leadership for the affected areas formally sign on to support the effort. They must commit to quickly accept or reject the recommendations of the Kaizen Workshop and to work to remove any roadblocks.
During the planning phase you hold meetings with the organization’s leaders to get their perspective, instill the need to address the problem, and secure their commitment to support the Kaizen Workshop. This is also the time when you identify the workshop participants, including the stakeholders, experts, workers, and even customers, and get their commitment to support the Kaizen Workshop.
The workshop itself is a dedicated multiday affair, where all of the participants gather for uninterrupted time to come up with solutions. You start off with some basic training for all participants to make sure everyone understands how the workshop will operate and proceed. Then you typically review the current situation, the problem to be addressed, and the previously agreed-upon boundaries for the solutions. This is followed by brainstorming sessions and in-depth discussions. You will typically concentrate on things like quality (reducing defects), achieving flow, reducing cycle time, costs, or other wastes.
The goal is to have the workshop participants reach a consensus on one or more recommended action plans. These recommendations are sent to the Kaizen Workshop’s leadership team, which has previously committed to rapid approval or rejection (usually within one day).
Finally, the Kaizen Workshop participants rapidly implement the approved recommendations, with the support of the leadership, taking no more than three months (preferably less). Monthly progress reports are made to the leadership team to ensure timely implementation and full accountability.
Value Stream Maps
Value stream mapping is a classic Lean analysis tool. If you’ve heard of Lean, chances are you’ve also heard of value stream mapping. It is one of the most powerful Lean tools and can be applied to almost any process.
A VSM is a visual representation of all the steps in a particular process from start to finish (usually from customer request through the resulting delivery to the customer). Attached to each step is data about that step, particularly the touch time (actual work time) and wait time. Each step is also identified as value-added, non-value-added, or non-value-added but necessary.
The VSM makes it easier to spot waste and bottlenecks in the process. Because it shows the entire product flow from end to end, you can also spot problems that originate outside of the core software development activities.
After the VSM has been created, some problems may become apparent. Any non-value-added steps, for example, would be pure waste and should be considered for elimination. Points in the value stream with large wait times or queues of work in progress are red flags that should invite closer scrutiny.
It is very important that the VSM show the process as it is actually carried out; do not bring your written process documents to the VSM exercise because we guarantee that the documented process is not the same as what you are actually doing. This helps make the tacit knowledge of the team explicit, and it can also point to areas where the documented process needs to be updated to reflect reality.
You may have noticed that a VSM focuses on time and not cost. A key insight of Lean thinking is that the best way to reduce cost is not to focus on cost at all, but to let cost get reduced as a byproduct of focusing on the root causes of increased cost: cycle time and quality.
Let’s look at an example for a team maintaining an application. This team receives feature requests for its existing application that it then implements and deploys to the customer. Figure 9-1 shows a simplified VSM for this team’s process. A more detailed VSM would break out more of the details in each processing box.
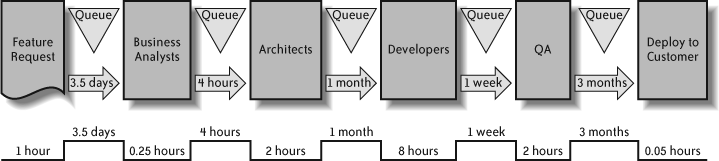
You can see that this team follows a fairly standard Waterfall process. In this case there is a queue between each process step. For VSMs in general, this is probably unusual, but it is very typical for a Waterfall software development process.
This team typically receives 18 feature requests each month, which then go through the following process:
Once a week, a business analyst rejects or approves (and prioritizes) all of the feature requests received in the previous week.
Architects estimate the implementation time and create a design for the feature.
Developers code and test the feature.
QA verifies that the feature works and satisfies the original requirement (feature request).
Every six months the company deploys a new release of its application containing all of the features implemented in the previous six months.
The VSM has been populated with time data based on its historical record. The timeline running along the bottom shows the value-added time in its lower segments and the wait time (or non-value-added time) in its upper segments. Even with this simplified VSM, a lot of things can be learned.
First off, how long does it take to implement and deploy a typical feature request? Adding the times in the timeline tells us that it takes about four months and five days. Looking at the bottom row of the timeline tells us that only 13.3 hours of that time is value-added. The vast majority of the time, features are waiting in a queue.
It’s pretty obvious that one of the easiest ways this team could deliver value to the customer more quickly would be drastically reduce the time between deployments. The practice of having the company’s business analysts triage the new features only once a week seems like an insignificant delay when the application is only deployed every six months. But if the deploy time is drastically reduced, the triage time will start to look significant, and it might start to make sense to handle feature requests in real time as they arrive.
A more detailed VSM might show steps that are completely non-value-added. Such steps, once identified, can be quickly eliminated.
Many VSMs will also show the typical number of work items in a queue, known as work in progress (WIP). They might also show the percent of work items that left a process step without defects (first-time quality). When analyzing a VSM, the primary goal is to find opportunities to reduce cycle time, minimize WIP, and maximize first-time quality.
Once improvement opportunities have been identified in a VSM, the next step is to draw a new VSM that incorporates the improvements. This is called the Future State VSM. Finally, a plan will be created for transitioning from the current VSM to the future VSM.
Other Lean Techniques
There are many more Lean techniques and practices that are more focused than the Lean analysis practices we just covered. These techniques can be applied in specific circumstances or for particular purposes. We’ll briefly mention a few of them here.
Root Cause Analysis (Five Whys)
The Lean response to resolving a problem is not to merely fix the surface problem, but to find the root cause of the problem and fix that. Root cause analysis techniques are used to do this. Root cause analysis is not unique to Lean, but it is a fundamental part of Lean thinking.
There are many ways to do root cause analysis, but one of the most common and easiest to remember is known as the “five whys.” This simply means asking the question “Why?” at least five times. For example:
- Why did the application crash?
Answer: Because the database schema didn’t match what the application thought it was.
- Why did the database schema not match the application’s expectation?
Answer: Because a bad hard disk required us to restore that database from a backup, and the restored database was from the previous version of the application, with an older schema.
- Why wasn’t the database restored from a version with the new schema?
Answer: We didn’t have one.
- Why didn’t we have one?
Answer: Because database backups are made nightly and the hard disk crashed after the application was deployed but before the database was backed up.
- Why didn’t we make a database backup as part of the application deployment?
Answer: That’s not part of our deployment checklist.
Without doing a root cause analysis, the team might have just fixed the database to have the correct schema. However, this would leave the team vulnerable to having this problem recur in the future. The root cause analysis identified the actual root cause of the problem, and it resulted in an update to the deployment checklist to include backing up the database, thus preventing this problem from recurring in the future.
The preceding example had a single root cause. In many cases there are multiple root causes, so you have to keep this in mind as you do your analysis (a fishbone diagram provides a good way to capture multiple root causes of a particular problem). Also, five is not always the correct number of “whys.” Make sure you reach the root cause before you stop asking.
Some other root cause analysis techniques you might want to research include:
Pareto analysis
Ishikawa diagram (fishbone diagram)
Fault tree analysis
Cause mapping
Kanban
We’ve talked quite a bit about delivering incremental value by using short iterations. In some situations, it may be preferable to use a continuous pipeline strategy rather than fixed iterations. Once a product moves into a sustaining mode with an expected steady stream of change requests and bug reports, a continuous pipeline process might make sense. This is when you would use a kanban system.
Kanban is a simple yet very effective scheduling system for maximizing flow and minimizing work in progress. It derives from the Japanese words kan (meaning “card”) and ban (meaning “signal”).
In a manufacturing environment, the kanban can be a card, a colored golf ball, an empty bin, or anything that can be used to indicate that a product or part has been depleted. A kanban is, in essence, a signal that will trigger replenishment of that product or part.
In Lean manufacturing, kanban is a key tool in implementing a pull-based assembly line. When a finished product is removed from the end of the line (due to a customer order), it pulls a replacement product from final assembly by sending it a kanban (that kanban is returned with the replacement product). If final assembly runs out of a part, final assembly sends a kanban to manufacture more of that part. This process cascades up the value stream, effectively pulling products through based on customer demand.
Small amounts of inventory are necessary at various stages in the manufacturing process to even out the manufacturing flow. You can control this by increasing or decreasing the number of kanbans at each step. A common Lean strategy is to start with plenty of kanbans at each step (lots of inventory) and then slowly reduce the number of kanbans to see where problems emerge in the value stream. After fixing the problems, the process can be repeated by once again reducing the number of kanbans.
So, how can this be applied to software development?
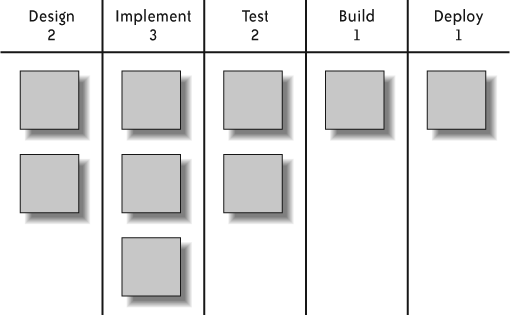
In software development, you will typically see a kanban system implemented using colored sticky notes on a whiteboard. Suppose that we have a sustainment process that takes each request through the following steps: design, implementation, test, build, and deploy. The kanban board might look like Figure 9-2. You can use different colors of sticky notes to denote different types of work items (such as bug reports or feature requests).
In a Lean system, the ideal is single-piece flow with no buffers or queues. In this example’s process, it would mean that each state (design, implement, test, etc.) would have a single work item that is being handled in parallel with all the others, and that each state’s work item would be the same size and they would all finish simultaneously and pass their work items on to the next state. We all know the probability of that happening is near zero.
The problem with achieving the ideal is variation. The work items vary widely in size (some are small and some are large). In addition, the amount of time (for a given work item) in each state will also vary. For example, it usually (but not always) takes longer to implement a feature than is does to design it.
So, in our kanban example, each step has a WIP limit that is proportional to the amount of time that a typical work item is in that step. This limit is the maximum number of work items allowed to be in that state at any given instant. In this example, the implementation step has a limit of three, whereas the design and test steps have a limit of two. If a step is below its limit, it can grab a work item from the previous step as soon as it is available. If a step is at its limit, it must wait for one of its work items to complete and to be pulled into a downstream step before it can pull a work item from its upstream state.
This type of kanban board lets anyone on the team see the current state of affairs at a single glance.
Variations in the size of work items can still cause upstream steps to congest and downstream steps to temporarily starve. If this happens regularly, resources should be added or subtracted and the corresponding WIP limits adjusted to “balance the line.”
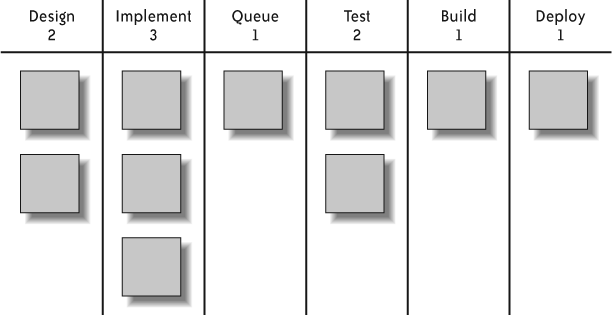
However, sometimes all that is needed is to introduce a buffer to help even out the workflow. In Figure 9-3 we have added a queue that can hold one work item. This somewhat decouples the test step from the implementation step and ensures that the test step almost always has a work item immediately available (assuming the other limits are appropriately tuned).
In general, Lean would consider a queue to be a red flag for possible waste. However, when you consider its effect on the overall workflow, not having the queue might be even more wasteful. Small buffers, judiciously placed with the smallest feasible limits, can often improve the overall throughput. This would fall under the principle of optimizing the whole.
Make It Visible
One common theme that you will find running through most Lean practices and implementations is the desire to make the state of the value stream immediately visible and obvious. Take any process (be it a manufacturing assembly line or a software development process) and devise a way to show, in real time, the overall status in a large, highly visible manner. The result is likely to be increased morale, productivity, and quality.
This happens because team members can now see the current status at a glance, giving them quick feedback on how the team is doing, and making it easy to spot problems before they get out of hand. This sense of control increases morale, satisfaction, and pride. In addition, management is better informed so that when problems do crop up, there is better cooperation between management and developers. Everyone works together toward a solution because everyone understands the situation in the same way.
The more you can do this, the more the benefits you will accrue. Let’s briefly examine a few examples.
Kanban systems are a good example, as they almost always use some physical object to serve as a visible signal. An Internet search for “kanban software development” will turn up many pictures of kanban boards being used for software development. These pictures make it obvious that each of the kanban boards is communicating a lot of information at a glance.
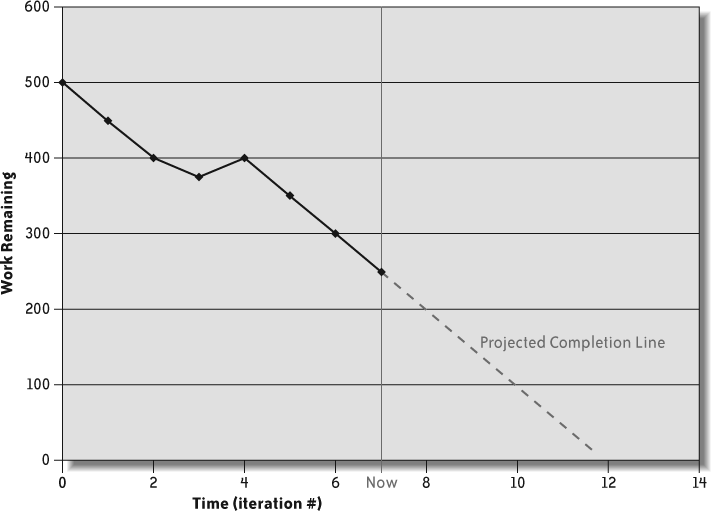
A popular chart for showing the overall progress of a project is the burndown chart. Figure 9-4 shows a sample burndown chart. This chart shows the work remaining over time and can show at a glance whether the project is on track or not. Maintaining informative charts like this on a large whiteboard can provide the kind of visibility we’ve been talking about.
If the team is not colocated, these kinds of charts have to be kept electronically. However, it’s not good if people have to actually navigate somewhere to see the chart—this drastically reduces its usefulness. In this case, an equivalent method would give each location a large flat panel display that would hang in a highly visible location (above the coffee pots?) and always display the current chart(s) updated in real time.
A CI server is another good example of making it visible. A CI server monitors the source code repository for changes. When a change to the source code is detected, the CI server will retrieve a fresh copy of the source code, build the system, and run all automated tests. A CI server supports making it visible by bringing any failures in the automated build and test process to the immediate attention of the developers.
This could be as simple as displaying green or red on a web page. But that is not ideal because it requires someone to go and look. A better system would actively notify the developers (via email, RSS, SMS text message, etc.). We have heard of a very innovative approach that used a little bit of custom hardware that caused one of those old rotating, flashing red police lights to go off whenever the CI server found an error! This would be an example of an Andon display (mentioned in Lean Speak” in Chapter 1).
Other Complementary Approaches
There are some complementary business management strategies whose methods and techniques are often combined with (or used by) Lean. As you read the literature on Lean, you’ll run into these methods repeatedly. We won’t discuss them in detail in this book, but we want to give you the basics so that you’ll recognize them when you see them.
The ones you’ll hear about most often are the Theory of Constraints (abbreviated as ToC), Critical Chain (ToC’s engineering counterpart), Six Sigma, and Capability Maturity Model Integration (CMMI).
Theory of Constraints
ToC and Critical Chain (CC) are the brainchildren of Dr. Eliyahu Goldratt. They are based on a few simple principles and a set of problem-solving processes and tools for improving a business process (which includes the process of developing software). ToC and CC are based on the idea that at any given point in time there are one or more constraints limiting the performance of the overall process.
The tools and methods of ToC and CC are designed to help you identify these constraints and then remove them. This, of course, changes the system and results in new constraints. In the spirit of continuous improvement, this process of finding and removing constraints is applied repeatedly.
Once you start reading about ToC and CC, it is easy to see the parallels with Lean. There is currently a little bit of industry talk about applying ToC and CC to software development, but there are no serious efforts that we are aware of to actually do so.
Six Sigma
The goal in Six Sigma is to dramatically increase quality through root-cause defect reduction. The term “six sigma” comes from the mathematical field of statistics and refers to how far a process deviates from perfection. Six sigma specifically means no more than 3.4 defects per million opportunities—a very tough standard that requires near flawless execution. Six Sigma includes a number of tools and techniques (actually, an entire methodology) that are used to work toward this goal.
Although it is common to find Six Sigma combined with Lean in the manufacturing world, this is not the case in software development. An Internet search for “six sigma software development” will turn up a few references, but not much. Of late, Six Sigma has come under attack for stifling innovation. We suspect this will not encourage its adoption in the software world.
Capability Maturity Model Integration
CMMI is a process improvement approach that provides organizations with the essential elements of effective processes. It was originally developed for software development, but it has been adapted for use in other areas.
CMMI evaluates and measures the maturity of the software development process of an organization on a scale of 1 to 5, with 1 being the least mature and 5 being the most mature.
These are some of the characteristics of an immature organization:
Process improvised during project
Approved processes being ignored
Reactive, not proactive
Unrealistic budget and schedule
Quality sacrificed for schedule
No objective measure of quality
Contrast that with the characteristics of a mature organization:
Intergroup communication and coordination
Work accomplished according to plan
Practices consistent with processes
Processes updated as necessary
Well-defined roles/responsibilities
Management formally commits
CMMI provides industry best practices to support an organization’s improvement work in a number of categories:
- Process management
These are practices for handling the overall process improvement cycle, including identifying needs, performing diagnoses, planning the improvements, and managing the deployment of improvements.
- Project management
These are best practices for planning and managing projects.
- Engineering
Technical best practices for performing the software or systems work.
- Support
These practices apply to support functions such as quality assurance and measurement.
If CMMI is implemented correctly in the intended spirit of genuine process improvement, it is very compatible with and complementary to the Lean approaches we have been espousing. The only thing to be wary of is the occasional organization that will implement a CMMI program as a “checklist” item solely to get a particular rating. This usually results in a heavy-handed process that is anything but Lean.
Where to Go from Here
We’ve finally arrived at the end of this book’s journey, but we hope that it is just the beginning of your journey. Just remember the old quote that “Rome wasn’t built in a day,” and realize that change takes time, patience, and (most of all) perseverance.
We hope that we’ve provided you with a road map to help guide your initial foray into Lean software development. There is a substantial amount of detailed material that you can draw on for more specific advice about each topic that we have touched on here.
If you are going to be introducing Lean software development to your company or organization, you should be aware of one topic that we have not addressed: how to be an effective change agent.
That’s a huge topic to which we could not even begin to do justice in this small book. So, we’ll leave you with a couple of book recommendations that can help you learn the change agent skills you will need:
Fearless Change: Patterns for Introducing New Ideas by Mary Lynn Manns and Linda Rising (Addison-Wesley, 2004)
Agile Adoption Patterns: A Roadmap to Organizational Success by Amr Elssamadisy (Addison-Wesley Professional, 2008)