
Chapter 9. Return on Prevention: Investing in Capital Assets
Financial modeling is a fundamental component of all business investment cases. IT security investment proposals have unique qualities that can pose expenditure justification challenges. This chapter is designed to explore various financial models and to develop one that IT managers can effectively use to support their business cases.
This chapter covers the following topics:
• Examining cost of attacks
• Budgeting for security equipment
• Analyzing returns on security capital investments
• Acknowledging nonmathematical security fundamentals
Examining Cost of Attacks
Determining costs incurred as a result of specific attacks should seem simple enough to do, but typically many intangibles are involved and costing analyses can prove somewhat challenging.
This section considers the following topics:
• Determining a baseline
• Providing alternatives
Determining a Baseline
In 2003, the Computer Security Institute and Federal Bureau of Investigation (CSI/FBI) survey reported that while 75% of its respondents reported financial losses from having been attacked, only 47% of them were able to quantify the amounts.1
Corporations and individuals can use information from organizations such as the CSI/FBI, along with other equally reliable sources, when attempting to put a dollar figure on events, or they can determine their own costs. Regardless of the route taken, an IT manager who is charged with developing a business case for network security is strongly encouraged to use measurable financial figures to ensure that the proposal presented to executive management is based on credible fundamentals.
Should an IT manager want to develop his own costing analysis for a virus attack, as an example, some of the important business elements to consider are as follows:
• Cleanup costs, specifically the following:
– Number of workstations and servers affected
– Typical amount of hours it took to clean the affected equipment
– Average labor rate of those performing the cleanup operation
– Cost of external help
– Costs as a result of the system, or certain equipment, being down, as follows:
Number of hours employees were without workstations and servers
Productivity per employee lost because of system, or specific equipment, being unavailable
• Lost revenues
• Loss of integrity, in the eyes of customers, suppliers, employees, and the general public
• Potential loss of goodwill
• Potential exposure of intellectual property
• Possible damage to customer relationships
• Possibility for legal ramifications
The process of calculating the costs of an attack can be rather involved. The CSI/FBI information is culled from a wide cross section of industry, and it can serve as a reliable alternative to calculating costs in-house. Looking at major business categories by industry type, respondents of the survey are identified as emanating from the following areas:
• High-tech sector, 17%
• Financial sector, 15%
• Governmental agencies, 15%
• Manufacturing sector, 11%
• Medical sector, 8%
Breaking down survey responses by organization size and considering only major categories, respondents were culled from the following groups:
• Organizations with more than 10,000 employees, 28%
• Organizations with 1000 to 5000 employees, 22%
• Organizations with less than 100 employees, 18%
For the purposes of this chapter, data collected by the CSI/FBI survey is used to ensure a certain objectivity and uniformity to the models presented throughout. Note that while the figures listed are considered conservative in nature, it is acknowledged that the act of collecting data in this manner is not scientific and is not representative of an empirical analysis.
The CSI/FBI survey does not, nor can it, qualify respondents’ policies and practices. But those issues notwithstanding, it can serve as reliable tool that organizations can use to establish a baseline of general costs.
Providing Alternatives
The CSI/FBI statistics can provide reliable measuring points, but IT managers can use alternative methods when developing a business case for network security. Single-loss expectancy (SLE), annualized rate of occurrence (ARO), and annual-loss expectancy (ALE) can be effectively used when attempting to place value on an event that did not occur.
This section considers the following topics:
• Single-loss expectancy
• Annualized rate of occurrence
• Annual-loss expectancy
Single-Loss Expectancy
The single-loss expectancy (SLE) is the cost associated with a single attack on a specific asset. SLE is typically determined by multiplying an asset’s value (for example, the value of a server) by its exposure factor. The formula for calculating SLE is shown in Equation 9-1.
Both asset value and exposure factor are examined in the following subsections.
Asset Value
Asset value can be challenging to estimate. In the example of a web server, you must determine whether the asset value represents the data or simply the media in which it resides.
The asset value could be represented by the formula shown in Equation 9-2.

The asset value cost would vary depending on the kind of attack that had occurred. A DoS attack, as an example, would typically not involve hardware replacement, whereas an outright theft of a server would include many possible variables, such as costs associated with loss of confidentiality and integrity.
Table 9-1 illustrates representative figures that an IT manager can use to estimate the value of a stolen web server.

Exposure Factor
An exposure factor illustrates an asset’s vulnerability to a given threat. It measures the magnitude of a threat’s impact on a particular asset and determines a percentage of the asset that would be lost should a particular type of threat occur. Table 9-2 contains values in which an IT manager has estimated the exposure factor of a web server for two possible events.

SLE Example
Using the SLE formula, you can plug in the total asset value calculated in Table 9-1 and the exposure factors illustrated in Table 9-2 to calculate the SLE of a DoS attack or a physical theft of the server. The results for each of these events are shown in Equation 9-3.

An IT manager can attempt to estimate the total costs surrounding a single attack, or she can instead choose to pull information from an array of different sources. The CSI/FBI information has been discussed, but other governmental and institutional agencies gather information as well, including the UK Department of Trade and Industry (DTI) Information Security Breaches Survey 2004, published by Pricewaterhouse Coopers (PWC) and the DTI.
Depending on system resources and time availability, using third-party data can ensure greater credibility and speedier compilation when developing a business case. For example, the CSI/FBI report states that in 2003, the average loss due to a system penetration attack was $56,212. The ability to determine similar numbers internally can be challenging.
Annualized Rate of Occurrence
The annualized rate of occurrence (ARO) is the probability, or rate, that an attack might happen over a one-year period.
Table 9-3 illustrates two probabilities of attacks, likely estimated by an IT manager.

Statistics can be excellent tools, provided that sources are reliable. The CSI/FBI determined, as an example, that 36% of its respondents had been victims of system penetration attacks in 2003.
Note that at times, statistics from different sources can appear to be conflicting. In organizational environments that are focused on prevention, it is prudent to err on the side of caution while continuing to study the trending.
Exposure factor is often represented as a decimal value, whereas ARO is usually represented as a percentage.
Annual-Loss Expectancy
With SLE estimates and ARO statistics completed, the annual-loss expectancy (ALE) can be calculated. The formula used is shown in Equation 9-4.Equation 9-6 represents the ALE from a system penetration attack when figures are sourced from the CSI/FBI statistics. The ALE can be used in a capital-budgeting process whenever an organization is considering an equipment investment proposal. Relevant attack costs can be determined in-house, or organizations can comfortably use external information culled from a wide cross section of industry and government on the North American and European continents.

Equation 9-5 illustrates DoS and theft ALE when the estimated numbers are used.

Budgeting for Security Equipment
The next step in the business case is to develop a cost model for the equipment that is designed to protect an organization from attack.
This section explores the cost of equipment, as follows:
• Total cost of ownership
• Present value
Total Cost of Ownership
The total cost of ownership (TCO) includes all associated equipment costs, whether recurring or nonrecurring, including all aspects of hardware, installation, maintenance, and upgrades.
The following model, presented in Tables 9-4, 9-5, and 9-6, provides an example for assessing costs, but it does not purport to be exhaustive. If other costs are pertinent to an organization, such as ongoing training, as an example, they should be included in the final model. Note that the costs shown in Tables 9-4 and 9-5 are incurred only in the first year of ownership.


Depending on the organization and the level of analysis expected from those who prepare the metrics, additional TCO variables could include the cost of floor space, insurance, utilities, and so on.
The following TCO calculation uses a model that restricts cash outlay to the first year. Because many factors can affect overall calculations, including, but not limited to, amortization period or whether the equipment is being rented or leased, you are encouraged to gather as much data as possible before compiling this portion of the model.
From Table 9-4 through Table 9-6, TCO can be calculated as shown in Equation 9-7.

Later in this chapter, the model is more rigorously held to financial analysis standards by bringing all elements to present value. But for the following TCO example, a firewall that is expected to be in production for three years is examined.
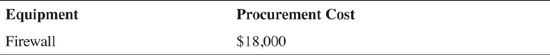
Table 9-7 shows the procurement costs (P), Table 9-8 shows the nonrecurring associated costs (N), and Table 9-9 shows the recurring associated costs (R) for this example. Note that the costs shown in Tables 9-7 and 9-8 are incurred only at the beginning of ownership.


Equation 9-8 calculates the total cost of ownership for this firewall, which is expected to be in production for three years.

Every business proposal can require a different level of analysis, and acknowledging that an executive audience might require an in-depth examination of total costs for proposals under consideration, the following section explores the concept of present value.
Present Value
Present value is the process of valuing a future payment, or cash flow, in current or present-day dollars.
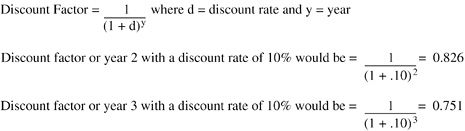
To analyze future cash flow in its present time value, future expenses need to be applied to a discount rate—a particular interest rate that brings future cash flow to its present value, allowing it to be stated in current dollars. A discount rate eliminates the time value of money from future cash flows.
The discount rate is also referred to as cost of funds or cost of capital. It is the rate used for adjusting the present economic value of a resource, for example, the cash flow needed to purchase a firewall. Because equipment typically has a useful life of three years, present value takes into account the declining value of money. The discount rate approximates a calculated rate that is typically higher than a central bank’s lending rate, or similar standard financial metric, such as lease rate, cost of (borrowing) money, or the potential opportunity cost of funds no longer available for other investments. The discount rate is used in capital-budgeting tools, such as return on investment (ROI), net present value (NPV), and internal rate of return (IRR), to calculate future cash flows back to present dollars. It equalizes various investment options, in particular those with varied useful lives.
By removing the time value of money from future cash flows, a discount rate attempts to account for the declining value of money.
The IT manager can estimate the discount rate or consult with the finance department to determine the capitalization rate typically used by the organization.
Use Equation 9-9 to calculate the present value of TCO.
Using the previous firewall TCO example, and assuming a three-year useful life for a firewall, the following example illustrates the three-year period by using a discount rate, or cost of capital, set at 10%.
Table 9-10 shows the values for the TCO present value calculation before accounting for the time-adjusted recurring associated costs.

Table 9-11 shows the TCO present value calculations for this example using a discount rate, or cost of capital, set at 10% using the formula shown in Equation 9-9. The Cash Flow Present Value column of Table 9-11 shows the time-adjusted recurring associated costs (Time-adjusted R) by multiplying the Discount Factor by the Cash Flow.

The adjusted time value of money illustrates that in today’s dollars, the firewall would cost $36,230 for a 3-year useful life.
Analyzing Returns on Security Capital Investments
When compiling data for an IT security investment proposal, it can be challenging to deliver one of the most basic capital-budgeting requirements: quantifying returns of events not happening, while using objective figures to support the business case. Fortunately, information collected in the annual CSI/FBI survey can serve as independent, impartial, and reliable data that can effectively illustrate potential costs and associated vulnerabilities inherent in under-security.
Choosing an acceptable and representative evaluation tool is the next challenge the IT executive faces, and this section aids in the search of an appropriate analysis tool by exploring the merits of the following topics:
• Net present value
• Internal rate of return
• Return on investment
• Payback period
• The bottom line
It is important to note that while other models can be used, such as economic value-added and option models, the discussion in this book is best served by focusing the analysis on the four methods covered in this section.
Net Present Value
Net present value (NPV) provides a dollar value for a future return brought back to present time. It is calculated by adding the present value of benefits, for every year over a specified time period, and then subtracting the initial recurring and nonrecurring costs of the investment. A positive NPV represents a profit, while a negative NPV signifies a loss.
To calculate the NPV of a security equipment acquisition proposal, the formula shown in Equation 9-11 is used.
The following example continues the firewall example from earlier in this chapter to show the NPV:
Step 1. Calculate the present value of TCO—Table 9-11 illustrates that the present value of TCO over three years would be $36,230.
Step 2. Calculate the present value of money saved by having avoided attacks—Table 9-12 illustrates that the present value of money saved over three years would be $39,776. This value is based on yearly upgrades to software to provide constant protection.

[1] If the firewall were not consistently upgraded, the year-over-year savings would likely be less, because a firewall must be current to protect efficiently. For example, while the savings in year 1 would be $16,000, the potential savings could drop by a third each subsequent year, because lack of updates implies less potential protection.
Step 3. Calculate the net present value of cash flow when investing in a firewall—Apply the values to the NPV formula shown in Equation 9-12.

NPV Example Bringing All the Elements Together (Alternate Method)
Table 9-13, which arrives at the same results as the previous NPV example, illustrates the NPV of the investment where TCO and savings are included in present value.

Both examples demonstrate that the NPV of the investment is positive, and therefore the recommendation is to invest in a firewall.
In the previous examples, the NPV calculations were determined using costs savings culled from the CSI/FBI statistics.
In a new example, Equation 9-13 presents annual costs savings (ALE) from purchasing an intrusion detection system (IDS) for a web server segment to prevent DoS attacks (from figures calculated earlier in the chapter).
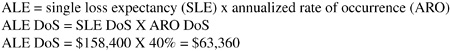
Table 9-14 shows the NPV using this ALE, considering a DoS attack on this web server segment.
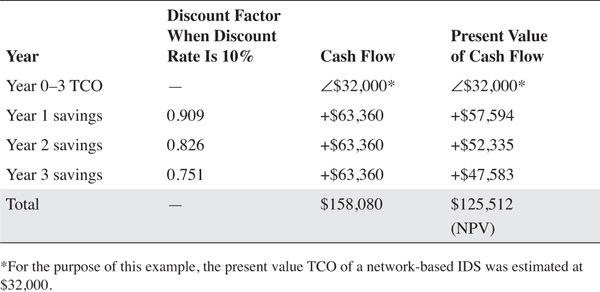
Calculating NPV provides a view of the required cash flow that is stated in current, or today’s, dollars. When the present value of the savings is not considered, the value of an IDS system appears to be $158,080. By using present value to calculate the TCO and potential savings, the net present value becomes $125,512.
Internal Rate of Return
Internal rate of return (IRR) can be viewed as a sort of go/no-go decision level for an investment proposal. IRR is often used to analyze investments that span over many years. IRR is similar to NPV in that IRR equals the discount rate by which the net benefits must be discounted, over the time period, until the point that they equal the initial costs. Table 9-15 provides a simplistic example of IRR.

Table 9-15 illustrates that the cost of capital would have to be less than about 15% to make the financial investment in a firewall feasible over a three-year period, which is typically considered the useful life of corporate networking equipment. That assumes losses would be no greater than $16,000 per year. (Estimating that an attack would cost $80,000, and that chances of falling victim to such an attack were 20% per year, derived savings of $16,000.) The CSI/FBI reports figures that are higher; therefore, firewalls, particularly at the perimeter of a network, can be a wise investment.
Return on Investment
Return on investment (ROI) is a reliable tool that is widely used to compare the attractiveness of various business investments. ROI equals the present value of the net benefits over the useful life of the proposed equipment, divided by the TCO of the equipment. It is usually expressed as a percentage over a specific amount of time; three years is a common timespan for IT equipment. The ROI formula is shown in Equation 9-14.
The following example illustrates the ROI for the firewall from previous examples. All savings and costs are shown in present values in Equation 9-15.

While ROI relates the percent return expected from a particular project, it does not specify the magnitude of the project. This begs the question "Would a 20% return on a $10,000 project be better than a 10% return on a $50,000 project?" NPV would be a superior source for that type of comparison criteria.
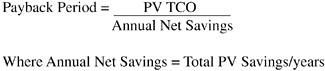
Payback Period
Payback period states how long it will take an investment to recoup initial funds and show a profit, a significant element when time and cash flow are an issue. The payback period formula is shown in Equation 9-16.
Equation 9-17 illustrates the payback period of a firewall.

While payback is simple to calculate, its drawback is that it does not sufficiently illustrate the magnitude of the savings, nor does it highlight any benefits the investment could provide after the break-even point.
The Bottom Line
This chapter presents a number of financial methods IT managers can use to fiscally rationalize their security investment proposals. Each process has its own unique limitations, not the least of which is the challenge of attempting to derive a return, a discount rate, or a present value from an event not occurring.
IT security is a relatively young industry. Most established industries have a wealth of actuarial data that has been amassed over decades. The security field relies on recent data, culled from concerned IT and business professionals who cut a wide swath across industry and government and whose common goal is to create a forum for sharing this pertinent data.
IRR and NPV bring unequalled value to financial modeling, but given the specific nature of IT security investing, it is the view of the authors that ROI, or return on security investment (ROSI), is the most appropriate vehicle to ensure the effective development of an informed and substantive business case for network security. But no single method is perfect for assessing security capital budgeting. What cannot be disputed, whether the source is CSI/FBI, PWC-UK, or any other well-regarded resource, is that cyber-crime is on the rise, and the risk to industry, both in dollars and reputation, must be measured by every organization before any long-term plan can be put in place.
Acknowledging Nonmathematical Security Fundamentals
Much of the discussion in this book has centered on why, how, where, and what to secure. But the question of when to secure is somewhat more elusive. Financial modeling can dictate that the time for security is when it is financially feasible. Managers might say that the time for greater security in when something is relevant to secure. But much of what is protected in IT security is not always tangible, for example, customer relationships, trust, goodwill, and the sanctity of data that supports each entry on a financial statement.
Organizations are highly exposed to the vulnerabilities inherent in Internet connectivity, and the exposure increases every day as viruses become more virulent and users neglect to exercise ever-greater caution. Moving away from the Internet is not an option for most organizations. Competitiveness demands an ever-increasing presence, and therefore reliance, on all things electronic. But many organizations have grown much larger by using their reliance on the Internet, as the face of business transactions has changed dramatically over the last generation. In her article in iQ magazine, Kathy Harris identifies ten categories of potential value that businesses can realize by virtue of being connected to the Internet: from quick time to market, new revenue streams, improved customer service, and greater process effectiveness to the creation of intellectual capital, greater asset utilization, and better connectivity with partners and vendors. The argument is made that softer benefits resulting from the newfound reliance on the Internet are difficult to quantify, yet going backward cannot be an option. She goes on to state that, "… creating value propositions always requires a certain amount of qualitative judgment.”2
The financial modeling in this chapter should be fully used and effectively presented. But in the end, IT security is far greater than the mere sum of its parts.
Summary
This chapter explored various options IT managers can use when developing a business case for network security. Certain financial tools, such as IRR and NPV, are appropriate for situations that can deliver tangible results, for example, the benefits derived from installing a new customer relations management software system. The benefits resulting from the new software can be reflected in a multitude of ways, from an increased level of calls handled in a call center to fewer people required to perform the same amount of work.
But given the intangible elements that are inherent in IT security investing, ROSI is presented as the most apt vehicle to deliver measurable results.
Comprehensive metrics are not yet available to perform empirical financial analyses for IT security. But items in the public domain, such as the CSI/FBI annual surveys and the PWC UK biannual surveys, serve to provide a compelling argument for the need for greater security. Chances of attack are no longer negligible and, should one strike, the ramifications can be potentially severe. But moving away from Internet connectivity is not an option for most organizations, because the benefits realized from online interactivity far outweigh the downside risks.
This chapter explored the following topics:
• An examination of the cost of attacks
• A process of budgeting for security equipment
• An analysis of security capital investments returns
• An exploration of nonmathematical security fundamentals
End Notes
1. "Computer Crime and Security Survey 2003.” Computer Security Institute and Federal Bureau of Investigation (CSI/FBI). www.gocsi.com/forms/fbi/pdf.jhtml.
2. Harris, K. "Eye on results, a renewed focus on metrics helps companies invest more strategically—and wisely.” Cisco iQ magazine. November/December 2002.