
In This Chapter
Assess energy, water, and fuel usage
Measure waste output
Develop better efficiencies of resource usage
Cut costs and increase profits
Everything we do has an impact, a cause and effect, on the environment. Everything on a store shelf has a story. Actually one might say that each product has two stories: the marketing story and the backstory.
What’s the backstory? In literature, the backstory is everything that happened leading up to the situation in which the characters find themselves at the beginning of the narrative. In commerce, the backstory is everything that has happened to the product before we buy it.
In this chapter, we look at the backstory of each of these impact areas to further understand how your business impacts the environment.
A great example is food: Who raised it? Where was it grown and on what kind of land? Did the farmer use fertilizers and pesticides or integrated pest management? Antibiotics or free-range grazing? Was the soil conserved, or is it eroding and depleted? By what mode of transportation did it reach us? How was the money we spent on it split up and were the people involved in the processing paid fairly for their efforts?
The 3 Ts (trust, transparency, and traceability) are important areas of the supply chain focus. So the first area we focus on in understanding how your business impacts the environment is sustainability. In Chapter 19, we discuss a sustainability report, so we won’t go into that here. However, we do explore sustainability assessment and auditing.
Before we look at the function of a sustainability audit and assessment, let’s revisit the definition of sustainability.
In basic terms, we should live our lives and do business in a way that meets our needs and allows for success but doesn’t inhibit the ability of people in the future to do the same. It is a simple humanistic concept in its essence.
In the business community, sustainability is referred to as the triple bottom line or the integrated bottom line and is often accompanied by the motto “People, Planet, and Profit.”
When we look at doing an audit and assessment, the key is to understand our organizational boundaries and the operational boundaries, including the social and environmental.
A performance indicator is a point of data that enables an individual to monitor and measure an aspect of his business. It describes organizational performance in a clear, balanced, and unbiased way, which is one of the major challenges of effective sustainability reporting.
An environmental indicator is a measurement, statistic, or value that provides a gauge for or evidence of the effects of environmental management programs on the environment. Because we touch on sustainability, we have also included a list of social indicators to help you benchmark your social performance. Quantifying the baseline of your environmental and social performance will help you clearly define areas for improvement, give you a clear idea of where you can reap the greatest amount of financial benefit, and serve as a credible background when creating any green marketing messages.
As we stated earlier, everything we do has an impact. Benchmarking is a key step in creating any green business or sustainability program.
The Key Performance Indicators (KPIs) listed were designed with company sustainability reporting in mind. When you are deciding which KPIs to measure, make use of information that companies in your industry routinely collect. This way, you can start with industry baselines for measuring and monitoring your environmental, social, and financial performance. Talk to your industry association(s) to see if a program or framework exists; if not, develop a task force with in your industry to create a set standard for sustainability reporting specific to your industry.
Environmental (impacts on living and nonliving natural systems) | Social (impacts on the social systems and communities in which an organization operates |
|---|---|
Emissions to air | Labor practices |
Greenhouse gases and so on | Fair trade |
Volatile organic compounds | Human rights and so on |
Emissions to water | |
Includes anything that is discharged into a water source, including sinks, floor drains, streams, lakes, and so on | |
Emissions to land | Workplace diversity |
Waste—landfill, incinerated recyclables, compostables, and so on | Ethnic and gender diversity, particularly relating to management roles |
Pesticides, fertilizers, and so on | Pay broken out by role, by gender Age diversity |
Resource use | Community impacts |
Natural gas | Volunteering |
Water use and abstraction | Purchases that are local and so on |
Minerals and so on | Community donations |
Design for Environment (DfE) Take-back policy for end-of-life disposal | |
Considering environmental and social impacts throughout the product’s life cycle |
Remember these things when deciding which performance indicators to choose:
Select appropriate and meaningful indicators. Are they manageable and modifiable?
Select indicators that make sense to your business and your stakeholders. Always check in with your vision and the feedback from your stakeholders. Many companies take their indicators to the stakeholders for review before using them internally. This is also a requirement under the AA1000 sustainability reporting assurance framework. For more information, go to www.accountability21.net.
Find out where the data for your indicators is stored and how easy it is to collect. If you have an indicator that requires five steps in the data collection process, make sure it’s being collected regularly (and on time) so it is measured accurately.
Review what you are currently measuring and decide if you can dovetail it into the sustainability indicators.
We tried to cover some general areas without being too specific. Don’t get overwhelmed trying to cover everything all at once. Just start, and don’t try to do everything. Remember quality over quantity.
Creating indicators may seem like a daunting task and a fairly dull part of the whole sustainability program, but it is well worth the upfront investment for any successful organization.
Many regions are experiencing water scarcities due to drought, floods, or water pollution. As we experience climate change, further shortages will occur in regions where summer water supplies are dependent on winter snowfall. In many parts, we are using water faster than nature can renew it, and we need to reduce our wasteful water habits.
According to the Organization for Economic Cooperation and Development, the United States has the highest water consumption rates in the world, which is why more and more businesses are increasing their awareness of water use by conducting audits to better understand their use and to establish more efficient routines. This makes us vulnerable to higher water costs as water scarcity becomes an issue. Reducing your water consumption now will decrease immediate costs and will lead to an increase in future profits.
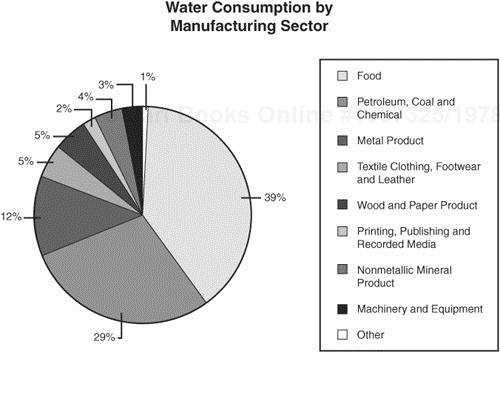
Water consumption graph.
(Courtesy Energy in Australia, 2006 ABARE.)
An organization should ask itself a few key questions as it starts to look at risks, related impact, and opportunities around a water sustainability initiative.
What is our water footprint? How much are we using and what are the related impacts of the water resources?
Are there water-related risks to our organization? Is the quality and availability of water adequate to meet the current and future needs of our organization? How do stakeholders view our use of and impacts on water resources?
Are there opportunities present through water for our company? How can we save money, enhance reputation, and reduce risk through changing our water usage habits, such as helping to improve water quality and access to those who need it?
How does the water-use practice tie in with our overarching sustainability vision? Is this consistent with the rest of our sustainability initiatives? Are we leaders, followers, or collaborators?
How can we set realistic goals? We need to have conservative targets so everyone can measure the gains and benchmark our goals against key indicators, such as kilolitres per square meter of space.
How can we develop a reduction strategy that follows the principles of avoid, reduce, reuse, recycle, and rethink?
How can we best involve our employees? Behavioral change will lead to water savings. Engaging staff will also empower them to find potential areas that we might not have thought of.
Going Green
The H2O Conserve Water Calculator is an interactive tool designed to help you figure out how much water you use, how you use it, and how you can use less. You can find it at www.h2oconserve.org/wc_disclaimer.php?pd=ca.
Doing a full water assessment can be more work than your organization has the resource for, so start reducing your usage by looking at the low-hanging fruit. Here are a few easy and inexpensive places to make changes:
Fix leaky taps. One drop per second wastes about 2,500 gallons a year.
Install a low-flow faucet aerator, which adds air to a water stream and can reduce water consumption as much as 50 percent.
Use lever or mixer taps (with a single lever or knob), which lets staff find the right water temperature quickly.
When cleaning, get staff to use a bucket to wash and rinse where possible, instead of running the taps or hose.
Check for leaks in taps, pipes, and hoses. Remember, one leaking tap can waste more than 500 gallons a month!
Regularly clean the lint filter on washing machines, and use a sink strainer when you pull the plug out of tubs. What you put down the drain can cause blockages and pollute our environment.
Provide incentives for staff to save water by linking water conservation to staff performance reviews.
Use visual tools like charts and graphs to highlight water savings to employees.
Mention water conservation plans and progress in staff meetings.
Include water conservation policies and procedures in staff training programs.
One of the more acceptable tools for measuring your water input is through the website of the World Business Council for Sustainable Development (www.wbcsd.org). The Global Water Tool (www.wbcsd.org/web/watertool.htm) enables companies and organizations to map their water use and assess risks relative to their operations and supply chain. The tool has two parts: an input sheet (a downloadable Excel spreadsheet) and an online map. The input sheet contains the company’s site location and water use information. After you enter your company’s water use figures, the sheet automatically provides outputs, including water indicators compatible with the Global Reporting Initiative requirements and downloadable metrics charts that demonstrate the company’s data combined with both the country and watershed figures.
Preparing an assessment of water quality is a detailed and time-consuming process, depending on the size of your organization and its constraints regarding people and budget. Anytime you start doing a water assessment, you should contact your local water works agency because of the many considerations you may not be aware of. For larger-scoped projects, you may even want to consider an outside expert who understands the water systems in the area of your assessment.
We have outlined six easy-to-follow steps, which should act as guidelines in performing your assessment:
Identify the assessment’s scope and motivation (drivers). Is it strategic? Tactical? Are there sensitivities you need to address?
Select the area or region where you will be conducting the assessment. Focus on areas where your operations have the greatest impact of the local water catchment.
Seek collaboration (partners). Other organizations may have interest in the same area, so see if you can share resources and set common objectives and goals.
Assess the water catchment. Look at it from lenses of an integrated approach involving social, environmental, and economic factors.
Prepare and implement an action plan. Where are the areas of improvement? What is the timeline? Who is involved?
Share the results. Create a report for the interested stakeholders, a press release, a section in your Corporate Social Responsibility report, or a new operating policy.
In general, most businesses (particularly manufacturers) can save water by reusing water from an appropriate source. To do this, they will most likely need to undertake a risk assessment of the water source and its intended uses and conduct trials to make sure the treatment process and its management works well and complies with guidelines and requirements.
Reusing wastewater can be an excellent way to reduce potable water use, but it can also be a costly and complicated process, so start your water conservation program with basic efficiency gains before exploring reuse projects.
When calculating your environmental impact, it’s essential to factor in your energy usage. Most processes rely on energy flowing freely each day to fuel machinery, lights, heating and air conditioning, and transportation of products and raw materials. Where do you get your energy? Are you relying on the burning of fossil fuels, or have you found a renewable energy resource such as wind or solar? Moving in that direction will help reduce your carbon footprint.
Calculating electricity usage is a straightforward process for organizations that own the building and facilities where they operate their business and for companies whose utilities are metered separately. For either case, create a spreadsheet and enter the data off your monthly utility statements; find the emissions factor for your utilities from the Environmental Protection Agency (EPA) E-Grid database at www.epa.gov/cleanenergy/energy-resources/egrid/index.html. The International Energy Agency (www.iea.org) and the United National Environmental Programme (UNEP) (www.unep.org) provide country-level electricity emission factors. If your organization does not own or occupy a whole building or you sublet or lease your space (without individual energy meters), you need to estimate your electricity usage based on information you can obtain from your property manager. The following are involved:
The total area of the building
The total area your organization occupies
The total building energy use in kWh (kilowatt-hours)
Use this formula to calculate your organization’s electricity usage:
Area of your organization’s space ÷ total building area | × | Total building usage of electricity | = | Approximate kWh used by your organization |
As you can see with the example, this is only an approximate usage of electricity of your organization and will probably be lower than the actual number you calculate. What you will most likely achieve in sharing the process with your building’s management company is an awareness of electricity usage, which will hopefully inspire other organizations in your building to follow your lead.
Perhaps you can see if the management company will help fund an electricity reduction program for the building. Why not ask? It will help everyone involved. Be the environmental champion in your building!
To know where you are going, you need to know where you are. Your office technology is no exception.
The following is a quick list of things to review and a suggested format of collecting data when you do an office inventory of technology usage.
When you have the data, you might want to look at formalizing some kind of environmental policy around shutting computers down before going home for the night and so on (see Chapters 8 and 15).
Item (categories suggested below) | Energy Star (Yes or no) | Serial number | Average hours used daily | Workstation environmental policy | Planned replacement date |
|---|---|---|---|---|---|
Computers | |||||
Copiers | |||||
Printers | |||||
Fax machines | |||||
Scanners |
Here are a couple of informal environmental best practices you can share (or post) by each equipment category:
Computers. —Turn off computer when not in use for 30 minutes and after office hours, or install software to switch off computers automatically.
Copiers. —Think twice about copying; copy double-sided; turn off copier when not in use if the warm up takes less than 10 seconds; turn off copier after office hours; set the power level to the lowest power needed.
Printers. —Send documents electronically rather than snail mail; print double-sided (for small-volume printers, print odd pages first then feed those pages again and print even pages on the other side); use print preview rather than printing a test copy; set default time for sleep mode to the lowest convenient setting; turn off printers when not in use after 10 minutes and at the end of the work day, or install software for automatic switch off.
Fax machines. —Set default time for sleep mode/standby mode to the lowest convenient setting, especially for fax machines, as they are in standby mode most of the time; make sure the fax machine has toner and ink saving modes; if you have more than one fax machine, divert calls after hours to a few units and turn the rest off; use scratch paper for the fax machine whenever possible; do use stick-on labels with the recipient name, date, and number of pages sent rather than a separate cover sheet; do not use status reports or individual transmission pages.
Scanners. —Because scanners aren’t a regularly used item in most offices, turn on only when needed; and turn the scanner off rather than use sleep mode.
Everything that leaves our business that isn’t for sale or gifted is waste. The concept of waste is not only from an environmental perspective but also from the perspective of economics. Every business spends money on the items it throws out. Surewood Forest Products, a stair parts manufacturer and distributor, implemented a cardboard recycling program at their Youngwood, Pennsylvania, warehouse. Each month, they saved an average of $600 per month on hauling costs. That is a total of roughly $7,200 per year!
With that rationale, the more we reduce what we throw out, the more costs we will reduce. Right?
Sometimes we can’t avoid waste, but having an inventory of what we throw out can give us a starting place to reducing those costs. Here are three easy steps in preparing a waste audit:
Obtain your waste disposal records.
Either go to accounting or contact your trash collector to obtain your monthly disposal services invoices, which can help you answer the following questions: How are you being charged, by the pull or by weight? How much are you paying each month? How much are you throwing away?
Walk through your facility.
A walkthrough of your facility is necessary to learn where trash is coming from and where it ends up. A walkthrough can also help you determine what material is being thrown away and identify reduction opportunities and potential savings. Plan the walkthrough when garbage bins and dumpsters are full. Contact your building maintenance staff for assistance, and ask when a good time would be.
So roll up those sleeves, put on the rubber gloves, and go on a diving expedition that would make Jacques Cousteau jealous. Of course, your dive will be in the dumpsters around your office and facility.
The more people in your organization you can involve in your waste audit, the better the results. Look at everyone from the corner office to the usual suspects.
Tools needed:
Small reusable tarp (for laying out the contents of waste paper baskets—look for anything that could be put into the recycling containers)
Digital camera (for taking those vacation shots)
Rubber gloves
Paper and pen (note taking is usually a good thing)
The waste audit worksheet
A good sense of humor!
The following is a worksheet for your waste audit.
Department: | |||||
|---|---|---|---|---|---|
Date: | |||||
Time: | |||||
Auditor(s): | |||||
No. of bins in office: | |||||
Size of bins in office: | |||||
Period of accumulation: | |||||
Waste Type | Approx Volume | % Waste Stream | Recycling Potential | Comments/Type | |
Paper/soiled paper | |||||
Cardboard | |||||
Aluminum cans | |||||
Liquid paper board (milk/juice cartons) | |||||
Glass | |||||
Plastics coded R, 1, 2, 3, 4, 5, 6, 7 | |||||
Uncoded plastics (i.e., packaging) | |||||
Polystyrene (i.e., coffee cups, packaging) | |||||
Food | |||||
Other (specify) | |||||
After you have done your assessment, summarize your findings on a spreadsheet and start looking for areas in which to reduce. Share your findings with staff, implement your waste reduction plan, and conduct another assessment to see how much you have improved.
Depending on your organization and what type of industry you are in, fuel may have a huge or limited impact on your overall environmental footprint. For car-based emissions, the emission factors are based on fuel use. Use your fuel receipts rather than estimate the fuel efficiency. However, if you are just starting to record your impacts, you may not have systems set up to calculate your exact fuel usage. In this case, you can visit a fuel efficiency reference guide such as one from the EPA, which you can find at www.epa.gov/greenvehicles/Index.do.
If you are not currently tracking your fuel use, create a spreadsheet to quantify the amount of fuel you use for each company-owned vehicle. This will help you gauge how much you spend on fuel per month and serve as a resource when calculating the carbon footprint generated from your business fleet. We will dive into carbon footprinting in Chapter 6.
Once you know how much fuel you are using, you can create a plan for use reduction. This will reduce your operating costs, increase profits, and reduce your environmental footprint.
There are several green business programs that can help you meet your sustainability goals. Here are a few examples:
The Energy Star Small Business Program is designed collaboratively for and with small business to help reduce energy costs, while helping protect the environment. Go to www.energystar.gov/index.cfm?c=small_business.sb_index to discover more.
The National Institute of Standards and Technology has a nationwide network of specialists that help small- and medium-size manufacturers through the Manufacturing Extension Partnerships program that combines environmental practices with “lean” manufacturing. Visit its website at www.mep.nist.gov.
The EPA’s Climate Change Site offers comprehensive information on the issue of climate change in a way that is accessible and meaningful to all parts of society—communities, individuals, business, states and localities, and governments. Go to www.epa.gov/climatechange/index.html.
Use the WRI’s GHG Protocol 9-to-5 program to help set boundaries and calculate your company’s total greenhouse gas emissions. You can find this at www.wri.org/publication/working-9-5-climate-change-office-guide.
The TeleCommuter Hire Savings Calculator is an online tool that shows the employee cost savings in getting cars off the road. Go to www.tjobs.com/hiresavings.shtml.
Zerofootprint.net contains information and a Personal Carbon Manager that enables you to measure, track, and manage your carbon emissions. You can find these tools at goblue.zerofootprint.net/?language=en.
As you can see, many tools are available to help you develop a reasonable assessment of your business’s impact on the environment. Using these measures will help you develop a plan to reduce your energy and water usage and waste output and to increase efficiency for your business. Taking a hard look at the figures you develop might encourage you to consider taking the step to install renewable energy sources, such as solar panels or a wind turbine, if appropriate. Cutting costs in these areas will help you save money and increase profits overall.