
CHAPTER 3
E&P Operating Model Redesign
Over the past several decades, large integrated and national oil companies have reached a general consensus in terms of their organizational architecture and internal operating models, with most evolving toward a matrix organization that combines geographical asset teams with strong centralized functional capabilities. Generations of workers have grown up in this matrix, and industry workflows and talent pools adapted accordingly. One central tenet, or core value, has been the unquestioned benefit of one consistent way of thinking and working. There have been many benefits to this approach—with global exploration, projects, and procurement functions reaping the benefit of efficiencies through economies of scale and enabling lessons to be learned and shared more effectively across the organization. This approach has been especially useful in the delivery and operation of large, expensive mega‐projects.1
The research on organizational design and operating models is less sanguine. There is a growing body of evidence to suggest that operating model design has been more Darwinian than any conscious, rational efforts toward optimization.2 Companies evolved their operating models subconsciously, on the basis of industry convention and the emulation of competitors. Second industrial revolution economy firms use a limited number of different operating models (e.g., functional, holding company, multiproduct‐division, country‐division, split‐business chain). These models implicitly are based on assumptions about the economic characteristics of resources, technology, institutional environment, human capital, scarcities in the economy, and so on. Since these elements are changing, so, too, are economic models, and so, too, must operating models. However, industry adaptation of operating models to new economic realities is generally halfhearted. Nonetheless, it remains possible to design company‐operating models for the new realities of an industry.3 And workflows may be improved better through the operating model than simply through making changes to the organizational form.4
As outlined earlier, the upstream oil and gas industry has undergone dramatic evolution and disruptive change; many aspects of its resources, technology, institutional environment, human capital, and more, are changing. Moreover, very few, or virtually no, operators have proven to be “world class” at unconventionals, and deep‐water, and late‐life assets, and oil sands, and arctic drilling, and international new frontier exploration, and so on.
Each of these resource types has its own requirements in terms of critical capabilities, and therefore requires unique accommodations in terms of operating models.
Table 3.1 Estimated New Source Production Based on Portfolios
Oil and gas companies face a wide range of requisite capabilities
Source: IHS Energy
| 2020 New Source Prod. | Unsanctioned | Offshore | Deep‐water | Conventional Onshore | Other | |
| 7 Large IOCs | 7 MM bpd | 22% | 65% | 32% | 35% | |
| 7 Large NOCs | 5 MM bpd | 30% | 73% | 40% | 18% | 9% |
| 12 Int'l. Indep. | 4 MM bpd | 25% | 31% | 10% | 9% | 60% |
The portfolios of many of the world's largest oil and gas companies (Table 3.1) face a daunting task for new source production and a very wide range of requisite capabilities.
Circumstances call for a low‐cost operating model, with fewer layers, more agility and collaboration with vendors/other operators, and more local adaptation. There is still a role for the matrix and centralized functional excellence, but we must also accommodate adaptions to suit circumstances—not only has the prevailing operating model not proven to be successful across all plays and resource types but it is no longer consistent with the demands of prevailing prices, industry economics, technologies, talent, and so on.
In a few cases (e.g., BP North Sea example above), operators have implemented broad change to accommodate a tailored operating model—such as BP's North Sea split into two divisions—but historically, oil and gas companies only changed their operating models on an enterprisewide basis in a post‐merger integration, or in concert with a financial restructuring—such as the divestment of downstream refining and retail operations, a corporate unbundling like the disaggregations undertaken by both Fletcher Challenge and Canadian Pacific, or the split of EnCana into Cenovus and EnCana.
However, other industries have more experience with operating model innovation in response to evolving industry economics and technologies.
For example, when facing a chronic decline in drug discovery success rates, as well as a decline in “blockbuster” discoveries (sound familiar?), many international pharmaceutical companies responded with operating models that supported licensing‐in or acquiring their new drug pipelines from smaller, independent biotechnology companies.
And when “big pharma” industry regulation became increasingly unfavorable on issues such as patent protection and channel marketing, profit margins were eroded by competition from unbranded generics—some industry players countered with their own generic divisions, established as autonomous units with their own low‐cost operating models. Novartis AG, the world's largest biopharma company, owns Sandoz, which became the name it uses for its generics business.
INTERNAL OPERATING MODEL
Whether consciously established or not, the enterprise operating model is generally comprised of five essential elements—though each of these elements is interlined—as outlined in Figure 3.1: (1) business delineation and performance measurement, (2) organization structure, capabilities and workflows, (3) formal management processes, (4) delegation of decision rights, and (5) informal social norms and corporate culture.
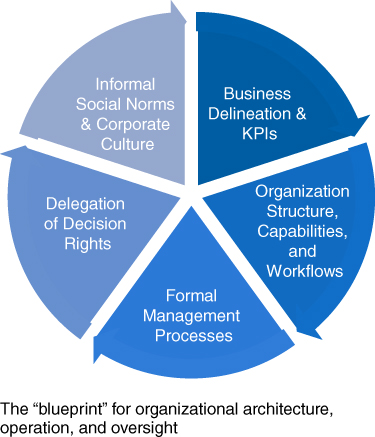
Figure 3.1 Operating Model Elements
Source: IHS Energy
BUSINESS DELINEATION AND PERFORMANCE MEASUREMENT
I cannot overemphasize how important this first step in operating model design is—it can be both the most powerful but also the most dangerous, in terms of driving behaviors and affecting the performance of the enterprise. Some of the biggest risks regard what to measure and how—to be addressed later—just because you can measure it doesn't mean that you should, and more importantly, doesn't mean it should have broad application for incentive compensation purposes. In the evolution away from functional organizations, many leaders create too many P&Ls within their business.
Business delineation identifies the constituents and boundaries of the main elements of the enterprise, including (1) enterprise headquarters and its functional centers of excellence, (2) front‐line operations business units, and (3) “back‐office” operations, or shared services. Operating units can involve upstream, midstream, or downstream operations, as well as different geographies, basins and plays, or resource types.
Business delineation is the time to establish economic profit centers for enterprise management (i.e., not to be confused with statutory reporting or financial accounting) and performance measures and key performance indicators (KPIs), including both financial performance measures and nonfinancial metrics. Ideally, this would be done in a manner that is fully consistent with the tenets of fundamental intrinsic value, especially now that oil and gas company market valuations are placing greater importance on elements of fundamental value, including multiyear income, cash flow, and operational measures (including reserves).6,7
This typically requires the resolution of many potential internal performance measurement issues, such as how to best treat oil and gas prices and price hedges, transfer prices, allocations, costing, taxes, and royalties, to ensure that internal performance measures and metrics encourage value‐creating behaviors within the enterprise.
There are no “right answers” in resolving performance measurement issues, and the GAAP answer is often not the one that we desire; however, a full treatment of this topic goes well beyond the scope of this book.8,9
Economic Profit Centers
Lower‐cost upstream operating models will require operators to adopt more asset‐centric organizational architecture with “P&L” accountability delegated to local “front‐line” operating managers—a deceptively simple but important change. Successful operators give production facility and asset team managers more economic accountability to align their capital employed and cash consumption with the needs and opportunities of their businesses. This approach helps to build an organization more explicitly around its assets and geographic areas, with local decision making and accountability placed clearly with the asset team, and their emphasis tailored to the needs and expectations for those assets.
Performance measure definition requires that the drivers of revenue, period and unit costs, and their associated physical assets and future capital spend be identified and aligned. For example, an asset team would be organized to have both control and accountability for its key revenue drivers (e.g., production), period and unit costs (e.g., operating expenses), and tangible assets plus future capital expenditures. Thus, we generally require three types of data—elements that drive revenues, expenses, and capital (the cost of capital is more an economic determination than an input). At the consolidated enterprise level, measurement is simpler with fewer issues of data availability and clarity (similarly, intrinsic value can also be determined and benchmarked wherever an outlook can be estimated). But at more granular levels (i.e., resource type, basin, field, well), important measurement issues arise.
Commodity Prices, Hedges, and Transfer Pricing
Our industry has tended to focus on volumetric measures, like production growth and reserve replacement, because in their dollarized versions, oil and gas price volatility can mask everything else and hide important gains or problems.
However, one problem with a volumetric measure (e.g., production or reserves) focus, rather than dollarized values, is that managers are effectively overlooking the economics of their circumstances and the need to adjust accordingly.
A second complication, for performance measurement and management, is commodity price hedging. Although spot prices for oil and gas tend to be quite volatile, spot prices often have no or very little relevance—production volumes may be sold forward through long‐term sales agreements, providing a physical hedge, and/or may be hedged through an array of exchange‐traded or private over‐the‐counter financial hedges. Therefore, depending on who is accountable for these hedging decisions, it can be quite complicated to “dollarize” production and reserve volumes with an appropriate price. In some cases, operators will employ a forward price curve to “lock in” price assumptions so that volumes may be dollarized in the business units (i.e., for asset‐team performance measurement) but then use actual or prevailing market prices for performance measurement at the enterprise level. In these cases, hedging decisions and execution are centralized within a corporate functional center of excellence, such as corporate treasury. Inappropriate transfer pricing can mask true performance, especially at granular levels within the enterprise. Cross‐subsidies, inadequately addressed via transfer prices, can create incorrect signals—suboptimization (i.e., decisions that maximize the value of some parts, functions, or processes, but not total enterprise value) can occur because of an incomplete view. Businesses need to see their true economics to make appropriate decisions for resource allocation and outsourcing.
Allocations
Allocations encompass a variety of line items, including external purchases, overhead allocations, and sharing of joint and common costs. These allocations are often overhead costs—that is, period costs that will be incurred in any event or may notionally represent an allocation of sunk fixed costs like capacity.
Variablizing period costs, or sunk costs, is particularly problematic, and this is especially true when done without reference to their underlying cost drivers. A misallocation of indirect costs and assets creates misleading signals in performance measures.
A fully loaded labor cost that includes the cost of health care and post‐employment benefits allocates these costs on their primary controllable driver—headcount—and leads to better economic decision making by asset teams in their consumption of staff. However, there is no clear controllable cost driver to allocate the chief executive officer's compensation, nor is it likely to improve decision making.
Economic costs are not limited to charges from the profit and loss statement but can include the carrying cost (opportunity cost) of capital employed—a true economic profit measure would include some cost for capital employed. However, there are complicating issues to resolve with how to measure the actual capital employed in an asset team.
Costing
Improper costing, such as the unitization of fixed (period) costs and capital (e.g., the cost of capacity), often creates misleading signals of performance. Indirect overhead costs and the cost of excess capacity are often treated as a unit cost and capitalized to inventory, rather than expensed as period costs. Capitalization of costs—where there is no cost of capital—makes these costs “free” and creates a short‐term incentive to overproduce rather than build to order.
Longer term, the unitization of fixed period costs can lead to a classic “death spiral” with boe unit costs appearing to rise as production volumes decline, leading to an appearance of being not cost‐competitive. For example, while some stripper wells are clearly uneconomic (and even more so under proposed changes to broaden the regulation for methane capture in the EPA's Oil and Gas Extraction Effluent Guidelines and Standards), others may only appear uneconomic because they are shouldering a disproportionate burden of allocated overhead period costs from a traditional standard cost framework.
Now, practitioners of lean manufacturing, lean production systems, or the theory of constraints generally advocate some form of throughput accounting—a modern, full‐cost accounting that can include a charge for the cost of capacity (e.g., opportunity cost of capital employed), but with an assumed capacity utilization of 100 percent.10–12 Instead of unitizing fixed costs (i.e., including the cost of capital) over actual or budgeted volumes, throughput accounting unitizes them on the basis of the full capacity (admittedly, there will need to be some discussion about what constitutes boe/day “capacity,” but this is a healthy discussion). When utilization is less than 100 percent, a portion of overhead remains an unallocated, period cost. Volume variance does not impose a burden on well/product profitability. Using throughput accounting, profitability is independent of utilization and portfolio and capacity decisions can be made more correctly and independently.
Joint and Common Costs
Joint products are products that are produced in tandem, sharing overhead costs or capacity (e.g., crude oil, natural gas, and natural gas liquids). Misallocation of joint production costs can misstate profitability and mislead decision making.
For example, with the same production cost applied to all streams of production, some might appear to be sold at a loss. To understand a well's economics, we must make an allocation of the joint and common costs according to each production stream's ability to cover these production costs—crude would be allocated XX percent of a well's joint production costs if it represented XX percent of the well's total contribution. And crude's overall profit is then the difference between revenue and costs after split‐off plus allocated costs of the joint production process.
Costs for Capacity Decisions
A cost of capacity framework is needed for short‐term versus long‐term boe/day capacity decisions. This framework breaks costs into two groups. The first group includes only the direct operating costs. It includes the direct variable costs of production and marketing plus a charge for any net working capital. The second group consists of longer‐term capacity costs, often step costs that are quite independent of volume.
Economic profit contribution margin reveals whether business is value accretive in the short term, covering variable costs, including variable capital costs, for shorter‐term operations decisions. In the short run, where the costs of capacity and overhead are “sunk” period costs, it is advantageous to operate all assets that produce positive contribution. Full‐cost economic profit shows whether business is value accretive in the long term, covering all costs (including fixed costs and capital), for longer‐term decisions about capacity. In the long run, all costs should be covered and capacity resized to the volumes that can cover all costs.
There are many real‐world complications. As discussed previously, it even may be economic to incur contribution losses if they are less than the time value of deferring the abandonment costs. Technological constraints and the “lumpy” nature of capacity costs can often dictate a minimum capacity. Other complications include network assets, such as pipeline platforms and subsea equipment, where capital may be leveraged or repurposed to support other streams of production.
Book Losses and Other GAAP Treatments
The arcane world of GAAP accounting has long been an important source of perversion in E&P business decisions—resource development plans, owner/operator decisions, financing, M&A and joint ventures, and the use of services companies.
Upstream M&A deal volume and market liquidity for transactions is being impaired by the needless friction of a bookkeeping entry. Confusion between accounting and economics often stops people from making value accretive portfolio decisions. E&P balance sheets contain many potential sources of cash, some of which cost money just to continue to hold (e.g., property taxes), that could be monetized. However, standing in the way are book losses (i.e., noncash) on disposition. For example, idle assets or loss‐making businesses that could otherwise be disposed of, in return for cash, are often retained in order to avoid booking a loss on their sale—a noncash accounting entry of no economic consequence beyond the possible signaling value of an overdue correction. Examples include: partnerships interests, noncore or underperforming portfolio assets, midstream assets, discontinued operations, underutilized facilities and property, idle or obsolete equipment and spare parts, rail cars and other transport equipment, corporate cross‐holdings, marketable securities, long‐term investments, and so on. It's time to declare amnesty on book losses, temper concerns about forgone opportunity, and collect the cash.
The GAAP distinction between capital and operating costs in resource development is quite involved and this tends to risk having considerable effort being directed toward engineering preferred GAAP treatments and GAAP optics. For example, source‐water pipe is generally a capital outlay, but can effectively be converted to an operating expense if managed by a service company. If ever there was a time to favor economics over GAAP optics, it is now—rethink your operational choices to minimize the cost of the entire supply chain cost structures and then make the effort to educate your lenders and investors on your optimal economic choices, regardless of any suboptimal GAAP optics.
Tax Treatments
Performance measurement is complicated and sometimes corrupted by our assumptions for taxes, royalties, and fiscal regimes. Taxes are a real and significant economic cost of doing business, often a cash cost, and frequently a unit cost of production, where the primary cost driver rests with the asset team. Taxes have long been an important force in upstream business decisions—at times driving otherwise suboptimal choices—for portfolio, M&A and joint venture, exploration, resource development, major capital project, and services supply chain decisions. For example, greater use of component standardization and modular pre‐build in the design and construction of offshore platforms can reduce costs but may risk forfeiting the amount of content that may be categorized as intangible drilling costs (IDCs), which can be expensed for tax purposes. Once made, choices tend to get ingrained and rarely revisited; however, tax rates and fiscal regimes change in response to political winds, and the amount of income available for taxation changes with business conditions.
Key Performance Indicators (KPIs)
Given that what gets measured gets managed, managers and executives should exercise extreme caution. Income statement measures still dominate our language in business but often drive overproduction, overinvestment, and uneconomic vertical integration because they overlook the balance sheet and its cost. We increasingly see different resource types and business models consuming varying levels of capital at varying costs.
Publicly traded E&P companies have generally focused more on earnings metrics, their nondollarized equivalents like production growth, sometimes at the expense of NPV. Production growth and income‐based measures tend to encourage overinvestment and vertical integration because they overlook capital and its cost, which leads to overcapacity and undermines margins. They also tend to be relatively willing to syndicate costs with partners in return for equity, or to “buy down” lease operating expense (LOE) costs with higher D&C costs that can be capitalized. And they may go to great lengths to avoid noncash charges, such as book losses on disposition. There is now, of course, greater focus on cash generation for debt reduction. Financially distressed E&P companies are very focused on maximizing near‐term cash generation (i.e., at the expense of future activity) to meet loan covenant metrics and timing requirements. Privately owned/private‐capital‐backed E&P companies are more likely to focus on NPV maximization, but within the constraints of available “dry powder” (i.e., Cash + Marketable securities + After‐tax proceeds of dispositions + Debt capacity within target credit rating + 12 months of pro forma cash flow) and management bandwidth. This can lead to a strong emphasis on operational excellence and a bevy of operating KPIs around availability and uptime, cycle time, planned and unplanned outages, well productivity, and unit costs. State‐led E&P companies have shown more concern with longer‐term issues like reserve replacement and renewables, as well as social obligations and more qualitative elements in their public charter or mission. The visibility and importance placed on KPI metrics for health, safety, and environmental seem to vary proportionally with the size of the enterprises (perhaps because greater size and visibility tends to garner greater negative consequences to any negative outcomes of this nature), as does general concern for social license to operate.
KPIs as Percentages
Many managers have a strong affinity for the intuitive appeal of percentage‐based KPIs, but “batting averages” and “shooting percentages” do not win games. A focus on percentages can “starve the stars” and “feed the dogs” because low percentages improve with any percentage‐expanding growth (i.e., even if below the cost of capital), and high percentages look worse with any percentage‐diluting growth (i.e., even if above the cost of capital).
My former partner, G. Bennett Stewart III, illustrated a problem with percentage‐based KPIs through the tale of a fictitious NBA coach implementing a new pay system, based on shooting percentages, for his players. In their first game with this new system, each player went in for one lay‐up and then headed to the bench or the sidelines and called out, “Don't give me the ball—I'm at 100 percent.” The team lost by a score of 100 to 16 and the coach was fired.
Cost KPIs
Standard cost typically ignores or understates the cost of capital and converts period costs into unit costs, creating a false “absorption” benefit.
Economic Profit KPIs
Economic profit (i.e., Economic profit = Net operating profit after tax – Capital employed × Cost of capital) attempts to capture contributions to intrinsic value in a given period as a measure of profit after the cost of capital employed—it simultaneously captures revenue, cost, and the cost of capital in one measure to simplify operating decisions that involve trade‐offs between the income statement and balance sheet. It charges the full cost of a balance sheet to the income statement.13 One can express intrinsic value as the NPV of all future cash flow, but this can also be expressed as the mathematically equivalent sum of capital plus the present value of all future economic profit.
ORGANIZATION STRUCTURE, CAPABILITIES, AND WORKFLOWS
Organizational design garners more focus and attention than any other element of the operating model, and so care must be taken to avoid letting it become the sole focus. It defines the spans and layers of an enterprise, reporting lines, capabilities and functional roles, and workflows.
The design process begins by defining a purpose or charter for the company and then for each of its key components; the process moves from the top‐down, one level at a time, and works in tandem with both management process mapping (i.e., same level) and the allocation of decision rights (e.g., board structure, number and responsibilities of board members, number of temporary board members during migration period, key management posts, etc.). Functional statements are used to clarify the roles in each area, with clear decision making rules and operating policies (e.g., voting procedures, conflict resolution, etc.). It is a difficult but critically important struggle to resist the temptation to design the organization around specific people, rather than first to envision a future state that is based on its requisite capabilities and roles. Grouping the capabilities and roles to achieve an organizational structure with natural boundaries will encourage collaboration where it is most needed and minimize the need for management processes (and oversight) to be designed in order to overcome organizational silos. Specific names and people issues, plus transitions and timing (“How do we get there from here?”), may be resolved afterward.
Tremendous growth in upstream supply chain services and its increasing role in finding, development, and production has profound implications for organizational design—demanding adaptations in both the functional areas and in operations. Similarly, unique industry adaptations of business models, such as farming‐out, joint ventures, and other nonoperated vehicles, are increasingly prevalent and dictate adaptations in organizational design.
Business Unit (BU) versus Headquarters (HQ)
Organizational structures must migrate toward greater adoption of asset‐centric (e.g., geography, resource type, basin, or play) cross‐functional teams, with better integration of engineering and geosciences. Production teams will no longer be buried deep within project departments and commercial teams are less likely to be small, overlooked, or orphaned. The stature and importance of these capabilities can be elevated in the shift toward commercial business units and delineated to enable more visibility and accountability. Flatter organizational structures—especially in the line‐facing areas or front‐line operations—will reduce costs and elevate the organizational stature of asset teams.
Many of the leading operators in US unconventionals are independents that have a strong basin position and are free to develop their acreage in the most productive and cost‐efficient manner. These positions are generally large enough to afford both economies of scale and opportunities for growth in a single basin—whether the Permian, SCOOP/STACK or Marcellus/Utica. They adapt to local conditions and move quickly to arrive at a locally optimized approach, and then standardize these workflows to focus on efficient delivery. Moreover, they are empowered to revise accordingly, as they learn more or as the context changes. Some companies may need to tap into global operation for scale, expertise, and best practices in supply chain, operations management, or commercial marketing and logistics, but significant variation in geology between basins means that operators also may need relationships with services companies that have a formidable local presence in order to tap capabilities or achieve relevant scale in some workflows (see Figure 3.2).16
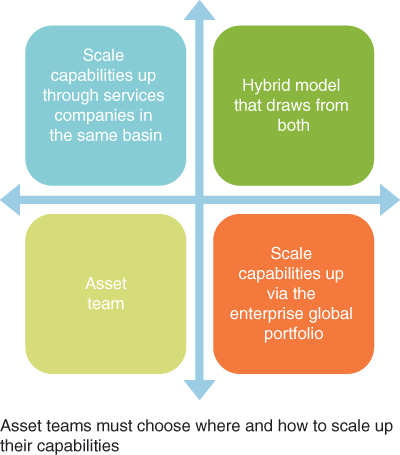
Figure 3.2 How to Achieve Relevant Scale in Capabilities
Source: IHS Energy
More functional expertise must be housed locally within the asset teams to enable greater focus on unique applications and circumstances through the best means (e.g., well and stage spacing optimization through microseismic monitoring versus frac height measurement). And with vendors increasingly serving as the arms and legs for an enterprise, the remaining organization must be both leaned out and made much flatter, with fewer layers and greater spans—efforts must be made to eliminate duplicate or overlapping capabilities, extra layers in the organization, and overhead that is no longer affordable. This is especially true in the case of technical talent where companies have tended to hire first and worry about organization later. In many cases, these extra layers were created to fit outdated thinking about reporting lines, grade levels, and compensation—thinking that has not kept up with the modern age of knowledge workers, knowledge‐based workflows, or the demands of our new economic reality. For example, in traditional job evaluation, measures of accountability like a P&L and numbers of direct reports reward too many P&Ls and too many layers, while failing to recognize that today's fluid work flows increasingly rely on collaboratively staffed project teams rather than departments or permanent organizational teams.
Workflows
Each of the proposed organizational design adaptations has its own corollary for enterprise workflows. For example, the move toward housing more operational authority and functional capability within local asset teams requires that line managers be responsible for development and operations workflows rather than highly prescriptive corporate policies and procedures, including local collaboration with upstream supply chain services vendors. This empowers asset teams to act in the most appropriate manner for the subsurface characteristics and commercial conditions of their basin, field, or sub‐play, and reduces the number of “touches” needed for decisions, approvals and actions. Furthermore, it is increasingly necessary for enterprise workflows to distinguish between classic megaproject management and lean production management, where we need more emphasis on continuous processes and the efficient use of capital—in unconventionals, oil sands, and operations of mature deep‐water fields. These workflows require simplification. Complex and approval‐laden, time‐consuming processes may work for megaprojects (and $100 oil) but need fewer steps with fewer touches.
New improved workflows must create better communications within asset teams through regular discussions between the geophysicist, geologist, reservoir engineer, drilling operations staff, and land staff. Surprisingly, there are indications that this is not happening.17 For example, in unconventionals, large‐scale drilling and completions (D&C) must be executed efficiently, adjusting quickly with real‐time information to optimize well performance and manage unforeseen complications. This requires integration across land, subsurface, construction, drilling, completions, and production. Big data is all the rage, but the utility of technical data and analysis is dependent on integrating that data into the asset team to enable better use of both production and geophysical‐derived data—especially where the data are easily confused because of similar or identical terminology that is borrowed from other disciplines.
Workflows must also be improved with an approach to technology that enables easy sharing of output within the asset team to encourage constant engagement rather than the old linear approach to tasks. Again, while these benefits are clear, this approach is not widely adopted.18 Asset teams that are highly integrated will be more likely to: (1) use geophysical data across the life cycle of the asset to enhance on‐going subsurface characterization, (2) integrate geology, production and engineering data while planning completions (e.g., seismically derived pore pressure prediction), and (3) allow for real‐time well steering as well as continuously updated drill‐plans for development optimization. The key point is not an emphasis on reservoir engineering or geophysics, but rather the integration of capabilities over an asset's life cycle.
Geotechnical Workflows and Big Data Analytics
Geotechnical workflows that employ emerging techniques to reduce costs and increase recovery, such as automated fault extraction, will respond favorably to their development in more locally focused applications (i.e., resource type, field, basin, or sub‐play). Asset teams have a large and growing amount of internal data—seismic and well data that are getting more detailed, more accurate, and more timely. And most operators also can gather large amounts of third‐party seismic and offset well information—this type of analysis could include all operators in a given play, accounting for important differences like vintage to achieve full business potential. The key is to use all of this information to improve development plans and well design.
For example, in most plays it is critical to improve the detection, understanding, and prediction of fault and fracture networks but it is difficult to visualize the exact location and geometry of fractures. Improvements to the visualization of fault networks, through higher resolution, enables workflows to more reliably delineate faults and predict fluid pathways and frac height growth, as well as to integrate these results with other seismic and well data to estimate fault network volumes. Automated fault extraction can replace labor‐intensive manual fault mapping or be used as a starting point for manual interpretation and model generation. Subvisual faults may be incorrectly included in the subseismic and “unmappable” category by some geoscientists, but can be extracted from seismic data with newer technology, experience, and combinations with other data. Automated fault extraction reduces the cut‐off for fault recognition, both in terms of fault throw and also fault length, and can provide information on faults at subvisual levels. Not all attributes produce reliable and meaningful results and so it is necessary to screen a variety of different algorithms and to compare with other reference data.19 Locally based workflows ensure that seismically derived fault networks are calibrated and tested with indications from other sources of the most relevant data, including microseismic monitoring, well, drilling, or production data. This approach can help to narrow or close the scale gap between seismically identified faults and faults identified from well data (e.g., image logs, cores, correlation, well tests, productivity, fluid losses). When combined with fracture flow properties and geomechanical data, well‐constrained and spatially exact flow simulations can be derived to better understand well productivity and the optimization of future well production.20
Standardization versus Optimization
There are many benefits to standardization, and generally speaking, the oil and gas industry needs to employ much more standardization of processes, procurement, and specifications in order to reduce costs. However, geoscience workflows that employ emerging techniques to reduce costs, increase well productivity, and improve recovery often respond favorably to development with more asset‐focused application. Furthermore, there can be situations, such as with drilling and completions in unconventionals, where efficient execution involves adjusting to real‐time information in order to optimize well performance or to manage unforeseen complications.
Notwithstanding the popularity of references to lean manufacturing and factory‐style production, D&C priorities must find a balance between the efficiency gains of standardization versus the productivity gains of well optimization. Unconventionals' subsurface risk manifests in tremendous regional variation in well productivity—not simply in terms of the full aerial extent of core acreage, but in many of the key elements of a geomechanical model, including geology, stress states, pre‐existing fault and fracture networks, and pore pressure. Furthermore, technology (e.g., equipment or IT) will not realize its maximum potential unless deployment is supported by the necessary resources and talent to propel the organization to a competitive basin position. Therefore, we must guard against taking centrally prescribed standardization too far—D&C is an important set of workflows that can benefit from more locally prescribed optimization and “standardization,” including fracking techniques, proppant usage, use and design of multistage frac sleeves, composite plugs, and open‐hole isolation systems.
Talent
Most enterprises in the oil and gas industry will benefit from education and training to develop higher levels of commercial business acumen within asset teams, including engineers and geoscientists. The need for business acumen and commercial sense is higher now than ever before because of the new economic realities facing our industry. It is no longer sufficient simply to be highly technically proficient—engineers and geoscientists must put their analysis, interpretation, and suggestions in economic terms, because that is the language of business. Asset team members will need to develop an intuitive sense for the size and profile of their costs and cost drivers, trade‐offs and how to affect them.
Companies have adopted decision tree and value of information (VOI) analysis as a protocol within an industry that was previously guilty of pursuing “data for data's sake.” This sends a strong message that any investment requires a sound business case. For example, the cost of enhanced subsurface characterization capabilities should be justified through projected well outcomes with higher recovery and lower finding and development costs. Placing horizontal wells too close together increases the drilling budget. Positioning wellbores with suboptimal positions or orientations reduces P10, P50, and P90 outcomes, deliverability, and reserves. Subsurface characterization can also help to mitigate drill risk and heighten chances for success.21
Due to the cyclical nature of the industry, there have been many lean years when oil prices were low, top talent was not drawn to the sector, and there was very little hiring. This led to a large talent gap on the horizon for seasoned industry expertise beyond 2020. The industry may face a talent gap when the cycle rebounds due to the attrition caused by the downturn and by others aging out of the workforce. Cuts to staffing levels by operators and service companies may have left the overall talent pool at unsustainable levels from a full‐cycle basis. Therefore, changes may require an infusion of new talent, more recruiting and training of local expertise, and longer rotations for incoming talent.
OPERATIONS MANAGEMENT PROCESSES
Quite apart from the many corporate enterprise back‐office processes (e.g., compliance, risk and statutory reporting processes, etc.), the primary formal operations management processes typically include:
- Budgeting and planning (e.g., strategic planning, capital appropriations, operating budgets)
- Performance scorecard reporting (e.g., flash reports, monthly scorecards, financial statements)
- Performance management (e.g., standing processes and timelines for operations reviews, business “workout” sessions, performance‐related management conversations, etc.)
- Management of total direct compensation, including incentives and commissions
- Talent management processes (e.g., recruiting, training and development, succession planning)
In many cases, changes in organizational design might just as easily be achieved through revisions to formal management processes and their associated delegation of authorities. However, ideally, changes are affected through both elements so that they are reinforcing each other rather than working at cross purposes.
As discussed previously, there will be many cases where business unit, asset team, or resource type adaptation is required. For example, KPIs and targets may vary to suit the operational emphasis and lengthy capital appropriation processes with many touches, and stage gates that have been designed for deep‐water programs may be less suited to unconventionals or the Canadian oil sands.
Capital planning and approval processes also need better cost estimation and risk assessment because cost overruns are often more of a reflection of overly optimistic estimates than true overruns. Stage gates, single‐point estimates, and generic uncertainty ranges often focus too heavily on technical definition, with inadequate evaluation and planning of other factors, like uncertainty in the supply chain and other above‐ground risks. This leads to an underestimate of the level of upside uncertainty in time frames and cost.
Asset managers need performance measurement and management systems to be effectively enabled, empowered, and held accountable for delivery. Frequent reporting of transparent and definitive scorecards, coupled with education and training, analytical tools (see Figure 3.3), and frequent performance‐related dialogue is essential to reach full business potential.
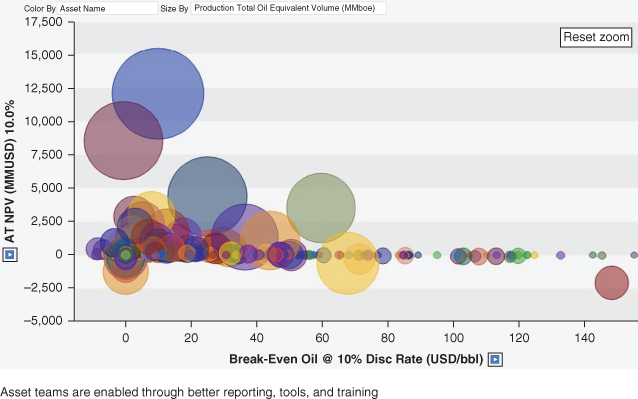
Figure 3.3 Upstream Portfolio Tool
Source: IHS Energy
DELEGATION OF DECISION RIGHTS
The delegation of authorities, or decision rights, identifies the people and their responsibilities and accountabilities within each step of each management process, by identifying a process owner plus the people who are accountable for each step or action, and anyone who must be consulted or informed along the way.
Roles and responsibilities are typically built around some variant of the now ubiquitous framework, called “RACI” (i.e., Responsible, Accountable, Consulted, and Informed). These RACI charts or tables clarify the roles and responsibilities in each forma management process. Decision rights can be easily distinguished by combining the role and process step to identify who is responsible or accountable.
In many cases, parallels between organization structure and decision right allocations effectively provide two alternative solutions. Virtually any organization chart solution (e.g., reporting lines and areas of responsibility) can instead be achieved via the allocation of decision rights (RACI). But typically, the RACI attempts to simply reinforce the same groupings of capabilities and roles that are reflected in a good organizational design (e.g., individual responsibilities and coordination required in a process).
The RACI allocation must take into account both current and desired cultures. For example, a desire to encourage consensus building will bias toward significant consultation, whereas an emphasis on speed or agility might instead opt for more informing, and few shared responsibilities. It is best to have only one owner (R), and to minimize the number of doers (A). Using Is, versus Cs, increases the organization's ability to make decisions and get things done.
As in the case of the organization structure, the allocation of decision rights must also accommodate unique industry adaptations such as oil field services outsourcing and nonoperated vehicles. New operating models will afford greater decision‐making authority to line managers and asset teams and reduce the number of approvals and amount of centrally prescribed functional support, to not only those that are necessary for compliance and risk (e.g., statutory reporting), but also those where expertise or relevant scale is best provided on an enterprisewide basis (e.g., treasury).
For example, asset teams would benefit from greater ease and authority to adapt more appropriate specifications for procured services, and or workflows for predictive and preventative maintenance, to be more suited to the specific needs, remaining life, and risk profile of their resource base and production facilities. They also need more authority to share costs, assets, or capabilities with service providers and operators in their area. This might include regional seismic or offset well data, source water storage treatment and pipeline/lay‐flat hose, maintenance and spare parts, transportation and lodging, or even R&D.
INFORMAL SOCIAL NORMS AND CORPORATE CULTURE
Informal social norms and corporate culture encompass both how we comport ourselves and the “tone from the top.” Social norms and corporate culture tend to be more influenced than explicitly designed but how leadership model behaviors does have considerable impact. Corporate culture also has been linked to the design of executive compensation—effectively a second‐order outcome or unintended consequence—and there are many difficulties associated with this area.22 There are several controllable factors that govern an outcome in terms of corporate culture, and these include the following:
- Design of incentives, including executive compensation, salesforce compensation, performance‐based bonuses and rewards, and the formal and informal norms about taking credit
- What constitutes a win in our enterprise, and how we respond both to wins and to losses
- How leaders, managers, and staff communicate (e.g., tone, time, frequency, 1:1 or 1:many or many:many, etc.) and through what channels (e.g., face‐to‐face, phone, email, text, web‐based)
- Social norms around teaming and decision making
- Proclivities toward risk taking and our attitudes about mistakes
There are many industry experts who would suggest that corporate cultures also must change, starting with the people in leadership roles.23 We need more entrepreneurial and commercially oriented cultures with a greater penchant for experimentation and continuous improvement, to increase exploration success, reduce investments in front‐end design and engineering, improve resource recovery rates, increase well productivity, and reduce operating costs.
Successful leaders provide a vision with compelling purpose and excitement about the underlying business, sweat the details of operations, and will work hard to change cultures, from that of a traditional, hierarchal command‐and‐control upstream business to one suited to the knowledge‐worker economy and more focused on economic profitability and commercial success. These may not be the typical or OIMs in the workforce today, and so many companies are looking outside of the industry to find the right capabilities and mindset.
Corporate Culture of “Wall Street” Preoccupation
As with the effects of tax and accounting treatments, preoccupation with Wall Street is a source of perversion in corporate culture and business decisions at many public companies. Research on dimensions of corporate culture and firm performance has found more issues associated with publicly traded firms.25 It is best to not forecast earnings (i.e., no guidance) and focus on long‐term performance, not Wall Street analysts. JPMorgan's chief executive officer (CEO) advises, “Don't make earnings forecasts. You don't know what's going to happen every quarter. I don't even care about quarterly earnings.”26 The tone he sets from the top is not about how earnings compare with analysts' estimates but whether the bank is serving its clients and winning business in the marketplace. He goes on to say that CEOs “start making promises they shouldn't make.” And while many JPMorgan shareholders “completely appreciate” long‐term management, others in the stock market are likely to overreact to short‐term results. Legendary investor and CEO of Berkshire Hathaway, Warren Buffett, offers the same advice against issuing financial predictions, saying that his annual letter to shareholders tells investors what they need to know.
Moreover, the investor relations pitch cannot become the business strategy. CEOs must reclaim the conversation about strategy and execution and “just say no” to Wall Street.27 Managers up and down the hierarchy work hard on strategies, plans, and their execution, but when the figures are tabulated, they often fall short of Wall Street expectations. All too often, executives react by “encouraging” middle and lower level managers to redo plans, budgets, and forecasts. Ultimately, constructive dialogue about strategy and execution is effectively supplanted by an investor relations pitch laced with Wall Street‐speak, characterized by GAAP accounting and endless metrics, promising outcomes unrelated to a plan of specific actions. Lost is any constructive debate about industry direction and needs, requisite organizational capabilities, resource and talent development, or vision for the company's “right‐to‐win.” Discussion of actionable inputs is replaced by discussion of outcomes. CEOs must reclaim the conversation about strategy and execution.
The Imperial Chief Executive Officer
A solely financial focus can make executives appear unapproachable and more consumed with Wall Street than with the development and performance of their employees. Along with this is the tendency for CEOs to adopt an “imperial” leadership style. They make decisions and develop strategies that are above challenge with little input or discussion and their companies become vehicles for celebrity lifestyles, traveling the globe to public forums and making speeches to investors and analysts. They embrace an air of being in touch 24/7, supported by technology, but in reality are dangerously out of touch with their business and the people they lead. They often do not hear bad news until it is too late.28 But leaders need to be approachable especially when it comes to mistakes and bad news—the gap between leaders and led should never be large. The execution of strategies and business plans in knowledge‐worker organizations is most successful where front‐line people play a role in their development.
Management by Email
Communication is the foundation of a strong relationship, and ongoing, open, and effective communications are fundamental for creating employee relationships that are based on respect. Employees who feel respected are more productive, more loyal and engaged, and have longer tenure.
However, the oil and gas industry is one where communications can be very difficult—we face many barriers, including multiple languages, geographic separation across many time zones, and different conventions for holidays and the working days a week. Moreover, most managers are not sufficiently trained in effective communications and this has been made much worse with technology, especially email. Email can be an efficient tool when used properly, but it is certainly no substitute for face‐to‐face communications or for the ongoing daily management of employees, and it is an inappropriate medium for many messages.
Unfortunately, business leaders and managers increasingly turn to email as their primary management tool—giving assignments, providing feedback, communicating sensitive, complex, or nuanced information, and for two‐way communications that require a conversation. The man‐hours wasted on email chains are a costly epidemic for some companies in the industry that also saps employee morale and productivity.
Table 3.2 Implications of Industry Evolution
Implications for the strategic agenda and operating model
Source: IHS Energy
| Industry Change | Implications for Strategic Agenda | Implications for Operating Model |
| Global resource base | Stronger case for farm‐outs, JVs, acquisitions/ divestitures, to achieve the relevant scale and/or requisite capabilities in each basin/resource type. | Stronger case to organize by asset teams as primary axis for key capabilities; bolster corporate portfolio management capabilities and review processes. |
| Unconventionals ripple effect | Corporate portfolios may need some allocation for short‐cycle supply/storage; opportunities in lower permeability reservoirs; opportunities in US petrochemicals, ethane‐based conversion, and power‐intensive industries. | May require separate organization or operating model for unconventionals investment/operation; greater need for low‐cost operating models. |
| Discovery challenges | E&P companies might address strategic choices between frontier exploration, JVs, M&A and field growth. Some might opt to focus on existing basins and fields over traditional to reduce costs and mitigate declining exploration success rates. Others might opt to focus on unconventionals, with a very different subsurface risk and cost profile. | Bolster the supporting organizational capabilities and processes for whichever strategic choice (e.g., exploration or reservoir engineering or A&D or corporate development, etc.). Regardless, subsurface characterization capabilities are more important than ever, and frontier exploration budgets are high‐graded. |
| Fading production | Greater capability in enhanced recovery (for both conventionals and unconventionals); also managed through refracturing, reservoir contact, in‐fill drilling, etc. | Bolster the supporting subsurface characterization, reservoir engineering, and production engineering capabilities and processes, either within the asset team, or from HQ, or from service companies within the basin. |
| Costs & capital efficiency | Require investment in structural change to reduce costs/improve productivity—sustainable and scalable. | Changes in operating and business models to leverage advantaged capabilities, share costs or assets in the value chain, streamline processes. |
| Technology & expertise | May need to narrow the operated portfolio to narrow the set of critical capabilities; greater capabilities are required to enhance primary and tertiary recovery in shale gas and tight oil. Artificial lift for horizontal wells is an evolving science, and recovery is also managed through reservoir contact, in‐fill drilling, trade‐offs between lateral length frac design and downspacing, and exploring prospects for refracturing. | Adaptations to operating and business models to develop advantaged, low‐cost capabilities in key areas for the portfolio. |
| Supply chain & services | Leverage external capabilities where advantaged; share assets and activities to gain scale and improve utilization. | Streamline cost structure by eliminating duplications and overlaps; refine HQ versus BU choices. |
| Fiscal & regulatory | Complex and specialized area demands specialized expertise to navigate strategic choices and to influence the landscape. | Bolster fiscal/regulatory capabilities and processes. |
| Social license and environmental costs | Nuanced and high‐profile industry issues demand specialized expertise to influence the external landscape and to help navigate strategic choices. | E&P companies need an operating model that involves a much greater investment in strategic communications to support and promote social license to operate than ever before. |
| Low oil and gas prices | Need investment and change that goes beyond vendor concessions, project deferrals, and overhead cuts, to reduce inherent, structural and systemic costs in system. | Cut costs while growing stronger; reduce numbers of organizational layers/increase reporting spans, delegate more decision rights, especially line‐facing (i.e., asset teams). |
IMPLICATIONS OF INDUSTRY EVOLUTION
The implications of industry evolution are significant both in terms of the new strategic agenda and requisite capabilities “to win” for an upstream enterprise, as well as the needs of the enterprise in terms of the operating model. Table 3.2 recaps the evolutionary change outlined in Chapter 1 with examples of their implications for the strategic agenda and the enterprise operating model.
BUSINESS MODEL CONSIDERATIONS
Beyond the scope of operating model per se are the many related business‐model considerations that arise when updating the enterprise operating model, especially when there is pressure to rethink the cost structure. Several E&P industry examples of business model considerations are outlined in this section.
What Others May Operate More Efficiently/Productively
In most E&P companies, there are upstream portfolio assets where the size, the geography, or the resource type is such that the owner lacks the local scale and/or the relevant expertise for competitive advantage. Because they are likely worth more in the hands of someone else, these can be the best candidates for farming down or an outright sale/divestiture. But the key is to identify to whom they are worth most (e.g., highest recovery/lowest cost producers)—the natural owners to own and/or operate each of these assets. To successfully close a deal in a timely manner, given relative bargaining power, one may need to be flexible about how to monetize each position (e.g., farm‐down, NOV, sale, etc.).
Partnering Where Capabilities Are Advantaged
The relative strengths and weaknesses of key capabilities vary widely among upstream operators and by basin/play, due to local expertise, advantaged assets, and other factors. Partnering where other operators are uniquely advantaged (see Figure 3.4) can create significant gains to be shared, under an appropriately structured agreement. Joint ventures and other forms of collaboration are common in part because they monetize these differences in relative strength of key capabilities.
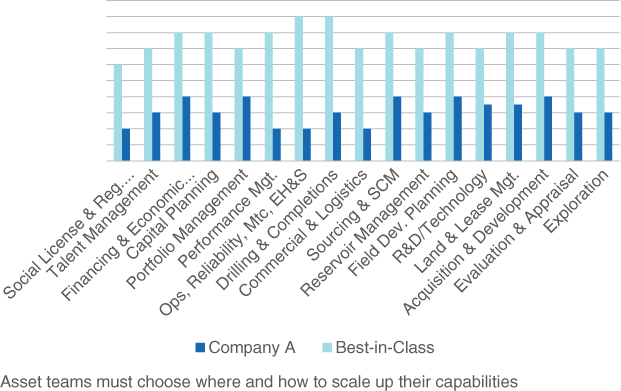
Figure 3.4 Partnering Where Capabilities or Scale Are Advantaged
Source: IHS Energy
There are many cases of operational assets that may be shared among operators to reduce investment and improve utilization or activities to share to achieve economies of scale. For example, the unitization of acreage allows for longer laterals and improves leasehold development efficiency. Similarly, spare parts may be shared for offshore platforms, rotating equipment, umbilicals, and subsea manifolds, and “Christmas trees.” Activities might also be shared to leverage key capabilities or achieve economies of scale, such as seismic acquisition/seismic libraries, or well services activities that have not yet migrated to vendors.
Using Vendor or Customer Capabilities to Reduce Costs
Upstream success demands a large and growing set of key capabilities across diverse geographies and resource types. Some have increasingly migrated to third‐party vendors for more specialized expertise, economies of scale, or utilization. There may be more. For example, the use of source‐water pipelines/lay‐flat hose can offer tremendous cost savings by eliminating trucking, but requires an initial outlay of capital. The substitution of brackish source water, or recycled flowback and produced water, can lower costs but becomes sufficiently specialized that vendors have sprung up in both the Midland and Delaware basins.