
CHAPTER 7
Financial Implications
Not only has the energy sector experienced tremendous evolution—our understanding of the underlying global resource base, the nature of ownership and principal stakeholders, technologies and methods for resource development, and its economics and business models—but so, too, has the financial sector. The big banks and capital markets played an essential role in the US oil and gas industry, which if a separate country would rank in GDP terms, sixteenth in the world, just ahead of Saudi Arabia.1,2 But the traditional roles of regulated banks and capital markets have been greatly reduced in an era of post‐financial crises politics, and this is especially true for the oil and gas industry.
Not surprisingly, there was a barrage of legislative and regulatory reform, including: Basel III capital adequacy and liquidity requirements, complex and far‐reaching Dodd‐Frank financial reform, unintended consequences of the Volcker Rule, new requirements by Office of Comptroller of the Currency for oil and gas exploration and production lending, and broader interpretations of the scope of noteholder protections in Section 316 of the Trust Indenture Act. The net effect of these, and many more changes, has been a retreat by the banks, especially in reserve‐based lending, project finance, commodity trading and market making, commodity hedges, and related structured financings. Public debt markets also have been affected with reductions in primary and secondary market liquidity for sovereign debt.
Some new entrants have stepped in—intermediaries from the shadow banking world of nonbank financials, private trading firms, hedge funds and other asset managers, as well as principal investors, such as private capital, pensions, and infrastructure funds—these firms are less regulated, less transparent, and use different business models that provide different value propositions. And so not only have the upstream players and their needs changed, but so, too, have the available counterparties and services, for funding, financing, and hedging.
The industry faces many competing demands and economic headwinds—just as challenging economic conditions bring government spending and deficit measures to a head. This strain is not only in terms of capital resources but also in many cases in other resources, such as talent. The shortage of not only capital but also capabilities and talent makes the entire energy and infrastructure supply chain an interesting opportunity with significant growth markets and an attractive risk profile. Participation might be as lenders, vendors, investors, or business partners for those who can bring to the table the requisite capital, capabilities, or talent.
FINANCIAL STRATEGY AND POLICY
There are several degrees of freedom in a financial strategy for energy and infrastructure. A financial strategy and its blueprint—the financial policy—are interdependent with the needs of the business and its stakeholders, and require alignment with enterprise mission, capabilities, strategy, priorities, and constraints. The framework shown in Figure 7.1 provides a five‐step methodology to work through each of the major degrees of freedom.
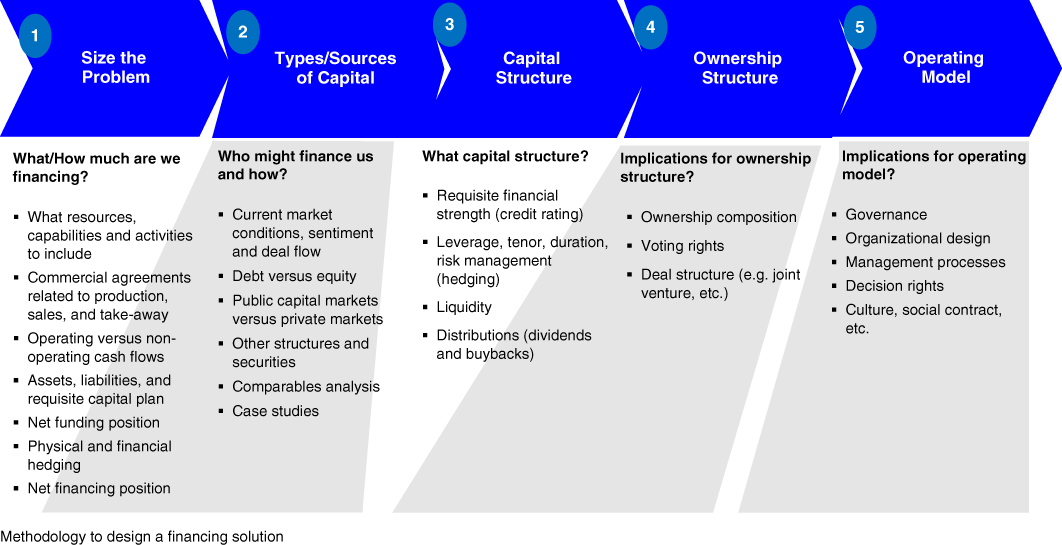
Figure 7.1 Financing Strategy Framework
Source: IHS Energy
1. Size the “Problem”
The first step is to develop a cash flow model that underpins the business case and sizes the “problem” (aka financial need). Economic evaluation is NPV‐based (discounted cash flow) and tested over a range of conditions that represent the relevant range for each of the key inputs and assumptions. Cash‐flow modeling should also distinguish between operations funding and capital financing to evaluate the overall size and profile of the financing need.
- Funding pays for operating costs and generally needs to be funded from operations. From an accounting perspective, funding is an income statement item, not a balance sheet item. Cash from operations, liquid assets, subsidies, and short‐term borrowings are the most common infrastructure funding sources.
- Financing pays for capital assets such as plant, property, and equipment and may involve raising the money through private or public capital markets. From an accounting perspective, financing is a balance sheet item, and may be categorized as either debt or equity.
2. Types and Sources of Capital
Private‐sector capital markets have been a source of capital for energy‐related resources and infrastructure for years, by many different organizations, and through many different markets and vehicles (see Figure 7.2).
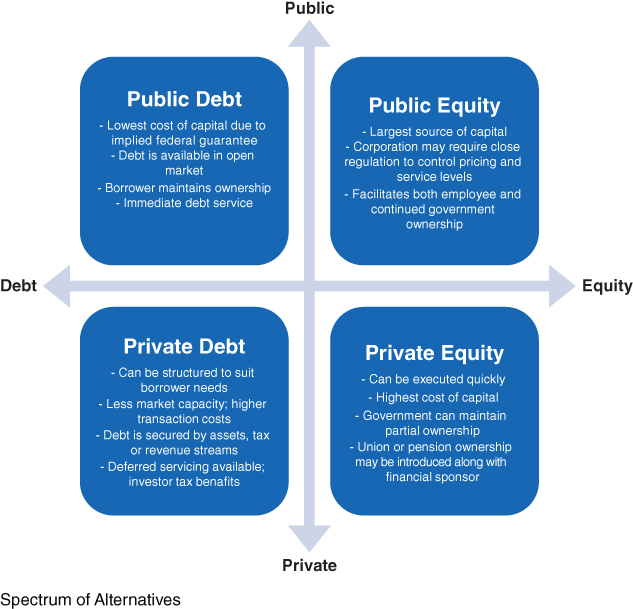
Figure 7.2 Private‐Sector Capital for Energy and Infrastructure
Source: IHS Energy
2a. Operations Funding
Operating costs are generally funded with cash from operations, fees, subsidies, or potentially, short‐term debt (e.g., seasonal debt), whereas financing is generally a permanent balance sheet item that pays for assets such as plant, property, and equipment—this may involve raising money through private or public capital markets, and may be in the form of either debt or equity. Notwithstanding the need for preserving control or influence, there may be elements of a project that can become an effective source of funding or financing for the broader project (e.g., through sale or outsourcing). Before traditional financing, there can be opportunities to raise capital, and reduce the need for capital, through asset sales, divestitures, and outsourcing agreements.
2b. Debt Financing
One of the first financing choices regards the nature of capital financing, in terms of debt or equity, or something in between. This choice is driven by the specific needs of the situation and the characteristics of the alternatives (see Figure 7.2). For example, debt instruments might include lines of credit, revolving facilities, leases or other asset‐backed facilities such as securitizations, term loans and notes, or bonds, each with their own respective costs and benefits. Each of these vehicles will have its own characteristics in terms of pricing, availability, and terms, and these characteristics tend to be both issuer‐specific and change with market conditions, and need to be weighed against issuer objectives and constraints.
For example, in August 2014, American Eagle Energy Corporation (AMEX:AMZG)—a Bakken “tight oil” developer—issued $175 million of five‐year high‐yield notes (aka, junk bonds) with an 11 percent coupon (11.25 percent yield), coupled in September with a $60 million asset‐backed revolving line of credit. This was to finance its development of 12,000 net acres in Eastern Montana and southeastern Saskatchewan (which is relatively far away from the Bakken's sweet spot) but went on to become the first high‐yield default when oil prices fell.
A second decision point is the source of financing—public versus private markets—typically based on availability, cost and terms, and covenant requirements. This decision may also be affected by other considerations, such as liquidity, regulatory requirements, transparency, governance, and control issues. The loss of control to investors through monitoring or restrictive covenants—characteristic of private capital—must be weighed against the burdens of public disclosure such as obtaining public credit ratings from the ratings agencies (i.e., Moody's, Standard & Poor's, Fitch).
2c. Equity Financing
Lower in the natural pecking order are equity instruments, which include common or preferred stock, options, or longer‐dated warrants, or equity stakes, again, each with their own respective costs and benefits. And while the benefits of debt have been well documented in the academic literature, much of this discussion pertains to the tax shield of debt. In practice, the use of debt has much more to do with a reluctance to dilute equity ownership and control. And the amount of debt tends to be driven by overriding business needs, with practitioners making their decisions on target credit ratings and the associated capacity for debt. Equity financing options can span the range of public and private market options.
For example, in May 2010, Penn West Energy Trust raised over $400 million through the sale of an equity stake to China Investment Corporation. The private placement involved approximately 5 percent of the company's issued and outstanding units and was to help finance oil field development in their portfolio of nearly 5 million acres in western Canada.
2d. Hybrid Structures
There can be a host of alternatives in between plain‐vanilla debt and equity, tailored to suit the circumstances. These are often to avoid diluting equity ownership and/or to enhance an otherwise stretched balance sheet. For example, surplus notes originated in the early 1990s as a credit‐friendly way to raise “equity” despite not being publicly traded; however, investor demand for structured solutions and hybrids tends to vary widely with market conditions. In general, these securities are better suited to larger, higher quality, and more seasoned names, with “on‐the‐run” (regular) tenors, and for times when the markets are less turbulent and wide open.
The sale of future oil production has been used as a financing for the oil and gas and other resource industries for many years.3 Volumetric production payment (VPP) involves the sale of a percentage of oil or gas production in exchange for an upfront cash payment. This credit extension has been important to the development and production of domestic resource plays. For example, Chesapeake, a leading US shale gas producer, raised several billion dollars with VPPs.
In VPP transactions, sellers (e.g., natural gas producers) agree to deliver a certain amount of production over a set period of time, ranging from 5 to 15 years. Sellers can use the upfront cash payment to fund their drilling program, make acquisitions, or perform other activities to benefit their shareholders. The seller is responsible for delivering gas up to the agreed‐upon amount and the operating cost to produce the gas.
Buyers (usually large banks) pay a fixed price for gas, as a lump‐sum payment in advance. The banks' source of repayment is the physical delivery of future gas production.
VPPs also can involve a price hedge. Although producers might want to lock in a price for their gas in concert with a drilling program (e.g., three‐plus years), most of the volume for exchange‐traded forward contracts is short in duration. Transaction data from Chicago Mercantile Exchange (CME/NYMEX), the largest commodity exchange along with Intercontinental Exchange (ICE), indicates roughly 80 percent of Henry Hub natural gas futures volumes are less than two years in length. The lack of liquidity for long‐dated exchange‐traded hedges means that private transactions, often with amendments for nonstandard reference pricing and other terms, are necessary. Many VPP transactions are at least 5 years in duration, and some are more than 10 years. In the case of large VPP transactions in Asia, which effectively serve as long‐term supply contracts, the contract duration is reported to be as long as 25 years.
3. Capital Structure
Optimal capital structure (financial leverage, cash and liquidity, and shareholder distributions) is not only about finding the correct settings, but also about aligning the elements and the owner's agenda. Capital structure for energy and infrastructure tends to be governed by issues of ownership control and dilution, which put virtually all forms of debt at the top of the pecking order for sources of capital (see Table 7.1). Project cash flows dictate the debt capacity for a given credit rating, which is a reasonable proxy for requisite financial strength. Equity generally fills the remaining needs.
Table 7.1 Illustration of Financing Alternatives for Oil and Gas Producers
Key characteristics of loans & bonds
Source: IHS Energy
| Loans | Bonds | |||||
| ECA | Project | Corporate | Project | Corporate | Sovereign | |
| Typical Maximum | $2 billion | $2 billion | $2 billion | $3 billion | $5 billion | $7 billion |
| Typical Maturity | 5–10 years | 5–10 years | 1–5 years | 10–20 yrs. | 3–20 years | 3–30 years |
| Availability During Build | Yes | Yes | Yes | Maybe | No | Yes |
| Requires Credit Rating | No | No | No | Yes | Yes (2) | Yes (2) |
| Other | Often cheapest | Tight covenants | Uses up bank lines | Need good sponsors | Ratings essential | Ratings essential |
Debt is perhaps the simplest form of financing, and it avoids diluting the ownership interest of equity holders. Debt service can be a tax‐efficient use of operating cash flows (for taxable entities), which reduces the weighted average cost of capital (WACC) by substituting lower cost debt for more expensive equity. Financial leverage can also reduce agency costs through increased fiscal discipline. However, the optimal proportion of debt in the composition of a corporation's capital structure has steadily declined since most executives went through business school.4
More highly leveraged companies tend to have lower credit ratings. An optimal capital structure provides sufficient financial flexibility to support a value maximizing strategic agenda while providing an efficient cost of capital. Many companies reserve‐based lending and credit ratings requirements, especially the important thresholds for investment grade (BBB−) and A1/P1 commercial paper access (long‐term A rating), have been tightened in response to the financial crisis and that markets are smaller and less accessible for lower quality credits. Debt/EBITDA is one of the more universal leverage ratios across most industrial sectors, but its limitations include not accounting for prospects or non‐producing reserves, the effects of industry cyclicality and commodity price volatility, and anomalous tax or depreciation. Production‐based metrics also overlook growth in working capital, quality of earnings, and liquidity. Liquidity became a very important issue in the recent financial crisis. Beyond establishing the overall proportion of debt within the capital structure, we must address optimal cash and liquidity, and an optimization of the construct of the debt portfolio—liability management.5
4. Ownership Structure
In simple cases, such as a commercial bank loan or even a bond issue, there may be no changes to equity and no implications for ownership structure. However, in many other cases, deals may have implications for ownership structure and the operating model. Ownership structure can be more of a constraint than an optimizing function in the financial blueprint of an infrastructure project. Once the amount of equity is determined as a function of project size and debt capacity, the key is to determine the optimal compositions of each of both the debt and the equity. On the equity side, there are many available variants in the ownership structure, including the partial public offering of a stake, minority interests and passive private placements, joint ventures, and variations in public–private partnerships.
Joint ventures can be used to provide operations funding, equity financing, or organizational capabilities. With energy projects growing in scale, complexity, and risk, they are increasingly difficult to go alone. There has been a surge in collaborative deals to gain access, build capabilities, and share both capital and risk. NOCs are another aspect of the energy industry that drives the prevalence of collaboration for knowledge transfer and capabilities building.
Public–private partnerships (PPPs), increasingly important phenomena in the upstream oil and gas sector, are a unique joint venture construct that involves a public institution (e.g., NOCs) alongside private enterprise, with equity contributed by both the private and public sectors. One important element in the case for PPP is the transfer of expertise from private partner to public entity. To be attractive and viable, the shareholding structure of the JV must secure the interest of both the public and private partner—namely, providing enough public capital and sufficient private sector expertise.
As discussed in the last chapter, the public sector tends to operate less efficiently, whereas the private sector must use more expensive capital. Private sector savings can be due to more efficient project management and shorter construction times, as well as lower administrative expenses. However, private sector capital can be several hundred basis points higher than the public sector.
An optimal capital structure is achieved with both public and private parties as shareholders—different knowledge transfer schemes determine the optimal shareholding mix. For example, the higher financing cost of the private sector may be offset by savings in outlays.6
5. Operating Model
The final design element is the operating model, to ensure adequate monitoring and management.
HEDGING AND TRADING
Commodities and currencies have become increasingly volatile; rising pressure for growth and profitability has led companies with large commodities exposures—both those that are naturally long and those with a natural short—to explore commodity hedging and trading, as well as risk‐shifting mechanisms for inbound and outbound material flows.
Many companies anchor hedging (and sometimes sourcing) processes around goals of reducing cash flow volatility and optimizing value (versus simply minimizing sourced or manufactured unit cost). Nevertheless, many have expressed an interest in a more systematic approach to risk management, and developing a combined sourcing‐hedging policy, to:
- Protect cash flows—locking in profit for natural long positions, protecting margins for natural short positions, and guarding against catastrophic risk.
- Secure liquidity to fund operations and capital investment.
- Protect competitive position in emerging markets to help secure a more established presence.
Comingling of Sourcing, Sales, Trading, and Hedging
The organizational capabilities required for best practice sourcing, hedging and trading, and financing are increasingly blurred. But for many energy and chemicals companies, functional silos get in the way. Best practice requires the capabilities and coordination of purchasing, treasury, sales, and operations departments.
For example, there are ways to shift or share this risk with suppliers through alternative forms of contracted price agreements. This involves the procurement or manufacturing organizations. Alternatively, there are ways to manage this risk through physical or financial hedging—this involves the procurement and often treasury organizations. There are also ways to shift or share this risk with customers through product pricing. However, any impact on delivered volumes represents de facto exposures if volumes suffer from “hedged” prices. This degree of freedom involves the sales and marketing organizations. Finally, the company may elect to self‐insure and opt to do nothing to manage the risk, but capitalize itself appropriately for the level of risk that is to be absorbed. This ultimately involves the corporate treasury, which must ensure adequate capitalization for the anticipated level of risk.
There is increasingly a need to leverage capabilities, and ensure coordination across sourcing, production, marketing and sales, (potentially trading) treasury, and HQ. Expansion of the typical strategic sourcing agenda, beyond vendor management, incorporates elements of strategic risk management, including operations, contract redesign, and physical and financial hedging.
Strategic Risk Management
Overcoming the typical pitfalls requires a more rigorous and complete perspective of the issues and degrees of freedom, as well as leveraging capabilities and coordinating execution seamlessly across the organization. Figure 7.4 illustrates the progression of decision points to address in strategic risk management, beginning with “what risks to own,” and continues through to how best to manage each exposure.8
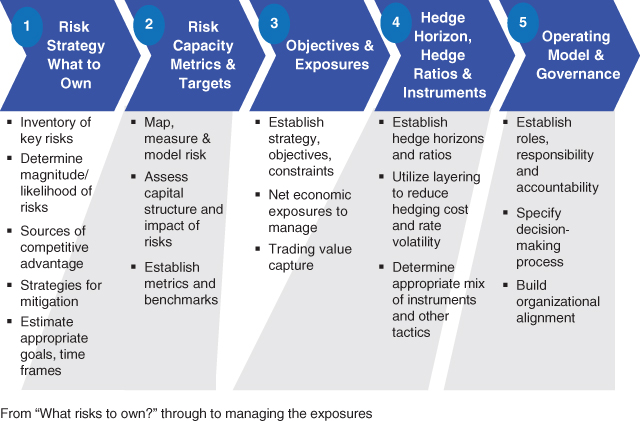
Figure 7.4 Strategic Risk Management Framework
Source: IHS Energy
Risk Strategy (What Risks to Own)
Net economic exposures are typically a combination of both sales and spend, depending on the business. Better candidates for centralized sourcing are those with less category differentiation and greater scale benefits; in recent years, strategic sourcing initiatives have driven waves of centralization, standardization, demand management, and discounts. Strategic sourcing brings an increased focus on understanding the supply markets and cost‐to‐serve as part of fair return sourcing. However, considerable opportunity remains to understand net economic exposures and to establish priorities, tools, and guidelines to optimize risk–return trade‐offs with effective use of risk mitigation mechanisms.
The first step involves making active design choices around what risks to own and what risks not to own (i.e., shift, hedge, share, pass through), based on strategy, capabilities, and relative advantage (see Figure 7.5). Both the competitive and economic context will influence choices between doing nothing, physical or financial hedging, and even trading.9
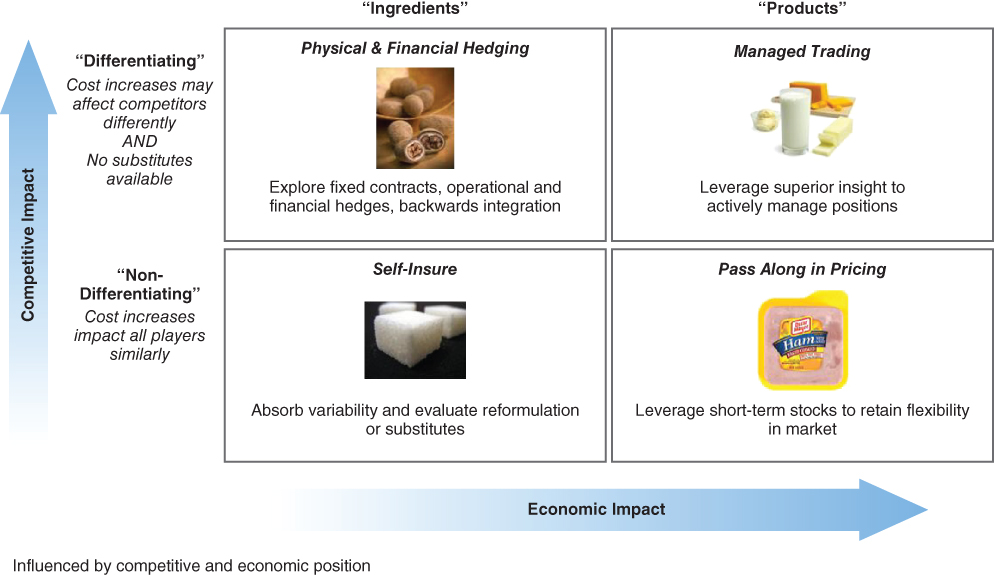
Figure 7.5 What Risks to Own
Source: IHS Energy
For example, many companies with large fleets (e.g., airlines) consume vast quantities of fuel, and are thus naturally short (i.e., jet fuel in this case). However, this short position becomes a choice. In days when no airlines hedged, and the impact was small, it made sense to do nothing, and effectively “self‐insure” (i.e., bottom left quadrant) and capitalize accordingly (i.e., surplus cash and equity to buffer risk). As the impact got more material and the cost of self‐insuring too great, airlines would then pass along this exposure to customers in their product pricing (i.e., bottom right quadrant).
However, some airlines embraced both physical and financial fuel hedging as a source of competitive advantage to support aggressive pricing in select markets, making the top left quadrant more justifiable, in terms of competitive and economic position. Ultimately, we would not expect a progression to fuel trading for the airlines (i.e., top right quadrant) because fuel is more of an ingredient than it is a product, and they have no competitive advantage in market insight.
Risk Capacity (Metrics and Targets)
The second step is to establish relevant risk guidelines based on capacity to own risks, and to a lesser extent risk appetite, with specific hedging targets and benchmarks. This involves defining objectives, priorities, and constraints (e.g., enhance liquidity and debt capacity by reducing cash flow volatility).10 An enterprise's capacity for risk may be expressed in terms of its financial strength, for which credit rating is a common proxy.
Requisite financial strength, and the associated credit rating, is a corporate target that is often set with consideration to many factors, including external threats, competitive dynamics, vendor bargaining power, pricing pressure, and capital needs.
Once a target is set—for example, a moderate investment grade of BBB/Baa2—the company is loath to allow its position to deteriorate. Therefore, a useful capacity for risk is one‐half of a “notch” within the credit rating. We can translate this rule of thumb into a dollar‐size shock by triangulating within conventional credit metrics (e.g., one‐half a turn of EBITDA). We can also test capacity for risk from an equity perspective, by translating one‐half of a notch of credit capacity into earnings per share (eps@risk).
Objectives, Exposures, and Tactics
The third step in a design process is to identify and characterize a complete inventory of economic exposures—source, size, and drivers—and the exposures to be managed (see Figure 7.6). This involves defining, measuring, and analyzing all exposures (e.g., commodities, FX, interest rates), with special attention to aggregating, netting, natural offsets, and correlations. This includes determining the extent to which each exposure needs to be, and can be, managed, plus an evaluation of the spectrum of available tactics.
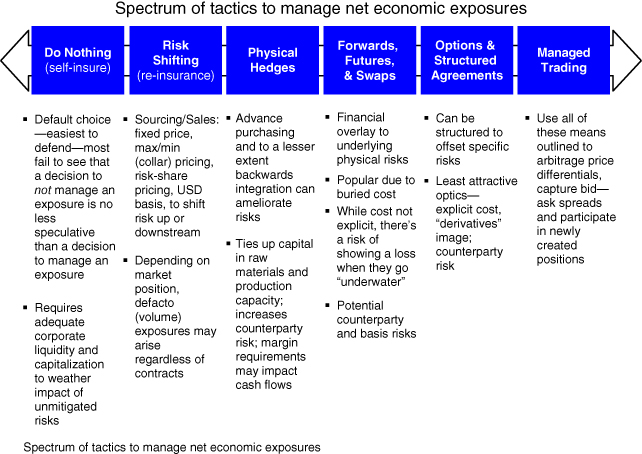
Figure 7.6 Spectrum of Risk Management Tactics
Source: IHS Energy
For example, take the case of a domestic manufacturer of industrial products. This company was growing in several emerging markets through both export and foreign direct investment despite the challenging headwinds of both commodity and currency price volatility. Despite vertical integration, they were largely unable to find ways to shift or share risk with suppliers through alternative forms of contracted price agreements. And in some cases, passing foreign exchange risk along to customers, via USD pricing, put contracted volumes at risk, simply creating a de facto exposure. This company designed a currency strategy to support overseas competitiveness in local emerging markets during the initial years of establishing a market presence by hedging net economic exposures with layers of both swaps and options.
Hedge Horizon, Hedge Ratio, and Instruments
The fourth step in the design process is where most companies that are new to hedging think they should begin. This involves numerous degrees of freedom, but is ultimately about the design of any physical or financial hedges that are required. This involves comparing the suitability of various hedging tools and determining how to incorporate these tools into a systematic program that will achieve stated goals, views, and risk preferences, for each exposure.
There are many potential hedging instruments, including swaps, forward contracts (outright forward, window forward, nondeliverable forward), options (plain‐vanilla, barrier/digital options), and zero‐cost structures (collar, participating forward, embedded premium option). Any assessment of the instruments goes beyond simple cost, and includes opportunity costs, risk profile, and so forth.
Swaps and forwards tend to be the most popular instruments for hedging currency, commodities, and interest rate exposures, largely because they do not carry an explicit fee. Surprisingly, it is still difficult today for managers to get approval to spend money to buy insurance. However, “free” insurance does not garner the same level of scrutiny, or require the same levels of approval (this is a common flaw in the design of enterprise operating models). And the cost of these hedge instruments is contained within the opportunity forgone of a symmetrical pay‐off profile, and the bid–ask spread. Similarly, for more sophisticated users willing to entertain options or structured products, collars and participating forwards tend to be the most popular. Again, these instruments carry no explicit cost because their cost is contained within the opportunity forgone of a symmetrical pay‐off profile, and the bid–ask spread.
Unfortunately, conventional wisdom can have disastrous consequences.11 Symmetrical hedges are ill‐suited to longer‐dated hedge horizons and more volatile underlying assets, which increases the risk of the hedge going underwater (out‐of‐the‐money, or negative NPV). Underwater hedges can grow to represent extraordinarily large unrealized losses that must be disclosed for public reporting purposes. Typically, pressure will mount for these hedges to be unwound—often at exactly the wrong time—forcing recognition of the loss and eliminating the original protection of the hedge.
Notwithstanding, there is often too much focus on hedge instruments and not enough planning around the other design aspects. Hedging policy should include hedge horizon, hedge amounts, hedge ratios, use of layering (as a means to reduce cost and mitigate risk, illustrated in Figure 7.7), instruments, and authorities and control processes.12
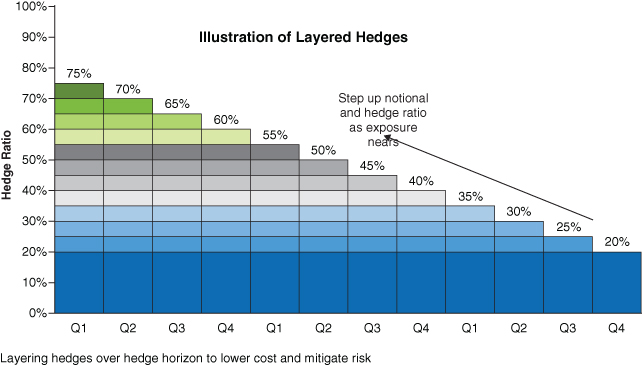
Figure 7.7 Illustration of Layering
Source: IHS Energy
Business Models for Trading
Trading business models require distinct organizational capabilities (and in some cases, positional assets) to confer a “right‐to‐play” and ultimately, “a right‐to‐win.” Three models represent pure‐play archetypes, but in practice, blended forms are more prevalent, drawing on: (1) asset‐based trading, (2) information‐based trading, and (3) services models.
“Rents” from Proprietary Asset Positions
Involves leveraging positional assets and market insight to extract a toll or rents from the asset positions—the physical counterpart to extracting a bid–ask spread for making a market in a financial security. Profitability tends to vary with market share, and above‐market profits are associated with structural advantages, such as assets in a proprietary position or geography (e.g., the only refinery in a region with limited access to other logistics), or temporary advantages (e.g., a shutdown at one refinery creates a short‐term tollgate at another). For example, US West Coast refineries enjoyed attractive rents due to their advantaged location.
Network Optimization
Involves effectively trading around existing positional assets (e.g., proprietary sources of production, transport, storage, or demand), for inbound or outbound flows. Leveraging positional assets and market insight to select and source inputs, transport/store, or to select and sell outputs can maximize overall efficiency, utilization, and profitability of a positional asset. For example, in “midstream” energy, improving crude slate sourcing can optimize refining and maximize value across the asset.
Physical Arbitrage
Involves leveraging market information, positional assets, and speed of execution to exploit price differentials. These price differentials might be across time‐periods, or between geographies, and are not supported by market fundamentals, such as the cost of transport, price of netbacks, alternative points of supply, carrying costs, storage costs, and so on. For example, a price differential FOB two different locations may exceed the cost of transport, creating an opportunity to buy at the lower price, sell at the higher price, and transport product between the two locations.
Market Making
Akin to rents, market making is providing market liquidity to generate profits through the bid–ask spread in return for the risk capital employed and liquidity risk assumed. When someone is willing to make a market—willing to either buy or sell at someone else's option—they earn the bid–ask spread as a payment for providing liquidity to the market and tying up risk capital. This creates a liquid market by providing price and deal flow support. Requisite capabilities include market insight to set the bid and ask prices, order execution, and capital.
(Capabilities‐Based) Proprietary Trading
This involves a buyer or seller undertaking risk (i.e., because they have a different portfolio, market outlook, lower cost of capital, scale to self‐insure, or are less risk‐averse) that others will pay to “lay off.” Assumed risks might include counterparty/credit risk, price risk (fixed price), basis risk (hedged on a different basis), operational risk (guaranteed delivery); this requires positional assets, market insight, capital, and a portfolio.
(Arbitrage‐Oriented) Proprietary Trading
This involves taking physical and/or financial positions in the market to exploit price differentials across time‐periods and/or between geographies, based on fundamentals (e.g., cost of transport, price of netbacks, alternative points of supply, carrying costs, storage costs, etc.), or to exploit a point of view based on supply/demand fundamentals. For example, a forward oil price may not accurately reflect the impact of new production coming online. Requisite capabilities include proprietary market information or superior insight, risk capital, and speed of execution. Scorecards must integrate the analytic tools for decision making to provide a closed‐loop process; trading returns may not justify the additional risk capital associated with “trading for profit.”
Fee‐for‐Services
Some services have traditionally been bundled with trades, but increasingly these services may be disintermediated, and charged separately—for example, the process of aggregating and disaggregating odd lot orders into round lots, or board lots, for execution, or providing points where orders may be transferred from one mode of transport to another. Other trade‐related services include services around customs or exchange requirements, order management, trade information, and account servicing and financial services (e.g., insurance, financing).
Hedging and Trading Operating Model
The final design step is an appropriate risk management operating model, with consideration to organizational architecture, management processes, decision rights, information flows, and governance:
- Centralized decision rights to avoid double hedging, “wrong‐way hedging,” facilitate netting, and achieve economies of scale.
- Streamlined approval and control processes for timely and accurate reporting and appropriate treatment of “costless” symmetric versus asymmetric hedges.
- Risk‐adjusted scorecards and analytical engines; metrics incorporate returns on economic risks—such as risk‐adjusted return on capital (RAROC) and economic profit (EP). RAROC and EP measures are part of the standard toolkit for trading profitability analysis both on a “top‐down” strategic level and a “bottom‐up” transaction level.
- Potential conflicts with performance management systems and incentive programs to ensure alignment.
- An execution platform with the necessary information, analytical support, plus timely and efficient execution.
Performance Measurement in Trading
Risk‐adjusted scorecards and analytical engines play a key role in the successful implementation of risk management strategies. Performance measurement in trading is evolving to meet strategic needs, but most trading operations have built systems to monitor performance by counterparty, by segment, by security, and by professional. Performance measures must relate returns to their economic risks—such as risk‐adjusted return on capital (RAROC) and economic profit (EP). These measures require appropriate resolution of numerous complex performance measurement issues.
Risk Capital Allocation
Economic capital (risk capital) is the amount of equity capital necessary to cushion against unexpected losses (i.e., expected losses are expensed) from market risk, operating risk, and credit risk (i.e., VaR, typically at 95 percent or 99 percent confidence on a one‐day basis). However, risk capital may not be additive due to risk‐diversifying effects within a portfolio, making any “reconciliation” of top‐down and bottom‐up capital‐based measures very difficult.
Market‐Based Transfer Prices
Market‐based or arm's‐length transfer prices are needed for fees, commissions, markup, spread retention, and positioning profits, net of funding costs and expected losses. Challenges include the triangulation of these prices in vertically integrated or less liquid markets.
Cost Accounting
Indirect expenses may be allocated on an activity‐basis, at an account‐level detail or using portfolio characteristics, on the basis of routine transaction counts, special handling counts, credit ratings, and inquiry counts, for example.
House Performance
To measure house performance we must isolate the impact of customer facilitation (including captive customer demand) from discretionary positioning. Internal trading performance excludes positions taken to facilitate internal or external customer trades (customer order flow execution value, net of customer facilitation costs).
The best time to launch a risk management initiative is, of course, in advance of any blow‐up. At a minimum, companies that have experienced hedging losses, sharp rises in procurement costs, or eroding margins due to currency and commodity volatility should develop a comprehensive inventory of net exposures, evaluate which risks they are strategically advantaged to own or not own, and assess the company's capacity for risk. This process can piggyback onto other initiatives, such as sourcing waves, hedging policy development or rewrites, and enterprise risk management initiatives, to avoid initiative overload and harness natural synergies between efforts.