
CHAPTER 2
The New Agenda
Industry leaders face seemingly conflicting imperatives to cut costs in response to a supply glut with low liquids and natural gas prices, but also to invest in the needs of the business—facing much higher‐cost resources, such as deep‐water projects, unconventionals, oil sands, and difficult international frontiers.
Companies (and countries) are adjusting to lower oil and gas prices, but many of the actions being taken are not consistent with longer‐term needs for investment and sustainable growth. Furthermore, sadly, some of these actions are unsustainable, or at best, one‐time gains and not scalable across new future production.
A new strategic agenda and operating model where cost transformation is premised on a capabilities‐driven strategy can resolve these seemingly conflicting imperatives—to cut costs sustainably while investing in the future of a business.
UPSTREAM COST TRANSFORMATION
Upstream project deferrals, spending cuts, and vendor concessions were the first tools to cut costs and conserve cash, but now we are in the midst of an important cost transformation with companies and countries adjusting to “lower‐for‐longer” prices. Cost initiatives that deliver the greatest impact and bring the most value to an enterprise are not only “large‐bucket” spend items but initiatives that are both sustainable over a full cycle and scalable across each unit of production—effectively unit costs, rather than period costs (see Figure 2.1).
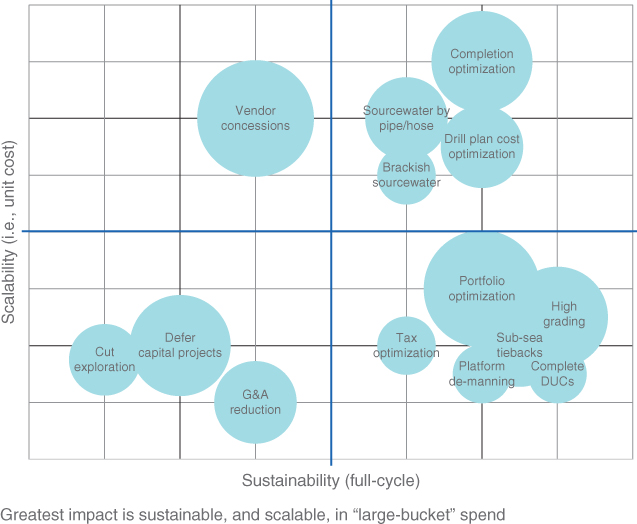
Figure 2.1 Illustration of Upstream Cost Initiatives
Source: IHS Energy
Intrinsic Value of Cost Savings
In intrinsic value terms, we can derive a “shortcut” valuation multiple to approximate the present value of cost savings associated with fully sustainable measures, as follows:
Present value of permanent cuts into perpetuity
= Savings × (1 - Tax rate) ÷ Discount rate
PV = Savings × (1 - 40%) ÷ 10%1
PV = Savings × 6 (i.e., a valuation multiple of roughly 6×)
We illustrate, with our framework, the intrinsic value of some efforts, such as a permanent but one‐time tax optimization, or the completion of an inventory of DUCs. Many of the largest gains thus far—such as vendor concessions that are driving US services companies into bankruptcy—will not be sustainable over a full cycle. Services pricing will need to recover as fleet utilization recovers, in order to provide sustainable levels of profitability. Unsustainable cuts (i.e., top and bottom left quadrants) cannot be valued as a permanent savings into perpetuity, and therefore warrant a multiple much less than 6×, and in some cases, where they are neither sustainable nor scalable, may warrant no multiple at all.
To warrant a premium valuation multiple (i.e., >6×), we require not only sustainability but also scalability—gains that can continue to be replicated on a much larger scale with the growth of the business. Generally speaking, scalability is achieved through gains associated with the unit costs of production, not with period costs. In our figure, premium multiples are afforded on efforts in the top right quadrant, such as scalable well cost/productivity initiatives.
Some of the greatest gains thus far—such as high grading—are sustainable but less scalable. The opportunity for high grading is constrained by the areal extent of highest quality core acreage and is, therefore, not scalable across the entire portfolio. In other cases, like drastic cuts to exploration or overhead spend, these are period costs rather than unit costs. And by their very definition, capital project deferrals are neither sustainable nor scalable; while they can play an important role in preserving cash, they do not warrant a multiplier to approximate their contribution to intrinsic value.
High‐Grading
As rig activity plummeted, high‐grading emerged to mitigate the supply impact. Much of the US new well spud activity retrenched to West Texas, especially the well‐established and relatively low‐cost Greater Permian Basin while more rigs were idled in other plays. However, in the Bakken and Eagle Ford, the inventory of drilled but uncompleted wells (DUCs) was worked down in the core areas of higher well productivity, leading to considerable growth in new production at the cost of very few rigs. Just three of the Eagle Ford's 15 active counties account for most of the top‐performing wells.
Capital in 2016 is roughly 65 percent more efficient than 2015, due to this focus on higher quality core acreage and advances in well design and completions techniques, which can bring dramatic productivity gains. Proppant intensity continues to grow in the better parts of most major plays, especially the Haynesville, Permian, and Marcellus. However, operator results are mixed and productivity gains generally limited to the sweet spots. These gains appear to be both sustainable and scalable, but only to the full areal extent of the core acreage.
Reprioritizing (to Suit Forward Prices)
Beyond high‐grading per se, operators must continually revisit the prioritization of their opportunity set to suit evolving forward price curves. If West Texas Intermediate (WTI) and Henry Hub prices are down 50 percent, we face very different well economics. Just as the best strategy depends on the operator, the portfolio, and the capabilities, so, too, does it depend on the price environment.
Under high prices, the most important cost in the field is the opportunity cost of forgone production—well costs and the relative quality of acreage are less important because net present value (NPV) is positive in all but the worst cases (below). In a high‐price environment, the Bakken's, Eagle Ford's, and Utica's relatively high initial productions (IPs) are very attractive. High prices make well delivery a key upstream capability, driving widespread interest in lean manufacturing and directing upstream services to be outsourced with an eye toward ensuring availability.
Under low prices, the economics of different plays, such as the Permian, are more attractive (see Figure 2.2). Stacked benches and shallower depths can reduce drilling and completion costs, while subsurface risk, established infrastructure, and wellhead price differentials also favor some Permian economics. Operators in the Permian have achieved favorable 30‐day IP rates that, when combined with drilling and completion (D&C) cost savings, culminate in capital dollars that are more than twice as productive in 2016 as they were in 2014. The Wolfcamp, Bone Spring, and Spraberry sub‐plays also captured the interest of Wall Street—not just the acreage but also the services and midstream assets serving these plays.
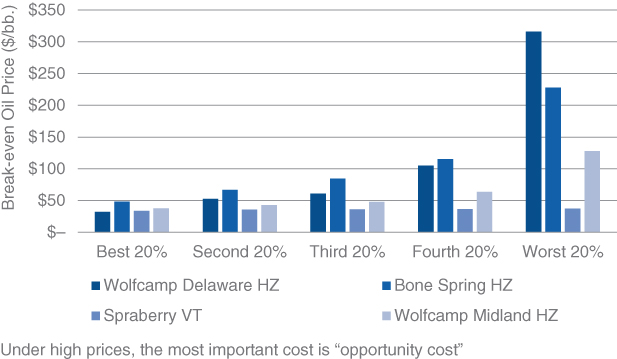
Figure 2.2 Permian Break‐Even Oil Prices by Sub‐play ($/barrel)
Source: IHS Energy
Where services are outsourced, it will be to achieve gains in cost or productivity (e.g., due to greater expertise through specialization, efficiency gains through economies of scale or through better rates of utilization) rather than simply to ensure availability. Commitments to leasehold drilling must yield to the efficiencies of multi‐well‐pad drilling (MWPD) and the productivity of high‐grading and, while some drilled‐but‐uncompleted (DUC) inventory is a natural element in the development process, efforts must be made to lean the balance sheet and minimize any investment in non‐cash‐generating capital (i.e., despite forward price speculation).
However, the best plays are also the worst plays—while the Wolfcamp Delaware boasts the best break‐evens (roughly $32 per barrel), it also boasts the worst ($316 per barrel). And the Bone Spring is quite similar in this regard; therefore, the Delaware Basin outperforms the Midland basin at both ends of the cost curve.
The economics of vertical wells can still be very attractive, with the best Spraberry vertical wells nearly as attractive as the best horizontal wells in the Wolfcamp Delaware. Moreover, Spraberry vertical well economics seem to offer much lower subsurface risk, with even the worst 20 percent breaking even under $40 per barrel (bbl).
It is important to note that noncore acreage in the most attractive Permian basin sub‐plays offers far less attractive economics than what can be achieved from the best acreage in other plays, such as the DJ basin, Eagle Ford, or Bakken. Operators understand this, which is why we see very different areas of relative focus between EOG, Pioneer, Encana, and so on. And so while Pioneer suspended drilling in the Eagle Ford to add rigs in the Midland basin, Encana focused in the Northern Bone Spring of New Mexico.
Fiscal Terms
Operator cost structures are heavily dependent on fiscal terms—both Royalty/Tax (R/T) and Production Sharing Agreement (PSA) fiscal schemes—and their treatment of cost recovery (i.e., both capex and opex). PSAs typically offer the lowest exposure to development cost increases, but not always. They often have the highest recovery because incurred costs are recovered in full—an annual production cost‐recovery ceiling determines the period of recovery (e.g., 100 percent takes less time to recover costs than 15 percent). R/Ts generally have lower cost recovery—costs incurred are usually only partially recovered through tax deduction over a longer period. Lower taxes and shorter depreciation periods produce less cost recovery and so a contractor in a low‐tax R/T is more exposed to capex increases than a PSA with full recovery. When oil‐producing countries face fiscal difficulties, they consider revisions to keep major projects on track and attract new investment.
Strategy‐Led Cost Transformation
Major performance improvement programs can also bring down costs through changes to operating models, such that organizational structures, business processes, and decision rights are optimized to suit the needs of the asset portfolio managed—early stage assets, late stage assets, and unconventionals may each be suited to its own optimal operating model design. This can lead to inefficiencies and performance problems in blended company portfolios.
A strategy‐led cost transformation requires an E&P company to identify and clearly articulate its most critical capabilities—not just a list of core competencies or skill sets, but those very few elements that, in combination, create clusters of capability that define how the organization competes. For example, subsurface capabilities that include frac height measurement and management, to better manage water cut and to optimize stage spacing and well spacing, are important to Permian operators. This helps to define the operator's ideal future state, which then guides the traditional process of a transformation program, complete with program office, templates, and efficiency/productivity benchmarking. A baseline exercise is necessary to develop an understanding of the initial organization, spend, and capabilities. And the transition plan to bridge the journey, from baseline to future state, will define the company's unique blueprint for effective and efficient cost reduction. E&P operators are cutting costs, but most are not using a strategy‐led process to implement these cost reductions, oriented around their requisite capabilities.
Successful change requires a significant investment in systems and workforce education, training, and business/economic literacy. Educating people on why change is needed, how it can benefit them and other stakeholders, and what they can do to help (i.e., that is within their line‐of‐sight) has a profound impact on program and enterprise success. In the pursuit of cost savings, it will be critical for the industry to reduce health, safety, and environmental risks; many organizations may need to increase, not decrease, their spending in this area.
“CUT COSTS AND GROW STRONGER”
A few years ago, three of my business partners published a wonderful book about how companies could simultaneously achieve the seemingly competing needs of near‐term cost cutting and longer‐term investment in growth.2 Based on many decades of working successfully with fast‐moving consumer goods companies, they made the case against across‐the‐board cuts that “spread the pain” across business units and departments and that remain the most common approach today. The prevalence of this tactic stems from its ability to get results quickly with minimal political infighting, as well as its powerful allure in terms of simplicity and apparent “fairness.” This new approach to cost cutting is guided by an approach called capabilities‐driven strategy, which involves identifying and reinforcing key capabilities while pairing those that do not reflect the company's strengths, needs, and long‐term goals.
We can adapt this approach to the E&P context with a somewhat iterative optimization of three critical, but interdependent, elements in an E&P enterprise: (1) strategy, (2) asset portfolio, and (3) operating model. The operating model must follow and support the strategy, and the strategy must suit the portfolio, and the portfolio dictates the requisite needs of the enterprise in terms of the organizational capabilities promoted by the operating model.
Capabilities‐Driven Strategy for E&P
E&P companies can confront the challenge of lower gas and liquids prices while also strengthening their foundation for the future. The cost challenge is an opportunity to identify and reinforce strategic capabilities while shedding those that do not reflect key strengths, organizational needs, or business goals. This will make the enterprise more resilient as tough times continue and more robust when recovery begins.
Unfortunately, when it comes to identifying which key capabilities to reinforce, our industry has a long‐established history of either declaring lofty but unrealistic aspirations of being “best‐in‐class” at everything or buying into the one‐size‐fits‐all solutions pitched by our industry bankers, consultants, experts and pundits.
For example, one line of thinking suggests that operator strategies, and their capabilities, must be recast to minimize or exclude costly, high‐risk mega‐projects (e.g., deep‐water, oil sands, Arctic, subsea gas hydrates), and that since most of the world's lowest‐cost conventional resources are controlled by NOCs, the only remaining viable operator strategy must be to target onshore unconventionals. In today's price environment, the costs and risks associated with a $100 million well in the North Sea or Gulf of Mexico that might come up dry is much less attractive than “poking lots of holes in west Texas where you already know there's oil, at a few million apiece.”3
But every operator cannot embrace the same strategy—they have unique portfolios—and therefore not every operator will need the same capabilities. For example, the deep‐water is expensive and risky, but roughly 70 percent of the 2005–2014 oil and gas discoveries outside of the United States were offshore resources, with roughly one‐half of these in deep waters (i.e., >1000 feet). Furthermore, given the existing portfolios of the seven largest IOCs (including Statoil), about 65 percent of their new source production in 2020 will be offshore. One‐half of this will be deep water. This will be difficult work, but we need someone to do it, and given their portfolios and balance sheets, the IOCs may be the best suited to this job.
Asset Portfolio
Operator strategy must suit the portfolio. And while there will be changes along the road in the journey to an ideal future state portfolio, we cannot assume that every operator can completely change their portfolio to suit an idealized strategy. There are not enough acres in West Texas for everyone.
What then, should operators do if they've been dealt a bad hand? Executives routinely face portfolio decisions about which assets to develop, which assets to starve, and which to sell. Conventional wisdom might be to invest more heavily in stars, or attractive assets, while starving or selling the underperforming or unattractive dogs. But a few years ago, three of my colleagues published a provocative paper, based on empirical research, that demonstrated that this is often wrong. In many cases, more value can be created by improving the operations of the worst‐performing assets, or to “love your dogs.”4 This research concluded with the following recommendations:
- Fixing dogs can yield unexpected levels of shareholder value—experience suggests that turning around an undervalued asset can be analogous to turning around an undervalued company.
- Improving operations is an important lever for adding value. Starving dogs is not a strategy for creating shareholder value; in aggregate, there is more potential value in helping dogs to realize full potential.
- Buying and fixing dogs often produces more value than buying stars. Adding value to a fully valued asset is a tall order—especially given the premiums paid for attractive acreage. It is no wonder that such a large proportion of corporate acquisitions fail to add value for the acquiring shareholders.
These findings underscore the need for operators to launch a process to identify and reinforce key capabilities while cutting those that do not reflect their strengths, needs, and long‐term goals.
Operating Model and Organizational Capabilities
Organizational capabilities are the lifeblood of an enterprise. In the E&P sector, this includes positional assets such as the acreage—the portfolio of subsurface resources is obviously a critical piece of the puzzle. Ideally, these would be “advantaged” positional assets, close to the sweet spots of core plays, but as previously discussed, this is not always the case. Positional assets include production facilities, equipment, and other assets dedicated to finding and development.
But an E&P enterprise's organizational capabilities go far beyond positional assets—they also include intangible assets such as expertise. The case of Mitchell Energy and its position in the Barnett in the very early days of the commercial development of unconventional resources illustrates the importance of these other organizational capabilities.5
The operating model shapes organizational capabilities—including human expertise, technological capacity, and financial resources—to execute the enterprise core functions (e.g., exploration, de‐risking and development, upstream supply chain procurement, production, midstream, commercial, trading), given its positional assets. A precise list of critical capabilities, and their relative importance, is determined by the enterprise strategy, its positional assets, and the implementation of the strategy, as manifested in its operating model. This reconciliation of strategy, asset portfolio, and operating model is the first step toward a strategy‐led cost transformation—a process to identify and strengthen key capabilities while cutting those that do not reflect company strengths, needs, and long‐term goals.
E&P CAPABILITIES
One of the defining characteristics of the oil and gas industry, especially in the upstream, has been the importance of its geologists, geophysicists, and engineers. This has been true for so long and to such an extent that the leadership roles within these enterprises are filled with geologists, geophysicists, and engineers who began their careers in technical roles before migrating into managerial and leadership positions. The growth and evolution of the industry has only increased importance of technical expertise throughout the enterprise because strategic choices and business decisions have become confounded by and confused with technical issues.
Organizational Capabilities
As the industry evolves, so, too, must the strategic agenda, portfolio, operating model, and organizational capabilities. A general template shown in Figure 2.3 outlines 16 upstream organizational capabilities—not departments so much as capabilities areas—each with its own breadth and depth of sub‐specializations. For example, subsurface interpretation might also be split out as its own area.
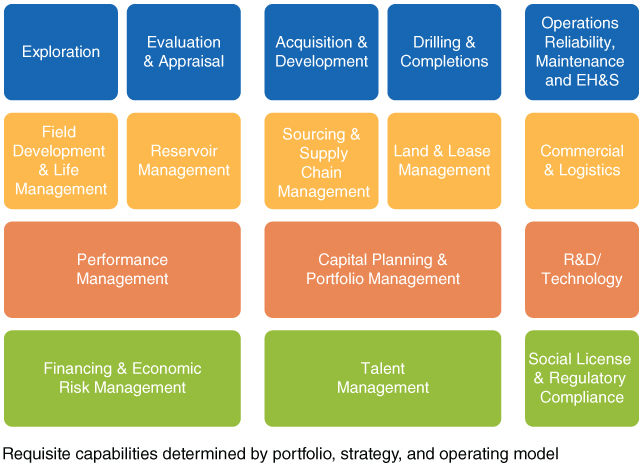
Figure 2.3 Key Organizational Capabilities (E&P)
Source: IHS Energy
Organizational capabilities go beyond positional assets—they also include intangible assets, especially geosciences, engineering, and other technical capabilities. Organizational capabilities also include positional assets—subsurface resources, production facilities, equipment, and other assets dedicated to finding and development. The operating model shapes organizational capabilities—human expertise, technological capacity, and financial resources—to execute core functions for positional assets. A precise list of critical capabilities, and their relative weightings or importance, is determined by the enterprise strategy, asset portfolio, and operating model. The reconciliation of strategy, portfolio, and operating model is a first step in the process to identify and strengthen key capabilities while paring back or outsourcing those that do not reflect the enterprise's strengths, needs, and aspirations.
Integrated Geosciences Capabilities
As our industry continues to evolve to meet challenges brought on by change in our understanding of the global resource base, climate concerns and other environmental drivers, supply and demand factors, and tax and regulatory regimes—to name but a few—so, too, must our strategic agenda better integrate and leverage our geoscience, engineering, and other technical capabilities.
For example, subsurface interpretation with geophysics can be the most cost‐effective and environmentally friendly way to investigate subsurface resources—geophysical methods enable us to acquire large amounts of information at a relatively low unit cost and in a minimally invasive way. In the early days, two‐dimensional (2D) seismic acquisition, data processing, and interpretation informed us about the geology along regional lines in a basinwide prospect assessment. This was a cost‐effective method to learn about the subsurface without drilling wells and performing direct measurement. Continued innovation in geosciences enables us to learn more about the subsurface for finding and development purposes in a cost effective manner—more specific, more detailed, more accurate, and timelier. Integrated technical capabilities can contribute in many ways:
- Exploration and development workflows that employ 2D and 3D seismic–modern acquisition and processing techniques enable higher‐quality subsurface illumination of both conventional and unconventional reservoirs at increasingly lower costs with broad application across geology, reservoir engineering, well planning, and completions; 4D seismic is used to measure the effectiveness of enhanced recovery programs; passive microseismic imaging of hydraulic fracturing is used to improve fracture designs and well completions and to optimize offset well spacing and sequencing.6 However, this might also be done by engineers, via frac height measurement, when inert tracers are mixed with the proppant.
- Seismic attributes and quantitative geophysics can be used in geomechanical modeling to predict localized stress regimes, fault distribution, and cap rock integrity, and to highlight relationships of pay and reservoir quality through cross correlation; three component seismic can help predict fluid distribution, rock properties, and changes in lithology; prestack workflows, such as AVO and anisotropic velocity analysis, can help predict fluid properties and localized stress and fracture orientation.7
- Seismic acquisition can be used to offset rental payments on oil sand leases; induced seismicity monitoring can be used for regulatory compliance and mitigation of seismic risk associated with anomalous ground motion.8
The new strategic agenda must leverage rapid technology evolution. For example, microseismic has become an important geophysical tool for unconventional reservoir exploitation. Concerns of induced seismicity have led to the imposition of regulations requiring seismic monitoring of hydraulic fracturing and waste water injection disposal wells. Cost‐effective technical solutions can play an essential role in an operator's (and the industry's) social license to operate. Another development has been advanced seismic processing and interpretation tools—3D seismic data was initially interpreted like 2D data, with a two‐dimensional grid‐based approach. Most 3D surveys are underutilized with respect to the detailed, high‐resolution delineation of fault systems in the subsurface. While many volume‐based interpretation workflows have been developed, adoption has been slow despite the advantages of voxel‐based interpretation and use of advanced attributes for the extraction of additional information from 3D surveys.
Therefore, given the significant evolution of subsurface technology, there is cause for greater adoption and use of multidisciplinary asset teams to leverage integrated technical capabilities with streamlined workflows, such as the subsurface interpretation of an unconventional play (Figure 2.4).
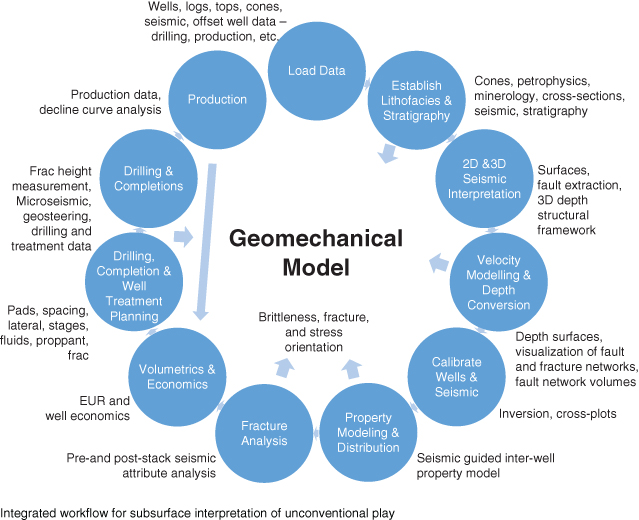
Figure 2.4 Subsurface Interpretation Workflow
Source: IHS Energy
For example, high‐resolution fault visualization from seismic is a promising area for reducing cost and/or increasing well productivity because there are many more small faults penetrated by wellbores than realized and they are often responsible for expensive and time consuming drilling and production problems in compartmentalized, tight, fractured, and unconventional reservoirs, where they form fluid barriers or conduits. Fault networks are often responsible for drilling problems (e.g., gas kicks, fluid losses, borehole instability, casing damage, etc.) and production problems (e.g., faults that are delivering water or allow cross‐flow between zones and wells, compartmentalization, etc.). However, they can also give rise to opportunity (e.g., access to productive natural fracture networks, aka “sweet spots”). Better subsurface interpretation workflows can therefore spawn step‐changes in drilling and production costs and productivity, as well as health, safety, and environmental outcomes.9
More effective workflows may help arrest the decline in exploration success, reduce operational risks and costs, and increase resource recovery. Safer, cheaper, and more productive wells can be drilled with more closely controlled frac height growth and well designs (i.e., especially directional or horizontal wells) that avoid previously unpredicted faulted or fractured zones and by predicting zones where fluid losses, potential kicks, and borehole instabilities could occur.
For example, decision about wellbore placement, downspacing, stage‐spacing, proppant load and lateral lengths might be optimized (i.e., with respect to fluid boundaries and conduits with fault intersections) to drain compartments in matrix‐producing fields and to access the productive natural fault and fracture network.10 Such a capability becomes increasingly important given our global resource base, which is increasingly compartmentalized, tight, fractured, unconventional, or structurally complex.
Focused Applications for Technology Development
The cheapest barrels have been lifted, and, regardless of future prices, higher‐cost barrels are playing a greater role—this is especially true for most operators, who lack privileged access to the world's lowest cost basins. While cost cutting and capital discipline can help, capability‐building, with more focused applications of technology development, offers the more important long‐term answers. Tomorrow's winners will be those investing today in technologies, assets, and expertise to reduce costs. New and improved technologies are playing an increasingly vital role in lower cost/higher productivity exploration, development, and production.
For example, the market for industry talent will tighten sharply when the price cycle recovers because many people are retiring or leaving the industry. Furthermore, “investing” in relationships with key services companies, vendors, operators, and other strategic business partners may become longer‐term sources of competitive advantage.
Technology for the new operating model costs much less than the purpose‐built programmable logic controllers of the 1980s and 1990s and offers greater functionality, mobility, and flexibility to collect and use digital information in new ways to help keep wells online, reduce staffing levels, and promote worker safety. It also offers greater opportunity to variablize costs (e.g., link service contracts to production or other well metrics instead of day rates), to optimize D&C costs and productivity with advanced data analytics, and to enhance day‐to‐day operations management for everything from artificial lift to water hauling with predictive analytics (aka, machine learning) to avoid breakdowns.11
Technology development within the E&P industry will require a much stronger focus on well productivity, improving recovery, and cost reduction—in many cases, this involves focusing technology development more on specific applications, specific plays, regions, or resource types, or specific asset teams. We also need technologies for lower cost, higher‐yield exploration (i.e., “exploration high‐grading”). The challenge is for operators to prioritize increased spend for technology investment in critical capabilities to enhance recovery or improve cost efficiency, amidst the general backdrop of cost cutting (see Figure 2.5). It is now even more critical that enterprise strategic agendas reflect an appropriate and selective prioritization of technology efforts to match the specific challenges of its resource portfolio and strategic imperatives.
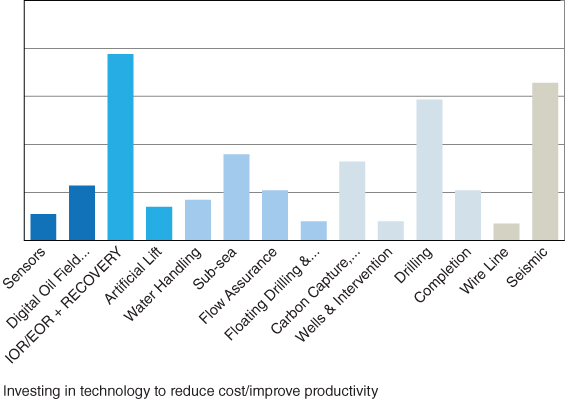
Figure 2.5 Relative Technology Investment Activity, by Capability Area
Source: IHS Energy
Technological advancements must be monitored constantly and implemented where appropriate. This increasingly requires resource‐specific or play‐specific expertise, application, and calibration. Big data analytics, digital oilfield, industrial Internet of Things, drones, robotics, and secure cloud computing can provide paths to a safer, more productive, and lower‐cost future.
Field Life Cycle Management
In a low‐price environment, the trade‐offs between capital expenditures (capex) and operating expenses (opex) require more careful consideration in the design stage. Project plans often underestimate both opex and field life, which leads to underweighting the importance of opex reduction, especially for late‐life fields. In mature fields, the end of life (EoL) is very sensitive to opex, and recoverable reserves are often much higher than original estimates. For example, in one North Sea example, a 15 percent opex reduction extended field life by four years and increased produced reserves by four million barrels. And it deferred very significant decommissioning costs.
Extended field life (and reserves growth) also may be achieved through better imaging, modeling, and production technologies, enhanced oil recovery methods, infill drilling, the development of new zones or adjacent prospects and tie‐ins, and improved reservoir management. Estimated recovery factors can increase as fields mature. In some cases, we see very conservative initial reserve estimates (sometimes required by government regulation).
Indonesia illustrates how more oil can be “discovered” through field life extension than through frontier exploration. In the years from 1982 to 2008, 53 percent of all new reserves were from existing field reserve additions. These reserves have extended the life of many facilities beyond their original design.
Applying “New” Capabilities to “Old” Resources
Low permeability conventional oil will play a more important role in the new strategic agenda and the application of unconventional techniques in mature conventional plays is on the rise. In practice, the distinction between conventional and unconventional resources is more of a continuum—rock types exist as a continuum of permeability (see Table 2.1) into what is now commonly known as unconventional resources.
Table 2.1 Well Architecture as a Function of Rock Type and Permeability
Well architecture and completion practice by rock permeability
Source: IHS Energy
← Continuum of Permeability → |
||||
| Conventional porous & permeable sandstone and carbonate | Mixed sandstone and fine‐grained material | Fine‐grained carbonates | Unconventional shale or chalk | |
| Permeability | >1000 Millidarcies | Nanodarcies | ||
| Porosity | >30 percent | <1 percent | ||
| Well architecture/ Completion practice | Drill and complete | Fracture completions in vertical wells | Long‐reach horizontal wells +/– multistage hydraulic fracturing | Long‐reach horizontals + multistage hydraulic fracturing |
Promising results from applying unconventional technologies, in terms of well architecture and completion practices, to conventional plays involves long‐reach horizontal wellbores and sometimes multistage hydraulic fracturing. Although horizontal drilling and hydraulic fracturing have been used for decades, recent development from experimentation and refinement has advanced these practices and supporting technologies. This includes longer wellbores (i.e., laterals) to contact more of the reservoir, more fracture stages, higher pressures with more water and proppant, enhanced fluids, and better EH&S practices. Modern well completion technology can improve flow rates; reservoirs with porosities below 15 percent may respond positively to horizontal wellbore and multistage fracking techniques.
More than 300 plays were tested with at least one horizontal well in 2010 to 2013 and IHS Energy identified 51 mature conventional plays with at least 10 horizontal wells drilled and average IP rates that were greater than 100 barrels per day (bpd). Mature, conventional, lower permeability (low‐quality) resources such as Granite Wash are renewed resources plays. The Granite Wash formation has produced since 1956, with vertical wells targeting relatively tight reservoir rock (older‐style vertical wells contact less of the total potential reservoir). Granite Wash horizontal wells are twice the cost of vertical wells, but recovery is significantly higher—the play produced oil at more than 10 times its rate of 10 years earlier.
The application of unconventional techniques is also on the rise in Canadian conventional plays. More than 90 plays were tested with at least one horizontal well from 2010 to 2013 and IHS identified 26 mature conventional plays with at least 10 horizontal wells drilled and average IP rates that were greater than 100 bpd, typically using eight fracturing stages across a 5000‐foot lateral at depths of one mile or more. The Cardium, whose largest field is the Pembina, began producing from vertical wells in the 1950s. The formation's dominant rock types are mudstone and sandstone, with small conglomerate fractions. Cardium production surged from 33,000 bpd in 2009 to 114,000 in 2013, adding more than 82 million barrels of oil, with horizontal wells reaching 80 percent of total production.
Many countries beyond North America hold potential for stimulation of low‐productivity conventional reservoirs. The Zagros Foldbelt that stretches from Iran to Iraqi Kurdistan offers tremendous potential with a geology of carbonate reservoirs of characteristically low porosity and permeability. Application of modern 3D seismic acquisition on the Iraqi side indicated a promising string of discoveries, and a similar approach in Iran may produce similar results.
Supply Chain Management as Capabilities Sourcing
Historically, many projects have failed to meet schedules and budgets—project governance systems rooted in the 1990s have been less than effective—and so the approach to upstream supply chain management of the past two decades must be revisited. There is opportunity for a new strategic agenda that takes sourcing and supply chain management beyond the confrontational and unsustainable world of vendor concessions to the collaborative world of capabilities sourcing.
Capabilities sourcing is about (1) how to eliminate waste and create efficiencies in the supply chain, (2) how to improve overall workflows, utilization, and scheduling and loading, (3) finding ways to leverage capabilities where they are most advantaged, (4) insourcing versus outsourcing capabilities, and (5) whether to find economies of scale internally (e.g., via headquarters) or externally (e.g., via a vendor).
For example, as drilling campaigns get shorter, with fewer targets, economies of scale suffer. This has led to operator interest in rig clubs to regain the advantages of larger bookings. And in other cases it might involve bringing activities back in‐house to ensure the supply of value and quality at a fair and sustainable cost.
Capital Planning and Portfolio Management
Cost structures are evolving and new project economics emerging—capital projects increasingly must be redesigned to be economic in a “lower for longer” price regime, with offshore projects scaled down to enable greater use of existing subsea infrastructure, more effort to standardize procurement specifications, de‐manning through remote operation, and investment in technology to enhance recovery.
Cash outlay deferrals can be very valuable—for example, suspending leasehold drilling wherever forfeiture costs are not too great. While the natural resource development cycle involves major cash outlays for a series of de‐risking milestones, the carrying cost of long‐term prospects is presently very high. Infill drilling offers higher success rates, lower costs, and shorter cycle times, to generate more cash, sooner. DUCs and reserves that are proven, developed, and producing (PDPs) are prioritized ahead of longer‐term sources of cash like PDNPs (i.e., proven, developed, not producing), PUDs (proven, undeveloped), and those resources that are classified only as probable or possible (i.e., P2 or P3).
Majors and large independents that were investing the most have responded with the biggest capital expenditure cuts and deferrals—the US Gulf of Mexico and North Sea have been hardest hit. Brazil's offshore has also suffered a steady decline in the number of new projects as Petrobras shifted focus to bringing existing projects on stream. To avoid cutting too heavily, we require better approaches to project cost estimation and risk assessment.
All too often, cost overruns are really just a reflection of optimistic project estimates. The problem with stage gates, single‐point estimates, and generic uncertainty ranges is that they focus too heavily on technical definition (i.e., with little emphasis on other factors such as supply chain market uncertainty), and therefore underestimate the level of uncertainty in cost (i.e., typically on cost upside). To understand cost overruns, we need to distinguish between poor estimates and true overruns. Therefore, part of the solution is to use more sophisticated approaches for project cost estimation and risk assessment.
One key to success is to avoid the forces of “fairness” that led to across‐the‐board cuts and deferrals with no preference for organizational capabilities that are requisite to execution of the strategy. Care is needed to ensure these are not only maintained but even enhanced. Unfortunately, exploration and appraisal (E&A) budgets are an easy target; however, conventional oil and gas volumes discovered in 2015 were their lowest in many years and the future supply gap will be difficult to overcome.12 To this end, the E&A budgets that do get maintained may become more focused on lower cost (e.g., offshore depths less than 5000 feet) and nearer term (appraisal versus exploration) opportunity.
RESOURCE‐BASED KEY CAPABILITIES
Operators must reconcile the interdependence of their strategy, asset portfolio, and organizational capabilities. The biggest costs, most important technologies, and most relevant capabilities are highly dependent on the nature of the underlying resources in the “future state” asset portfolio (see Table 2.2).
Table 2.2 Illustration of Key Costs and Capabilities, by Resource Type
Portfolio choices drive requisite capabilities
Source: IHS Energy
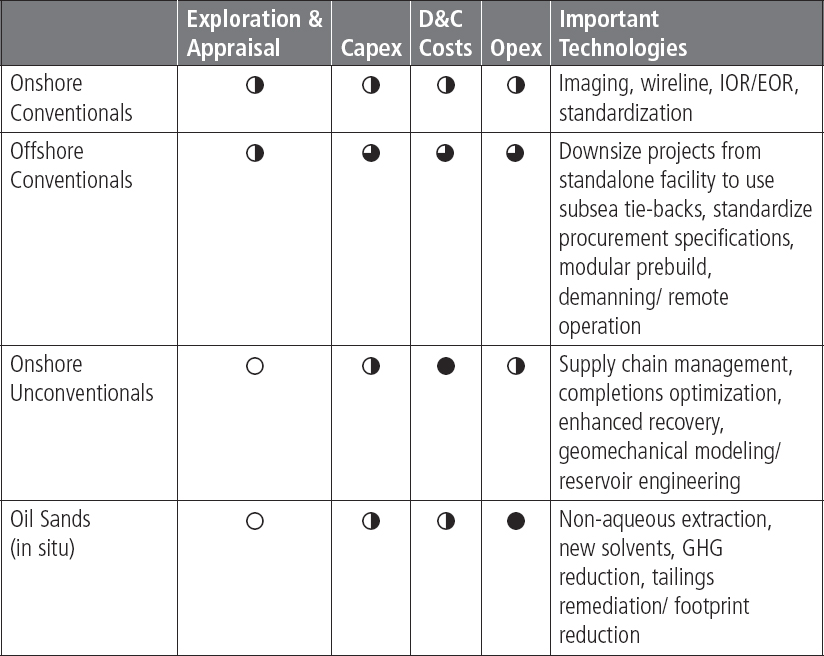
Conventionals
Onshore conventional assets can have a full life cycle cost of say, $20 per barrel of oil (bbl), with nearly one‐half being operating costs. The remainder of the cost structure is exploration and appraisal, capital expenditures, and drilling and completion costs. Success therefore hinges on capabilities for gains in cost/productivity, such as better data processing and interpretation algorithms for imaging, wireline, IOR/EOR, and upstream supply chain standardization programs.
Offshore conventionals (i.e., deep‐water oil) can have life‐cycle costs of $40–$100/bbl, with drilling and completion costs (33 percent) being of a similar magnitude to opex (32 percent) and capex (28 percent). Late‐life assets, such as many in the North Sea, have become especially uneconomic—while production declines operating costs rise (and now prices are lower) with the cost of maintaining aging facilities and infrastructure. However, the high cost of abandonment can keep fields operating—even with negative operating cash flows; abandonment costs can be especially large for the North Sea in Norway. Low oil prices have made late‐stage fields an especially active area for mergers and acquisitions (M&A) deal flow.
In mature plays, operators must re‐scope projects to leverage more of the existing infrastructure by downsizing from standalone facilities and employing greater use of subsea tie‐backs. In the design phase there is greater need for standardization of platforms, subsea equipment, procurement specifications, and to use more modular pre‐build. Shared use of contractors, for example, drill rigs, across multiple projects can create managed programs rather than one‐off activities.
Offshore projects and processes are being redesigned to improve economics enough to move forward in a lower price environment. The focus is on reducing upfront capital cost, drilling costs, and operating costs over the life of field. Drilling and completions and facilities are the two largest capital components of offshore developments; steel, rigs, and equipment account for 66 percent of deep‐water development costs. Facilities spend is a more front‐loaded spend than drilling and therefore has a tremendous impact on NPV. Downsizing a development project from a standalone facility to a subsea tie‐back to existing infrastructure can provide more compelling economics, despite lower production volumes.
For example, Chevron's Buckskin‐Moccasin development in the Gulf of Mexico was originally anticipated to be a semisubmersible development but now appears to involve a tie‐back to the existing Lucius spar. Although the reserve estimate may have changed after an appraisal well, the use of tie‐backs creates lower upfront costs, reduces number of total wells, but also extends production life by more than 10 years (i.e., due to capacity constraints).
Development drilling accounts for a very large portion of capital outlay over the life of a field and so success involves (1) reducing the total number of wells, (2) increasing per well productivity, and (3) staging and deferring. Although fewer initially planned wells lowers the initially required capex, it may well be that wells are actually being deferred and will end up being drilled in later years. A phased approach reduces upfront cost and allows for better placement of producing and injector wells with a greater understanding of the reservoir.
Success also demands a low‐cost operating model that harnesses the talent and entrepreneurial spirit of an asset team and affords greater accountability for commercial delivery—enabling and empowering them to find ways to improve costs and productivity. It must enable them to reduce and streamline operational processes, cut overhead, and revise supply chain management to cut costs. Future operational focus areas might include more de‐manning, subsea technologies (e.g., boosting, separation, injection, compression), and to use de‐manning and remote operations technology.
Unconventionals
With onshore tight oil (and shale gas) assets, there is much less spend on exploration and appraisal, due to the unique nature of the subsurface risk, making this capability area less of an emphasis. But drilling and completion costs (D&C) can be $20 per barrel to $30 per barrel and operating costs $15 per barrel to $20 per barrel, leading to much higher full life cycle costs, in the $35 per barrel to $100 per barrel range.
Therefore, success requires a more agile and entrepreneurial operating model to make many more, smaller‐dollar D&C decisions closer to the drill bit. While often difficult to measure, operational excellence programs have reduced total operating costs, improved equipment availability, and increased production.13
Notwithstanding the popularity of references to lean manufacturing and factory‐style production, D&C priorities must evolve with the price environment and the quality of the acreage. Under low prices, well costs and well productivity are more important than the opportunity cost of forgone production, and the drive toward continuous improvement must find a balance between the efficiency gains of standardization versus the productivity gains of well optimization.
Unconventionals' subsurface risk manifests in tremendous variation in well productivity (and limitations on downspacing), which leads to a wide range in the well economics for a given play, depending on the quality of the acreage. And interestingly, our research indicates that the additional cost of superfrac has a greater impact on higher productivity wells in core acreage, making them that much more productive.
Therefore, we must guard against taking standardization too far—D&C and its related services supply chain is a critical capability area and an important target for technology/cost optimization, including fracking techniques, proppant usage, multistage frac sleeves, composite plugs, open‐hole isolation systems, and so on.
Oil Sands
Oil sands can have a life‐cycle cost in the $50 per barrel to $100 per barrel range (i.e., in‐situ), with operating costs representing 75 to 80 percent of this, and no material spend on traditional exploration and appraisal. Take‐away capacity, and therefore local prices, continue to be a burden on the economics and asset values of western Canada, but on the cost side of the equation, the politics of climate change will bring fresh scrutiny to carbon emissions, tailing ponds, and more. We hope to see new capabilities development in the use of nonaqueous extraction, new solvents, and site remediation as well as social license development.