
IDA is most widely known as a disassembler, and it is clearly one of the finest tools available for performing static analysis of binaries. Given the sophistication of modern anti–static analysis techniques, it is not uncommon to combine static analysis tools and techniques with dynamic analysis tools and techniques in order to take advantage of the best of both worlds. Ideally, all of these tools would be integrated into a single package. Hex-Rays made that move when it introduced a debugger in version 4.5 of IDA and solidified IDA’s role as a general-purpose reverse engineering tool. With each successive version of IDA, its debugging capabilities have been improved. In its latest version, IDA is capable of local and remote debugging on a number of different platforms and supports a number of different processors. IDA may also be configured to act as a frontend to Microsoft’s WinDbg debugger, making it possible to perform Windows kernel debugging.
Over the course of the next few chapters, we will cover the basic features of IDA’s debugger, using the debugger to assist with obfuscated code analysis and remote debugging of Windows, Linux, or OS X binaries. While we assume that the reader possesses some familiarity with the use of debuggers, we will review many of the basic capabilities of debuggers in general as we progress through the features of IDA’s debugger.
Debuggers are typically used to perform one of two tasks: examining memory images (core dumps) associated with crashed processes and executing processes in a very controlled manner. A typical debugging session begins with the selection of a process to debug. There are two ways this is generally accomplished. First, most debuggers are capable of attaching to a running process (assuming the user has permission to do so). Depending on the debugger being used, the debugger itself may be able to present a list of available processes to choose from. Lacking such capability, the user must determine the ID of the process to which he wishes to attach and then command the debugger to attach to the specified process. The precise manner by which a debugger attaches to a process varies from one operating system to another and is beyond the scope of this book. When attaching to an existing process, it is not possible to monitor or control the process’s initial start-up sequence, because all of the startup and initialization code will already have completed before you have a chance to attach to the process.
The manner by which you attach to a process with the IDA debugger depends on whether a database is currently open or not. When no database is open, the Debugger ▸ Attach menu is available, as shown in Figure 24-1.
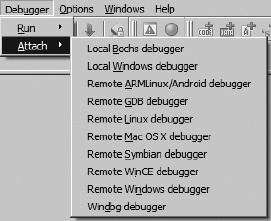
Available options allow selection of different IDA debuggers (remote debugging is covered in Chapter 26). Options vary depending on the platform on which you are running IDA. Selecting a local debugger causes IDA to display a list of running processes to which you may attach. Figure 24-2 shows an example of such a list.
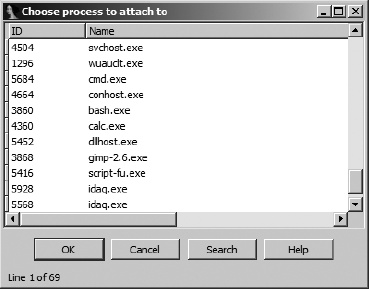
Once a process has been selected, the debugger creates a temporary database by taking a memory snapshot of the running process. In addition to the memory image of the running process, the temporary database contains sections for all shared libraries loaded by the process, resulting in a substantially larger and more cluttered database than you may be accustomed to. One drawback to attaching to a process in this manner is that IDA has less information available to disassemble the process because IDA’s loader never processes the corresponding executable file image and an automated analysis of the binary is never performed. In fact, once the debugger has attached to the process, the only instructions that will be disassembled in the binary are the instruction referenced by the instruction pointer and those that flow from it. Attaching to a process immediately pauses the process, allowing you the opportunity to set breakpoints prior to resuming execution of the process.
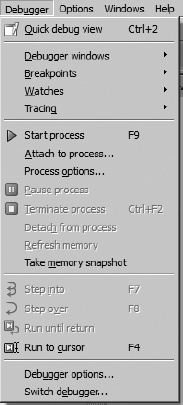
An alternate way to attach to a running process is to open the associated executable in IDA before attempting to attach to the running process. With a database open, the Debugger menu takes on an entirely different form, as shown in Figure 24-3.
If you are not presented with this menu (or one very like it), then you probably have not yet specified a debugger to use for the currently open file type. In such cases, Debugger ▸ Select Debugger will present a list of suitable debuggers given the current file type. Figure 24-4 shows a typical debugger selection dialog.
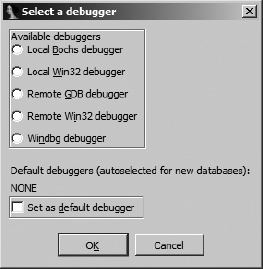
You may make your selection the default debugger for the current file type by checking the box at the bottom of the dialog. The current default debugger, if any, is noted just above the checkbox. Once you have selected a debugger, you may change debuggers at any time via the Debug ▸ Switch Debugger menu.
When Debugger ▸ Attach to Process is selected, IDA’s behavior will vary depending on the type of file opened in the active database. If the file is an executable file, IDA will display a list of all processes that have the same name as the file opened in the database. If IDA can find no process with a matching name, IDA will display a list of every running process and leave it to you to choose the correct process to attach to. In any case, you may attach to any of the displayed processes, but IDA has no way to guarantee that the process was started with same binary image that is loaded in the open IDA database.
IDA behaves differently if the currently open database is a shared library. On Windows systems, IDA will filter the displayed process list to just those processes that have the corresponding .dll file loaded. For example, if you are currently analyzing wininet.dll in IDA, then when you select Debugger ▸ Attach to Process, you will see only those processes that currently have wininet.dll loaded. On Linux and OS X systems, IDA does not have this filtering ability and displays every process to which you have the rights to attach.
As an alternative to attaching to an existing process, you may opt to launch a new process under debugger control. With no database open, a new process can be launched via Debugger ▸ Run. When a database is open, a new process can be launched via Debugger ▸ Start Process or Debugger ▸ Run to Cursor. Using the former causes the new process to execute until it hits a breakpoint (which you need to have set prior to choosing Debugger ▸ Start Process) or until you elect to pause the process using Debugger ▸ Pause Process. Using Debugger ▸ Run to Cursor automatically sets a breakpoint at the current cursor location prior to starting the new process. In this case, the new process will execute until the current cursor location is reached or until an earlier breakpoint is hit. If execution never reaches the current cursor location (or any other breakpoint), the process will continue to run until it is forcibly paused or terminated (Debugger ▸ Terminate Process).
Launching a process under debugger control (as opposed to attaching to an existing process) is the only way to monitor every action the process takes. With breakpoints set prior to process initiation, it becomes possible to closely monitor a process’s entire startup sequence. Controlling startup sequences is particularly important in the case of programs that have been obfuscated, because you will often want to pause the process immediately after the de-obfuscation routines complete and before the process begins its normal operations.
Another advantage to launching a process from an open IDA database is that IDA performs its initial autoanalysis on the process image before launching the process. This results in significantly better disassembly quality over that attained when attaching the debugger to an existing process.
IDA’s debugger is capable of both local and remote debugging. For local debugging, you can only debug binaries that will run on your platform. There is no emulation layer that allows binaries from alternate platforms or CPU types to be executed within IDA’s local debugger. For remote debugging, IDA ships with a number of debugging servers including implementations for Windows 32/64, Windows CE/ARM, Mac OS X 32/64, Linux 32/64/ARM, and Android. The debugging servers are intended to execute alongside the binary that you intend to debug. Once you have a remote debugging server running, IDA can communicate with the server to launch or attach to a target process on the remote machine. For Windows CE ARM devices, IDA communicates with the remote device using ActiveSync and installs the debugging server remotely. IDA is also capable of communicating with the gdbserver[216] component of the GNU Debugger[217] (gdb) or with programs that are linked with a suitable gdb remote stub.[218] Finally, for remote debugging on Symbian devices, you must install and configure Metrowerk’s App TRK[219] in order for IDA to communicate with the device over a serial port. In any case, IDA is capable of acting as a debugger frontend only for processing running on x86, x64, MIPS, ARM, and PPC processors. Remote debugging is discussed in Chapter 26.
As with any other debugger, if you intend to use IDA’s debugger to launch new processes, the original executable file is required to be present on the debugging host, and the original binary will be executed with the full privileges of the user running IDA. In other words, it is not sufficient to have only an IDA database loaded with the binary you wish to debug. This is extremely important to understand if you intend to use the IDA debugger for malware analysis. You can easily infect the debugging target machine if you fail to properly control the malware sample. IDA attempts to warn you of this possibility anytime you select Debugger ▸ Start Process (or Debugger ▸ Attach to process with an open database) by displaying a debugger warning message stating the following:
You are going to launch the debugger. Debugging a program means that its code will be executed on your system.
Be careful with malicious programs, viruses and trojans!
REMARK: if you select ‘No’, the debugger will be automatically disabled.
Are you sure you want to continue?
Selecting No in response to this warning causes the Debugger menu to be removed from the IDA menu bar. The Debugger menu will not be restored until you close the active database.
It is highly recommended that you perform any debugging of malicious software within a sandbox environment. In contrast, the x86 emulator plug-in discussed in Chapter 21 neither requires that the original binary be present nor executes any of the binary’s instructions on the machine performing the emulation.