
At this point you may be wondering how, given all of the anti–reverse engineering techniques available, it is possible to analyze software that a programmer is intent on keeping secret. Given that these techniques target both static analysis tools and dynamic analysis tools, what is the best approach to take in revealing a program’s hidden behavior? Unfortunately, there is no single solution that fits all cases equally well. In most cases, the solution depends on your skill set and the tools available to you. If your analysis tool of choice is a debugger, then you will need to develop strategies for circumventing debugger detection and prevention protections. If your preferred analysis tool is a disassembler, you will need to develop strategies for obtaining an accurate disassembly and, in cases in which self-modifying code is encountered, for mimicking the behavior of that code in order to properly update your disassembly listings.
In this section we will discuss two techniques for dealing with self-modifying code in a static analysis environment (that is, without executing the code). Static analysis may be your only option for cases in which you are unwilling (because of hostile code) or unable (because of a lack of hardware or appropriate sandbox environment) to analyze a program while controlling it with a debugger.
Because IDA may be used to disassemble binaries developed for a number of different CPU types, it is not uncommon to analyze a binary developed for an entirely different platform than the one on which you are running IDA. For example, you may be asked to analyze a Linux x86 binary even though you happen to run the Windows version of IDA, or you may be asked to analyze a MIPS or ARM binary even though IDA runs only on x86 platforms. In such cases you may not have access to dynamic analysis tools, such as debuggers, suitable for use in performing dynamic analysis on the binary you have been given. When such a binary has been obfuscated by encoding portions of the program, you may have no other option than to create an IDA script that will mimic the de-obfuscating stage of the program in order to properly decode the program and disassemble the decoded instructions and data.
This may seem like a daunting task. However, in many cases the decoding stages of an obfuscated program make use of only a small subset of a processor’s instruction set, so familiarizing yourself with the necessary operations may not require an understanding of the entire instruction set for the target CPU.
Chapter 15 presented an algorithm for developing scripts that emulate the behavior of portions of a program. In the following example, we will utilize those steps to develop a simple IDC script to decode a program that has been encrypted with the Burneye ELF encryption tool. In our example program, execution begins with the instructions in Example 21-2.
Example 21-2. Burneye startup sequence and obfuscated code
LOAD:05371035 start proc near LOAD:05371035LOAD:05371035 push off_5371008
LOAD:0537103B pushf
LOAD:0537103C pusha
LOAD:0537103D mov ecx, dword_5371000 LOAD:05371043 jmp loc_5371082 ... LOAD:05371082 loc_5371082: ; CODE XREF: start+E↑j
LOAD:05371082 call sub_5371048 LOAD:05371087 sal byte ptr [ebx-2Bh], 1 LOAD:0537108A pushf LOAD:0537108B xchg al, [edx-11h] LOAD:0537108E pop ss LOAD:0537108F xchg eax, esp LOAD:05371090 cwde LOAD:05371091 aad 8Eh LOAD:05371093 push ecx
LOAD:05371094 out dx, eax LOAD:05371095 add [edx-57E411A0h], bh LOAD:0537109B push ss LOAD:0537109C rcr dword ptr [esi+0Ch], cl LOAD:0537109F push cs LOAD:053710A0 sub al, 70h LOAD:053710A2 cmp ch, [eax+6Eh] LOAD:053710A5 cmp dword ptr ds:0CBD35372h, 9C38A8BCh LOAD:053710AF and al, 0F4h
LOAD:053710B1 db 67h
The program begins by pushing the contents of memory location 05371008h onto the stack ![]() before pushing the CPU flags
before pushing the CPU flags ![]() and then pushing all CPU registers
and then pushing all CPU registers ![]() . The purpose of these instructions is not immediately clear, so we simply file this information away for later. Next, the ECX register is loaded with the contents of memory location
. The purpose of these instructions is not immediately clear, so we simply file this information away for later. Next, the ECX register is loaded with the contents of memory location 5371000h ![]() . According to the algorithm presented in Chapter 15, we need to declare a variable named
. According to the algorithm presented in Chapter 15, we need to declare a variable named ecx at this point and initialize it from memory using IDC’s Dword function, as shown here:
auto ecx;
ecx = Dword(0x5371000);    //from instruction 0537103D
Following an absolute jump, the program calls function sub_5371048 ![]() , which has the side effect of pushing address
, which has the side effect of pushing address 05371087h (the return address) onto the stack. Note that the disassembled instructions that follow the call instruction begin to make less and less sense. The out instruction ![]() is not generally encountered in user-space code, while IDA is unable to disassemble an instruction at address
is not generally encountered in user-space code, while IDA is unable to disassemble an instruction at address 053710B1h ![]() . These are both indications that something is not quite right with this binary (that and the fact that the Functions window lists only two functions).
. These are both indications that something is not quite right with this binary (that and the fact that the Functions window lists only two functions).
At this point, analysis needs to continue with function sub_5371048, which is shown in Example 21-3.
Example 21-3. Main Burneye decoding function
LOAD:05371048 sub_5371048 proc near ; CODE XREF: start:loc_5371082↓p
Closer inspection reveals that this is not a typical function in that it begins by immediately popping the return address off the stack into the ESI register ![]() . Recalling that the saved return address was
. Recalling that the saved return address was 05371087h, and taking into account the initialization of EDI ![]() , EBX
, EBX ![]() , and EDX
, and EDX ![]() , our script grows to the following:
, our script grows to the following:
auto ecx, esi, edi, ebx, edx;
ecx = Dword(0x5371000);   //from instruction 0537103D
esi = 0x05371087;         //from instruction 05371048
edi = esi;                //from instruction 05371049
ebx = Dword(0x5371004);   //from instruction 0537104B
edx = 0;                  //from instruction 05371059
Following these initializations, the function performs a test on the value contained in the EBX register ![]() before entering an outer loop
before entering an outer loop ![]() and an inner loop
and an inner loop ![]() . The remaining logic of the function is captured in the following completed script. Within the script, comments are used to relate script actions to the corresponding actions in the preceding disassembly listing.
. The remaining logic of the function is captured in the following completed script. Within the script, comments are used to relate script actions to the corresponding actions in the preceding disassembly listing.
auto ecx, esi, edi, ebx, edx, eax, cf;
  ecx = Dword(0x5371000);   //from instruction 0537103D
  esi = 0x05371087;         //from instruction 05371048
  edi = esi;                //from instruction 05371049
  ebx = Dword(0x5371004);   //from instruction 0537104B
  if (ebx != 0) {           //from instructions 05371051 and 05371053
     edx = 0;               //from instruction 05371059
     do {
        eax = 8;            //from instruction 0537105B
        do {
           //IDC does not offer an equivalent of the x86 shrd instruction so we
           //need to derive the behavior using several operations
           edx = (edx
 >> 1) & 0x7FFFFFFF;   //perform unsigned shift right one bit
           cf = ebx & 1;                    //remember the low bit of ebx
           if (cf == 1) {                   //cf represents the x86 carry flag
              edx = edx | 0x80000000;       //shift in the low bit of ebx if it is 1
           }
           ebx = (ebx >> 1) & 0x7FFFFFFF;   //perform unsigned shift right one bit
           if (cf == 1) {                   //from instruction 05371066
              ebx = ebx ^ 0xC0000057;       //from instruction 0537106C
           }
           eax--;                  //from instruction 05371072
        } while (eax != 0);        //from instruction 05371073
       edx = (edx >> 24) & 0xFF;  //perform unsigned shift right 24 bits
       eax = Byte(esi++);         //from instruction 05371078
        eax = eax ^ edx;           //from instruction 05371079
       PatchByte(edi++, eax);     //from instruction 0537107B
        ecx--;                     //from instruction 0537107C
     } while (ecx != 0);           //from instruction 0537107D
  }
There are two minor points to raise with this example. First, the right shift operator (>>) in IDC performs signed shifts (meaning that the sign bit is replicated into the most significant bit), while the x86 shr and shrd instructions perform unsigned shifts. In order to emulate an unsigned right shift in IDC, we must clear all bits that have been shifted in from the left, as is done at ![]() and
and ![]() . The second point involves the choice of an appropriate data size and variable to properly implement the x86
. The second point involves the choice of an appropriate data size and variable to properly implement the x86 lodsb (load string byte) and stosb (store string byte) instructions. These instructions write to (lodsb) and read from (stosb) the low-order 8 bits of the EAX register,[180] leaving the upper 24 bits unchanged. In IDC, there is no way to partition a variable into bit-sized portions other than using various bitwise operations to mask off and recombine portions of the variable. Specifically, in the case of the lodsb instruction, a more faithful emulation would read as follows:
eax = (eax & 0xFFFFFF00) | (Byte(esi++) & 0xFF);
This example first clears the low 8 bits of the EAX variable and then merges in the new value for the low 8 bits using an OR operation. In the Burn-eye decoding example, we make note of the fact that the entire EAX register is set to 8 at the beginning of each outer loop, which has the effect of zeroing the upper 24 bits of EAX. As a result, we have elected to simplify our implementation of lodsb ![]() by ignoring the effect of the assignment on the upper 24 bits of EAX. No thought need be given to our implementation of
by ignoring the effect of the assignment on the upper 24 bits of EAX. No thought need be given to our implementation of stosb ![]() , as the
, as the PatchByte function reads only from the low-order 8 bits of its input value (EAX in this case).
Following execution of the Burneye decoding IDC script, our database would reflect all of the changes that would normally not be observable until the obfuscated program was executed on a Linux system. If the de-obfuscation process was carried out properly, we are very likely to see many more legible strings within IDA’s Strings window. In order to observe this fact, you may need to refresh the Strings window content by closing and reopening the window or by right-clicking within the window, selecting Setup, and then clicking OK. Either action causes IDA to rescan the database for string content.
Remaining tasks include determining where the decoding function will return, given that it popped its return address in the very first instruction of the function, along with coaxing IDA to properly display the decoded byte values as instructions or data as appropriate. The Burneye decoding function ends with the following three instructions:
LOAD:0537107F                 popa
LOAD:05371080                 popf
LOAD:05371081                 retn
Recall that the function began by popping its own return address, which means that the remaining stack values were set up by the caller. The popa and popf instructions used here are the counterparts to the pusha and pushf instructions used at the beginning of Burneye’s start routine, as shown here:
LOAD:05371035 start proc near LOAD:05371035
The net result is that the only value that remains on the stack is the one that was pushed at the first line of start ![]() . It is to this location that the Burneye decoding routine returns, and it is at this location that further analysis of the Burneye protected binary would need to continue.
. It is to this location that the Burneye decoding routine returns, and it is at this location that further analysis of the Burneye protected binary would need to continue.
The preceding example may make it seem like writing a script to decode or unpack an obfuscated binary is a relatively easy thing to do. This is true in the case of Burneye, which does not use a terribly sophisticated initial obfuscation algorithm. The de-obfuscation stub of more sophisticated utilities such as ASPack and tElock would require somewhat more effort to implement using IDC.
Advantages to script-based de-obfuscation include the fact that the binary being analyzed need never be executed and that it is possible to create a functional script without ever developing a complete understanding of the exact algorithm used to de-obfuscate the binary. This latter statement may seem counterintuitive, as it would seem that you would need to have a complete understanding of the de-obfuscation before you could emulate the algorithm using a script. Using the development process described here and in Chapter 15, however, all you really need is a complete understanding of each CPU instruction involved in the de-obfuscation process. By faithfully implementing each CPU action using IDC and properly sequencing each action according to the disassembly listing, you will have a script that mimics the program’s actions even if you do not fully comprehend the higher-level algorithm that those actions, as a whole, implement.
Disadvantages of using a script-based approach include the fact that the scripts are rather fragile. If a de-obfuscation algorithm changes as a result of an upgrade to a de-obfuscation tool or through the use of alternate command-line settings supplied to the obfuscation tool, it is quite likely that a script that had been effective against that tool will need to be modified accordingly. For example, it is possible to develop a generic unpacking script for use with binaries packed using UPX,[181] but such a script requires constant tuning as UPX evolves.
Finally, scripted de-obfuscation suffers from the lack of a one-size-fits-all solution to de-obfuscation. There is no megascript capable of de-obfuscating all binaries. In a sense, scripted de-obfuscation suffers from many of the same shortcomings as signature-based intrusion-detection and antivirus systems. A new script must be developed for each new type of packer, and subtle changes in existing packers are likely to break existing scripts.
A recurring theme encountered when creating scripts to perform de-obfuscation tasks is the need to emulate a CPU’s instruction set so the script behaves identically to the program being de-obfuscated. If we had an actual instruction emulator at our disposal, it might be possible to shift some or all of the work performed by these scripts over to the emulator and drastically reduce the amount of time required to de-obfuscate an IDA database. Emulators can fill the void between scripts and debuggers and have the advantage of being both more efficient than scripts and more flexible than debuggers. Using emulators, for example, it is possible to emulate a MIPS binary on an x86 platform or to emulate instructions from a Linux ELF binary on a Windows platform.
Emulators vary in sophistication. At a minimum, an emulator requires a stream of instruction bytes and sufficient memory to dedicate to stack operations and CPU registers. More sophisticated emulators may provide access to emulated hardware devices and operating system services.
IDA does not offer a native emulation facility,[182] but its plug-in architecture is sophisticated enough to allow for the creation of emulator-type plug-ins. One possible implementation of such an emulator treats the IDA database as virtual memory that happens to contain the mapped binary we wish to emulate (courtesy of a loader module). All that is required of an emulator plug-in is to provide a small amount of memory to track the state of all CPU registers and some means to implement a stack. One approach implements a stack by creating a new segment within the database mapped to a location suitable for a stack. The emulator operates by reading bytes from the database location specified by the current value of the the emulator’s instruction pointer, decoding the retrieved values according to the emulated CPU’s instruction set specification, and updating any memory values affected by the decoded instruction. Possible updates might include modifying emulated register values, storing values into the emulated stack memory space, or patching modified values into the data or code sections within the IDA database as dictated by memory addresses generated by the decoded instruction. Control of the emulator could be similar to control of a debugger in that instructions could be stepped through, memory could be examined, registers could be modified, and breakpoints could be set. Memory contents within the program memory space would be displayed courtesy of IDA’s disassembly and hex views, while the emulator would be required to generate its own displays for the CPU registers.
Using such an emulator, an obfuscated program may be de-obfuscated by initiating emulation at the program entry point and stepping through the instructions that constitute the de-obfuscation phase of the program. Because the emulator utilizes the database as its backing memory, all self-modifications are reflected immediately as changes in the database. By the time the de-obfuscation routine has completed, the database has been transformed into the correct de-obfuscated version of the program, just as if the program had been running under debugger control. An immediate advantage of emulation over debugging is that potentially malicious code is never actually executed by an emulator, whereas debugger-assisted de-obfuscation must allow at least some portion of the malicious program to execute in order to obtain the de-obfuscated version of the program.
The ida-x86emu (x86emu) plug-in is an example of an emulator plug-in that is designed to offer emulation of the x86 instruction set. The plug-in is open source and builds with all versions of the IDA SDK from 4.9 onward. Binary versions of the plug-in compiled for all versions of IDA are included with the x86emu distribution. The plug-in is designed for use with either the Windows GUI version or the Qt version of IDA and includes build scripts, which allow the plug-in to be built using either MinGW (g++/make) or Microsoft (Visual Studio 2008) tools. The Qt version of the plug-in is also compatible with the Linux and OS X versions of IDA. Other than the appropriate SDK for your version of IDA, the plug-in has no other dependencies. The plug-in is installed by copying the compiled plug-in binary (x86emu.plw/x86emu_qt.plw) into <IDADIR>/plugins.
No plug-in configuration is required, and the emulator is activated using the alt-F8 key sequence by default. The plug-in may be activated only for binaries that make use of the x86 processor, and the plug-in may be used with binaries of any file type, such as PE, ELF, and Mach-O. The plug-in may be built from source using the tools (Visual Studio or MinGW’s gcc and make) discussed in Chapter 17.
Name | ida-x86emu |
Author | Chris Eagle |
Distribution | Source for SDK v6.1 and binaries for all versions of IDA from 5.0, including IDA Freeware. Source is backward compatible to SDK version 4.9. |
Price | Free |
Description | Embedded x86 instruction emulator for IDA |
Information |
When the x86emu plug-in is activated, the plug-in control dialog shown in Figure 21-4 is displayed. The basic display shows register values and provides button controls used to perform simple emulation tasks such as stepping the emulator or modifying data values.
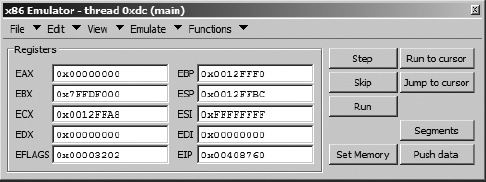
Upon initial activation, the plug-in carries out a number of additional actions. For all file types, the emulator creates new database segments named .stack and .heap in order to provide runtime memory support for emulated program operations. The first time the plug-in is activated within a particular binary, the current cursor location is used to initialize the instruction pointer (EIP). For Windows PE binaries, the plug-in performs the following additional tasks:
Creates an additional program segment named
.headers, rereads the input binary file, and then loads the MS-DOS and PE header bytes into the database.Allocates memory to emulate a thread environment block (TEB) and a process environment block (PEB). These structures are populated with reasonable values in an attempt to convince the program being emulated that it is running within an actual Windows environment.
Assigns reasonable values to the x86 segment registers and configures a fake interrupt descriptor table in order to provide a minimal exception-handling capability.
Attempts to locate all DLLs referenced in the PE file’s import directory. For each such DLL that is found, the emulator creates additional segments within the database and loads the DLL’s headers and export directory. The binary’s import table is then populated with function addresses derived from the loaded DLL information. Note that no code from any of the imported DLLs is loaded into the database.
The current state of the plug-in (register values) is saved in a netnode each time the database is saved or closed. Additional memory state such as stack and heap values is saved as well because these values are stored within dedicated segments in the database. Upon subsequent activation, the emulator state is restored from existing netnode data.
The emulator control dialog is intended to provide capabilities similar to those of a very basic debugger. CPU register contents may be altered by entering a new value into the desired register’s edit box.
The Step button is used to emulate a single instruction. A single instruction is emulated by reading one or more bytes from the database location specified by the EIP register and carrying out any actions specified by the instruction bytes. Where required, register display values are updated to reflect changes resulting from the emulation of the current instruction. Each time the Step button is clicked, the emulator ensures that the bytes at the address specified by EIP are displayed as code (rather than data). This feature helps defeat any desynchronization attempts that may occur within the instruction stream. In addition, the emulator jumps the disassembly display window to the location specified by EIP so that the display tracks along with each emulated instruction.
The Run To Cursor button may be used to emulate an entire sequence of instructions at one time. Emulation continues from the current EIP location and does not stop until a breakpoint is reached or EIP is equal to the current cursor location. The emulator recognizes breakpoints set via IDA’s debugger interface (right-click the desired address and select Add breakpoint) or breakpoints set via the emulator’s own breakpoint interface, Emulate ▸ Set Breakpoint.
Once Run To Cursor has been selected, the emulator does not pause to reformat the disassembly for each fetched instruction; instead it formats only the first and last instructions executed. For long instruction sequences, the overhead associated with reformatting the disassembly at each instruction would result in intolerably slow performance of the emulator. You should use the Run To Cursor command very carefully, as control of the emulator (and IDA) will not be regained until EIP reaches the cursor location. If, for any reason, execution never hits a breakpoint or fails to reach the cursor location, you may be required to forcibly terminate IDA, potentially losing valuable work.
The Skip button is used to advance the emulator by exactly one instruction without emulating that instruction. One potential use of the Skip command is to skip over a conditional jump in order to reach a specific block of code regardless of the state of any condition flags. Skip is also useful for skipping over calls to imported library functions whose code is not available for emulation. Should you elect to skip over a function call, make certain that you update the database to reflect any changes that the function would have made. Examples of such changes include modifying the value of EAX to reflect the desired function return value or populating a buffer whose address was passed to the function. Additionally, if the skipped function uses the stdcall calling convention, you should also be careful to manually adjust ESP according to the number of bytes that the skipped function would have cleared from the stack upon return.
The Jump To Cursor button causes EIP to be updated with the address of the current cursor location. This feature may be used to skip entire sections of code or to follow a conditional jump when the state of the CPU flags may not cause the jump to be taken otherwise. Keep in mind that jumping around within a function may have consequences on stack layout (if you skip over a push or stack pointer adjustment, for example), resulting in unexpected behaviors. Note that it is not necessarily the intention of the emulator that emulation begins with the entry point of a program. It is entirely possible to use the emulator to emulate a single function within a binary in order to study the behavior of that function. This is one of the motivations behind the inclusion of the Jump to Cursor button, to allow easy redirection of your emulation efforts within a binary.
The Run button is similar in functionality to the Run To Cursor button; however, it is more dangerous in that execution continues until a breakpoint is reached. You should be absolutely certain that one of your break-points will be reached if you elect to use this command.
The Segments button provides access to configuration for x86 segment registers and segment base addresses. Figure 21-5 shows the resulting dialog used to alter segment-related values.

While the emulator’s address computations honor the supplied base values, the emulator does not currently provide a complete emulation of the x86 global descriptor table (GDT).
The Set Memory button provides access to a basic memory modification dialog, as shown in Figure 21-6.

This dialog is essentially a wrapper around some of the SDK PatchXXX functions. The type of data to be inserted into the database is selected via the provided radio buttons, while the actual data is entered into the provided edit control. If the Load from file radio button is selected, the user is presented with a standard file-open dialog to select a file whose content is transferred into the database beginning at the specified address.
The Push Data button is used to place data values onto the top of the emulated program stack. The resulting dialog, shown in Figure 21-7, may be used to specify one or more data items that will be pushed onto the stack.
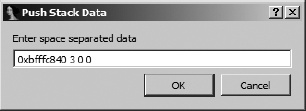
The emulator currently accepts only numeric data. Supplied values are pushed, as 4-byte quantities, onto the emulation stack in right-to-left order as if they were parameters to a function call. The value of the stack pointer is adjusted according to the number of values pushed onto the stack. The intended use of this dialog is to configure function parameters prior to jumping directly to the function to be emulated. This allows a function to be emulated without requiring users to find an actual execution path to the function.
At this point we are ready to discuss the use of x86emu as a de-obfuscation tool. We begin by returning to the Burneye example for which we developed an entire IDC script. Assuming that we have no prior knowledge of the Burn-eye decoding algorithm, de-obfuscation would proceed as follows.
Open the Burneye protected binary. The cursor should be automatically positioned at the
startentry point. Activate the emulator (alt-F8). Figure 21-4 shows the resulting state of the emulator.Begin stepping the emulator, paying close attention to the instructions that are about to be emulated. After six steps, the emulator arrives at function
sub_5371048(see Example 21-3).This function appears to be fairly well structured. We could choose to step the emulator for a while to obtain a better sense of the flow of execution, or we could choose to study the function for a while and determine if it is safe to position the cursor at the function’s
returnstatement and click Run To Cursor. Opting for the latter, we position the cursor at address05371081hand click Run To Cursor.At this point the de-obfuscation is complete. Stepping the emulator two more times executes the
returnstatement, returning the the newly de-obfuscated code, and causes IDA to reformat the de-obfuscated bytes as instructions.
The resulting de-obfuscated code is shown here:
LOAD:05371082 loc_5371082: ; CODE XREF: start+E↑j LOAD:05371082 call sub_5371048 LOAD:05371082 ; -------------------------------------------------------------- LOAD:05371087 db 0 LOAD:05371088 db 0 LOAD:05371089 db 0 LOAD:0537108A db 0 LOAD:0537108B db 0 LOAD:0537108C db 0 LOAD:0537108D db 0 LOAD:0537108E db 0 LOAD:0537108F db 0 LOAD:05371090 ; -------------------------------------------------------------- LOAD:05371090 LOAD:05371090 loc_5371090: ; DATA XREF: LOAD:off_5371008↑o
Comparing this listing to that of Example 21-2, it is clear that the instructions have changed as a result of the de-obfuscation process. Following the initial de-obfuscation, execution of the program resumes with the pushf instruction ![]() at
at loc_5371090.
Emulator-assisted de-obfuscation is clearly easier than the script-oriented de-obfuscation process followed earlier. Time spent developing the emulator approach pays off with a highly flexible de-obfuscation alternative, whereas time spent developing a Burneye-specific script pays off in a very specialized script that is of little use in other de-obfuscation scenarios.
Note that while the Burneye-protected binary in the previous example was a Linux ELF binary, x86emu has no problems emulating the instructions within the binary because they are all x86 instructions, regardless of the operating system and file type that they were taken from. x86emu can be used just as easily on a Windows PE binary, such as the UPX example discussed earlier in this chapter. Because of the fact that the overwhelming majority of obfuscated malware in existence today is targeted at the Windows platform, x86emu contains many features specific to Windows PE binaries (as detailed earlier).
Using the emulator to uncompress a UPX binary is very straightforward. The emulator should be launched with the cursor positioned on the program entry point (start). Next, the cursor can be moved to the first instruction of the UPX import table, rebuilding loops (address 0040886Ch in Example 21-1), and the emulator can be allowed to run using the Run To Cursor command. At this point, the binary has been unpacked, and the Strings window can be used to view all of the unpacked library and function names that will be used by UPX to build the program’s import tables. If the emulator is stepped through the code of Example 21-1, the following function call will eventually be encountered:
UPX1:00408882 call dword ptr [esi+808Ch]
Instructions of this sort can be dangerous to emulate, as it is not immediately apparent where the instruction may lead (meaning that the destination address of the call instruction is not obvious). In general, function calls can lead to one of two places: a function within the program’s code (.text) segment or a function within a shared library being used by the program. Whenever a call instruction is encountered, the emulator determines whether the target address lies within the virtual address space of the file being analyzed or whether the target address correlates to a function that is being exported by one of the libraries that the binary has loaded. Recall that for PE binaries the emulator loads the export dictionaries of all libraries loaded by the binary being analyzed. When the emulator determines that the target address of a call instruction lies outside the bounds of the binary, the emulator scans the export tables that were loaded into the database in order to determine which library function is being called. For Windows PE files, the emulator contains emulated implementations of the functions listed in Table 21-1.
When the emulator determines that one of these functions has been called, it reads any parameters from the program stack and either carries out the same actions that the actual function would carry out if the program were actually running or performs some minimal action and generates a return value that will appear to be correct from the perspective of the emulated program. In the case of stdcall functions, the emulator properly removes any stack arguments prior to completing the emulated function.
Table 21-1. Functions Emulated by x86emu
|
|
| |
|
|
|
|
|
|
|
|
|
|
|
|
|
|
|
|
|
|
|
|
|
|
|
|
|
|
|
|
|
|
|
|
Emulated behavior for the heap-related functions causes the emulator to manipulate its internal heap implementation (backed by the .heap section) and return a value appropriate to the function being emulated. For example, the value returned by the emulated version of HeapAlloc is an address that is suitable for the emulated program to write data to. When the emulated version of VirtualAlloc is called, a new section is created in the database to represent the newly mapped virtual address space. The emulated version of IsDebuggerPresent always returns false. When emulating LoadLibraryA, the emulator extracts the name of the library being loaded by examining the stack arguments provided to LoadLibraryA. The emulator then attempts to open the named library on the local system so that library’s export table can be loaded into the database, and an appropriate library handle[183] value is returned to the caller. When a call to GetProcAddress is intercepted, the emulator examines arguments on the stack to determine which shared library is being referenced; then the emulator parses the library’s export table in order to compute the proper memory address of the requested function, which is then returned to the caller. Calls to LoadLibraryA and GetProcAddress are noted in the IDA Output window.
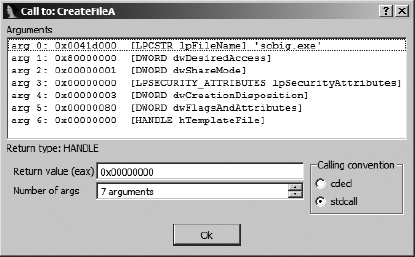
When a function for which x86emu has no internal emulation is called, a dialog similar to the one shown in Figure 21-8 is displayed.
Knowing the name of the function being called, the emulator queries IDA’s type library information to obtain the number and types of parameters required by the function. The emulator then digs into the program stack to display all of the arguments that have been passed to the function, along with the type of the argument and the formal parameter name of the argument. Argument types and names are displayed only when type information is available from IDA. The dialog also offers the user a chance to specify a return value, as well as the opportunity to specify the calling convention used by the function (this information may be available from IDA). When the stdcall calling convention is selected, the user should indicate how many arguments (not bytes) should be removed from the stack when the call completes. This information is required in order for the emulator to maintain the integrity of the execution stack across emulated function calls.
Returning to the UPX de-obfuscation example, and allowing the emulator to complete the import table reconstruction loops, we would find that the emulator generates output such as the following in IDA’s Output window:
x86emu: LoadLibrary called: KERNEL32.DLL (7C800000)
x86emu: GetProcAddress called: ExitProcess (0x7C81CDDA)
x86emu: GetProcAddress called: ExitThread (0x7C80C058)
x86emu: GetProcAddress called: GetCurrentProcess (0x7C80DDF5)
x86emu: GetProcAddress called: GetCurrentThread (0x7C8098EB)
x86emu: GetProcAddress called: GetFileSize (0x7C810A77)
x86emu: GetProcAddress called: GetModuleHandleA (0x7C80B6A1)
x86emu: GetProcAddress called: CloseHandle (0x7C809B47)
This output provides a record of the libraries that the obfuscated binary is loading and the functions within those libraries that the obfuscated program is resolving.[184] When function addresses are looked up in this manner, they are often saved in an array (this array is the program’s import table) for later use.
A fundamental problem with de-obfuscated programs is that they lack the symbol table information that is usually present in un-obfuscated binaries. When a binary’s import table is intact, IDA’s PE loader names each entry in the import table according to the name of the functions whose address it will contain at runtime. When an obfuscated binary is encountered, it is useful to apply function names to each location in which a function address is stored. In the case of UPX, the following lines from Example 21-1 show how function addresses are saved into memory with each pass through the function lookup loop:
UPX1:00408897 call dword ptr [esi+8090h] ; GetProcAddress UPX1:0040889D or eax, eax UPX1:0040889F jz short loc_4088A8
The instruction at address 004088A1h ![]() is responsible for storing function addresses into the import table as it is reconstructed. x86emu provides an automated facility for naming each import table entry provided that an instruction such as this can be identified. The emulator terms such an instruction an import address save point, and you may designate an address as such using the Emulate ▸ Windows ▸ Set Import Address Save Point menu option. This designation must be made before the instruction is emulated in order for this functionality to work. Following designation, each time the instruction is emulated, the emulator will perform a lookup to determine what function is referenced by the data being written and then name the address being written using the name of the imported function. In the UPX example, making no effort to clean up the import table would yield the (partial) import table shown here:
is responsible for storing function addresses into the import table as it is reconstructed. x86emu provides an automated facility for naming each import table entry provided that an instruction such as this can be identified. The emulator terms such an instruction an import address save point, and you may designate an address as such using the Emulate ▸ Windows ▸ Set Import Address Save Point menu option. This designation must be made before the instruction is emulated in order for this functionality to work. Following designation, each time the instruction is emulated, the emulator will perform a lookup to determine what function is referenced by the data being written and then name the address being written using the name of the imported function. In the UPX example, making no effort to clean up the import table would yield the (partial) import table shown here:
UPX0:00406270                 dd 7C81CDDAh
UPX0:00406274                 dd 7C80C058h
UPX0:00406278                 dd 7C80DDF5h
UPX0:0040627C                 dd 7C8098EBh
However, the automated naming that is performed when an import address save point is designated yields the following automatically generated (partial) import table.
UPX0:00406270 ; void __stdcall ExitProcess(UINT uExitCode)
UPX0:00406270 ExitProcess     dd 7C81CDDAh        ; DATA XREF: j_ExitProcess↑r
UPX0:00406274 ; void __stdcall ExitThread(DWORD dwExitCode)
UPX0:00406274 ExitThread      dd 7C80C058h        ; DATA XREF: j_ExitThread↑r
UPX0:00406278 ; HANDLE __stdcall GetCurrentProcess()
UPX0:00406278 GetCurrentProcess dd 7C80DDF5h      ; DATA XREF: j_GetCurrentProcess↑r
UPX0:0040627C ; HANDLE __stdcall GetCurrentThread()
UPX0:0040627C GetCurrentThread dd 7C8098EBh       ; DATA XREF: j_GetCurrentThread↑r
With the import table reconstructed in this manner, IDA is able to properly annotate calls to library functions using parameter-type information extracted from its type libraries, and the overall quality of the disassembly is significantly enhanced.
The emulator contains several additional features that you may find useful. The following list details some of these capabilities.
| File ▸ Dump This menu option allows the user to specify a range of database addresses to be dumped to a file. By default, the range extends from the current cursor location to the maximum virtual address present in the database. |
| File ▸ Dump Embedded PE Many malware programs contain embedded executables, which they install on target systems. This menu option looks for a valid PE file at the current cursor position, parses the file’s headers to determine the size of the file, and then extracts the bytes from the database to a saved file. |
| View ▸ Enumerate Heap This menu option causes the emulator to dump a list of allocated heap blocks to the Output window, as shown here: |
x86emu: Heap Status ---
   0x5378000-0x53781ff (0x200 bytes)
   0x5378204-0x5378217 (0x14 bytes)
   0x537821c-0x5378347 (0x12c bytes)
Emulate ▸ Switch Thread When emulating within a Windows PE file, x86emu traps calls to the CreateThread function and allocates additional resources to manage a new thread. Because the emulator has no scheduler of its own, you must use this menu option if you want to switch among multiple threads. |
| Functions ▸ Allocate Heap Block This menu option allows the user to reserve a block of memory within the emulation heap. The user is asked for the size of the block to reserve. The address of the newly reserved block is reported to the user. This feature is useful when scratch space is required during emulation. |
| Functions ▸ Allocate Stack Block This menu option allows the user to reserve a block of memory within the emulation stack. It behaves in a manner similar to Functions ▸ Allocate Heap Block. |
While the emulator is not intended to be used a debugger, it must simulate a runtime environment for the program being emulated. In order to successfully emulate many obfuscated binaries, the emulator must not fall victim to active anti-debugging techniques. Several features of the emulator have been designed with anti-debugging in mind.
One anti-debugging technique measures time intervals, using the x86 rdtsc instruction, to ensure that a program has not been paused by a debugger. The rdtsc instruction is used to read the value of an internal time stamp counter (TSC) and returns a 64-bit value representing the number of clock ticks since the processor was last reset. The rate at which the TSC increments varies among CPU types but is roughly once per internal CPU clock cycle. Debuggers cannot stop the TSC from incrementing, and therefore a process can determine that it has been stopped for an excessive amount of time by measuring the difference in the TSC between two successive invocations of rdtsc. x86emu maintains an internal TSC that it increments with each emulated instruction. Because the emulated TSC is affected only by emulated instructions, it does not matter how much actual time elapses between uses of rdtsc. In such cases, the difference in observed values will always be roughly proportional to the number of instructions that were emulated between invocations of rdtsc and should always be small enough to convince the emulated program that no debugger is attached.
The intentional use of exceptions is another anti-debugging technique that must be handled by the emulator. The emulator contains very basic capabilities to mimic the behavior of the Windows structured exception handling (SEH) process. When the emulated program is a Windows PE binary, the emulator responds to an exception or software interrupt by constructing an SEH CONTEXT structure, locating the current exception handler by walking the exception handler list via fs:[0], and transferring control to the installed exception handler. When the exception handler returns, the emulator restores the CPU state from the CONTEXT structure (which may have been manipulated within the exception handler).
Finally, x86emu emulates the behavior of the x86 hardware-debug registers but does not make use of those registers in order to set breakpoints within an emulated program. As discussed earlier, the emulator maintains an internal list of user-specified breakpoints that it scans prior to executing each instruction. Any manipulation of the debug registers within a Windows exception handler will not interfere with the operation of the emulator.
[180] The low-order 8 bits of the EAX register are also referred to as the AL register.
[181] See http://www.idabook.com/examples/chapter21/ for one such example.
[182] IDA does ship with a plug-in capable of interfacing with open source Bochs emulator via IDA’s debugging interface. Please refer to Chapter 24 through Chapter 26 for more information.
[183] A Windows library handle uniquely identifies a library within a Windows process. A library handle is actually the base address at which the library is loaded into memory.
[184] Once a program has used GetProcAddress to find the address of a function, the program may call that function anytime it wishes using the returned address. Looking up function addresses in this manner eliminates the need to explicitly link to the functions at build time and reduces the amount of information that can be extracted by static analysis tools such as dumpbin.