
Occasionally, programs expect to handle any exceptions generated during their execution. As we saw in Chapter 21, obfuscated programs often go so far as to intentionally generate exceptions as both an anti–control flow technique and an anti-debugging technique. Unfortunately, exceptions are often indicative of a problem, and the purpose of debuggers is to assist us in localizing problems. Therefore, debuggers typically want to handle all exceptions that occur when a program is running in order to help us find bugs.
When a program expects to handle its own exceptions, we need to prevent the debugger from intercepting such exceptions, or, at a minimum, once an exception is intercepted, we need a means to have the debugger forward the exception to the process at our discretion. Fortunately, IDA’s debugger has the capability to pass along individual exceptions as they occur or to automatically pass along all exceptions of a specified type.
Automated exception processing is configured via the Debugger ▸ Debugger Options command; the resulting dialog is shown in Figure 25-7.
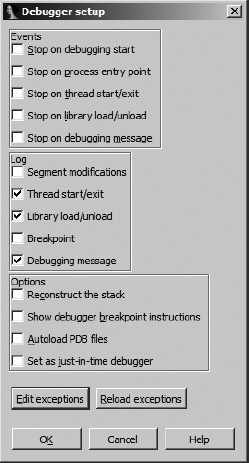
In addition to allowing several events to be configured to automatically stop the debugger and a number of events to be automatically logged to IDA’s message window, the Debugger Setup dialog is used to configure the debugger’s exception-handling behavior. The Edit Exceptions button opens the Exceptions configuration dialog shown in Figure 25-8.
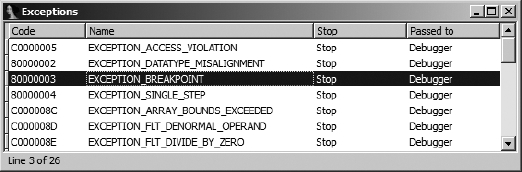
For each exception type known to the debugger, the dialog lists an operating system–specific exception code, the name of the exception, whether the debugger will stop the process or not (Stop/No), and whether the debugger will handle the exception or automatically pass the exception to the application (Debugger/Application). A master list of exceptions and default settings for handling each exception is contained in <IDADIR>/cfg/exceptions.cfg. In addition, the configuration file contains messages to be displayed whenever an exception of a given type occurs while the debugger is executing a process. Changes to the debugger’s default exception-handling behavior may be made by editing exceptions.cfg with a text editor. In exceptions.cfg, the values stop and nostop are used to indicate whether the debugger should suspend the process or not when a given exception occurs.
Exception handling may also be configured on a persession (that is, while you have a particular database open) basis by editing individual exceptions via the Exceptions configuration dialog. To modify the debugger’s behavior for a given exception type, right-click the desired exception in the Exceptions configuration dialog and select Edit. Figure 25-9 shows the resulting Exception editing dialog.
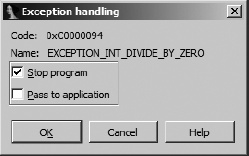
Two options, corresponding to the two configurable options in exceptions.cfg, may be configured for any exception. First, it is possible to specify whether the debugger should stop the process when an exception of the specified type occurs or whether execution should continue. Beware: Allowing the process to continue may result in an infinite exception-generation loop if you also elect to have the debugger handle the exception.
The second configuration option allows you to decide whether a given exception type should be passed to the application being debugged so the application can have a chance to process the exception using its own exception handlers. When the proper operation of an application depends on such exception handlers being executed, you should choose to pass the associated exception types to the application. This may be required when analyzing obfuscated code such as that generated by the tElock utility (which registers its own exception handlers) described in Chapter 21.
Unless you have configured IDA to continue execution and to pass a specific exception type to the application, IDA will pause execution and report exceptions to you as they occur. If you elect to continue execution of the program, IDA will then display the Exception Handling dialog shown in Figure 25-10.
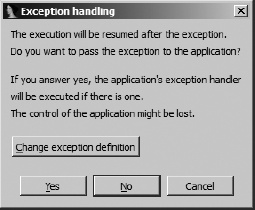
At this point you have the option of changing the manner in which IDA handles the given exception type (Change exception definition), passing the exception on to the application (Yes), or allowing IDA to eat the exception (No). Passing the exception to the application allows the application to handle the exception using any configured exception handlers. If you choose No, IDA attempts to continue execution, which is likely to fail unless you have corrected the condition that was responsible for causing the exception.
A special circumstance arises when you are single stepping through code and IDA determines that the instruction you are about to execute will generate an exception, as is the case with an int 3, an icebp, or a popf that will set the trace flag; IDA displays the dialog shown in Figure 25-11.
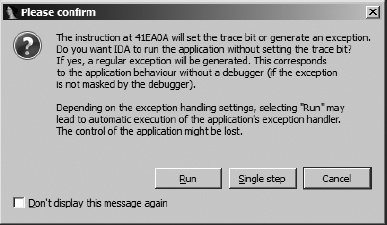
In most cases, the Run option is the most suitable choice and results in the application seeing the behavior that it expects when a debugger is not attached (as noted in the dialog). In working through this dialog, you are simply acknowledging that an exception is about to be generated. If you choose Run, in short order you will then be notified that an exception has occurred, and when you continue execution, you will be presented with the Exception Handling dialog of Figure 25-10 to decide how the exception should be dealt with.
Determining how an application will handle an exception requires that we know how to trace exception handlers, which in turn requires that we know how to locate exception handlers. Ilfak discusses tracing Windows SEH handlers in a blog post titled “Tracing exception handlers.”[236] The basic idea is to locate any interesting exception handlers by walking the application’s list of installed exception handlers. For Windows SEH exceptions, a pointer to the head of this list may be found as the first dword in the thread environment block (TEB). The list of exception handlers is a standard linked-list data structure that contains a pointer to the next exception handler in the chain and a pointer to the function that should be called to handle any exception that is generated. Exceptions are passed down the list from one handler to another until a handler chooses to handle the exception and notify the operating system that the process may resume normal execution. If none of the installed exception handlers choose to handle the current exception, the operating system terminates the process or, when the process is being debugged, notifies the debugger that an exception has occurred within the debugged process.
Under the IDA debugger, TEBs are mapped to an IDA database section named TIB[NNNNNNNN], where NNNNNNNN is the eight-digit hexadecimal representation of the thread’s identification number. The following listing shows an example of the first dword in one such section:
TIB[000009E0]:7FFDF000 TIB_000009E0_ segment byte public 'DATA' use32 TIB[000009E0]:7FFDF000 assume cs:TIB_000009E0_ TIB[000009E0]:7FFDF000 ;org 7FFDF000hTIB[000009E0]:7FFDF000 dd offset dword_22FFE0
The first three lines show summary information about the segment, while the fourth line ![]() contains the first dword of the section, indicating that the first exception handler record may be found at address
contains the first dword of the section, indicating that the first exception handler record may be found at address 22FFE0h (off-set dword_22FFE0). If no exception handlers were installed for this particular thread, the first dword in the TEB would contain the value 0FFFFFFFFh, indicating that the end of the exception handler chain had been reached. In this example, examining two dwords at address 22FFE0h shows the following:
Stack[000009E0]:0022FFE0dd offset loc_7C839AA8
The first dword ![]() contains the value
contains the value 0FFFFFFFFh, indicating that this is the last exception handler record in the chain. The second dword ![]() contains the address
contains the address 7C839AA8h (offset loc_7C839AA8), indicating that the function at loc_7C839AA8 should be called to process any exceptions that may arise during the execution of the process. If we were interested in tracing the handling of any exceptions in this process, we might begin by setting a breakpoint at address 7C839AA8h.
Because it is a relatively simple task to walk the SEH chain, a useful feature for the debugger to implement would be a display of the chain of SEH handlers that are installed for the current thread. Given such a display, it should be easy to navigate to each SEH handler, at which point you may decide whether you want to insert a breakpoint within the handler or not. Unfortunately, this is another feature available in OllyDbg that is not available in IDA’s debugger. To address this shortcoming, we have developed an SEH Chain plug-in, which, when invoked from within the debugger, will display the list of exception handlers that are installed for the current thread. An example of this display is shown in Figure 25-12.
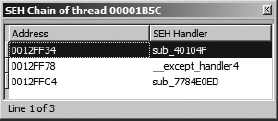
This plug-in utilizes the SDK’s choose2 function to display a nonmodal dialog that lists the current exception-handler chain. For each installed exception handler, the address of the exception-handler record (the two-dword list record) and the address of the corresponding exception handler are displayed. Double-clicking an exception handler jumps the active disassembly view (either IDA View-EIP or IDA View-ESP) to the address of the SEH handler function. The entire purpose of this plug-in is to simplify the process of locating exception handlers. The source code for the SEH Chain plug-in may be found on the website for this book.
The flip side of the exception-handling process is the manner in which an exception handler returns control (if it chooses to do so) to the application in which the exception occurred. When an exception-handler function is called by the operating system, the function is granted access to all of the CPU register’s contents as they were set at the moment the exception took place. In the process of handling the exception, the function may elect to modify one or more CPU register values prior to returning control to the application. The intent of this process is for an exception handler to be given the opportunity to repair the state of the process sufficiently so that the process may resume normal execution. If the exception handler determines that the process should be allowed to continue, the operating system is notified, and the process’s register values are restored, using any modifications made by the exception handler. As discussed in Chapter 21, some anti–reverse engineering utilities make use of exception handlers to alter a process’s flow of execution by modifying the saved value of the instruction pointer during the exception-handling phase. When the operating system returns control to the affected process, execution resumes at the address specified by the modified instruction pointer.
In his blog post on tracing exceptions, Ilfak discusses the fact that Windows SEH exception handlers return control to the affected process via the ntdll.dll function NtContinue (also known as ZwContinue). Since NtContinue has access to all of the process’s saved register values (via one of its arguments), it is possible to determine exactly where the process will resume execution by examining the value contained in the saved instruction pointer from within NtContinue. Once we know where the process is set to resume execution, we can set a breakpoint in order to avoid stepping through operating system code and to stop the process at the earliest opportunity once it resumes execution. The following steps outline the process we need to follow:
Locate
NtContinueand set a nonstopping breakpoint on its first instruction.Add a breakpoint condition to this breakpoint.
When the breakpoint is hit, obtain the address of the saved registers by reading the
CONTEXTpointer from the stack.Retrieve the process’s saved instruction pointer value from the
CONTEXTrecord.Set a breakpoint on the retrieved address and allow execution to continue.
Using a process similar to the debugger-hiding script, we can automate all of these tasks and associate them with the initiation of a debugging session. The following code demonstrates launching a process in the debugger and setting a breakpoint on NtContinue:
static main() {
   auto func;
   RunTo(BeginEA());
   GetDebuggerEvent(WFNE_SUSP, −1);
   func = LocByName("ntdll_NtContinue");
   AddBpt(func);
   SetBptCnd(func, "bpt_NtContinue()");
}
The purpose of this code is simply to set a conditional breakpoint on the entry of NtContinue. The behavior of the breakpoint is implemented by the IDC function bpt_NtContinue, which is shown here:
static bpt_NtContinue() {
    auto p_ctx = Dword(ESP + 4);            //get CONTEXT pointer argument
    auto next_eip = Dword(p_ctx + 0xB8);    //retrieve eip from CONTEXT
    AddBpt(next_eip);                  //set a breakpoint at the new eip
    SetBptCnd(next_eip, "Warning("Exception return hit") || 1");
          return 0;           //don't stop
  }
SetBptCnd(next_eip, "Warning("Exception return hit") || 1");
return 0; //don't stop
}This function locates the pointer to the process’s saved register context information ![]() , retrieves the saved instruction pointer value from offset
, retrieves the saved instruction pointer value from offset 0xB8 within the CONTEXT structure ![]() , and sets a breakpoint on this address
, and sets a breakpoint on this address ![]() . In order to make it clear to the user why execution has stopped, a breakpoint condition (which is always true) is added to display a message to the user
. In order to make it clear to the user why execution has stopped, a breakpoint condition (which is always true) is added to display a message to the user ![]() . We choose to do this because the breakpoint was not set explicitly by the user, and the user may not correlate the event to the return from an exception handler.
. We choose to do this because the breakpoint was not set explicitly by the user, and the user may not correlate the event to the return from an exception handler.
This example represents a simple means of handling exception returns. Much more sophisticated logic could be added to the breakpoint function bpt_NtContinue. For example, if you suspect that an exception handler is manipulating the contents of debug registers, perhaps to prevent you from setting hardware breakpoints, you might opt to restore the values of the debug registers to known good values prior to returning control to the process being debugged.