Chapter 5. Icon and Connector
Imagine for a moment the appearance and development techniques of traditional text-based source code. Thousands of lines of plain black text with some colored keywords and comments interspersed. Myriad cryptic symbols, function names, modifiers, and hex codes. Tracing data flow entails repeated searches for text-based variable names. Source code consists of text, colored text, and cryptic text, while editing involves manipulating text. Let us just say that the overall zest and appeal is somewhat lacking. Enter LabVIEW. Colorful and intuitive diagrams comprise the source code. Functions and routines are represented by icons. Data flow is observed by visual inspection. Welcome LabVIEW, to the formerly mundane world of software engineering!
Icons are a distinguishing feature of graphical source code. They are fun to create and are much more intuitive and visually appealing than lines of text. If a picture is worth a thousand words, then an icon is worth a thousand lines of code in a conventional text-based language. It is not often that engineers, programmers, and scientists have the opportunity to draw cute little pictures. LabVIEW is truly a unique environment.
The icon and connector are often the finishing touches in VI development, enabling the VI to be called as a subVI. The icon is a graphical representation of a subVI call. The connector contains terminals that allow data to flow from the wires of the calling VI’s diagram, through the controls on the subVI’s panel, to the terminals, wires, and nodes of the diagram; upon subVI completion, data returns from the diagram, through the indicator and connector terminals, and back to the wires on the caller’s diagram. This fundamental process is illustrated in Figures 5-1A–5-1D. If the subVI’s front panel window is not open and the diagram does not utilize Property Nodes or local variables, the front panel is not actually loaded in memory. Instead, the data passes directly from the subVI’s connector terminals to its diagram.
Figure 5-1A. A diagram subset contains a subVI call to Find Screw Ends VI. The subVI’s front panel is open to monitor data flow. The controls and indicators are initially empty.

Figure 5-1B. The subVI call with terminals visible. Data flows from the input connector terminals through the controls on the front panel to the corresponding terminals on the diagram.
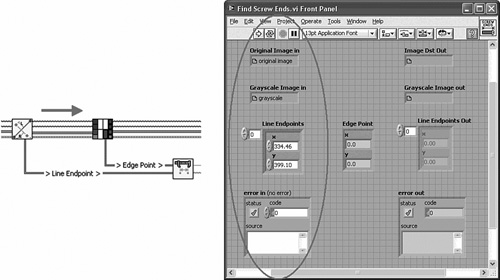
Figure 5-1C. Data flows through the terminals, wires, and nodes of the subVI’s diagram.
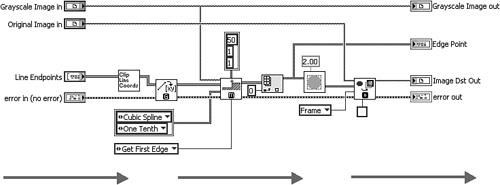
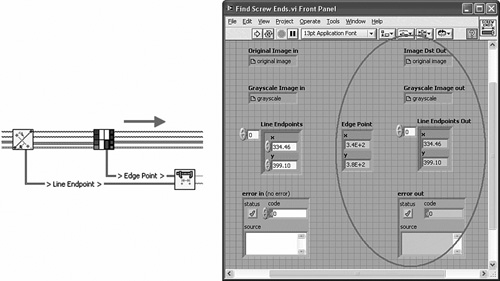
Figure 5-1D. The subVI passes data through the indicators to the output connector terminals and wires on the calling VI.
Hence, the icon and connector facilitate subVI calls. SubVIs promote modularity, organization, and code reuse. Moreover, icons and connectors make software development fun. This chapter provides style rules for the icons and connectors.
5.1 Icon
The icon is a 32×32 pixel symbol containing any combination of graphics and text. Icons are created from scratch using the tools available within LabVIEW’s icon editor, or copied from an existing image file or application. Consequently, any drawing application may also be used to create or manipulate icons. Most of the rules described in this section can be implemented using LabVIEW’s icon editor.
5.1.1 Icon Basics
We begin with some basic style rules for icon development.
Rule 5.1
![]()
Have fun creating icons
It is readily apparent that LabVIEW’s inventors intended for us to enjoy developing software. As much as text-based programmers may try to steal our joy by teasing us for drawing pretty pictures, we know that, deep down inside, they are jealous because they are not having as much fun as we are (nor are they nearly as productive). Creating icons is an enjoyable experience for most developers. The more tips you learn, the more efficient and rewarding it becomes.
Rule 5.2
![]()
Create a unique and meaningful icon for every VI
Rule 5.3
![]()
Never use LabVIEW’s default icons
Rule 5.4
![]()
Save VIs with subVI icons visible instead of terminals
Icons graphically identify the subVI, promote readability, and contribute to documenting the diagrams of the caller VIs. Consequently, it is important to create icons that meaningfully depict the VI’s purpose for each and every VI. The default icons generated by LabVIEW are not unique and meaningful. Always replace them with something more appropriate. Save your VIs with their subVI icons visible on the diagram instead of using terminals. This ensures the icons remain visible each time the diagram window opens.
Rule 5.5
![]()
Use a black border
A black border drawn around the perimeter of the icon helps to clearly delineate the icon from the calling VI’s diagram. Always use a black border unless you have a compelling reason not to, such as an imported graphic that requires every pixel.
Rule 5.6
![]()
Combine a glyph with color and text for best style
Rule 5.7
![]()
Choose universally recognized glyphs
Rule 5.8
![]()
Use 8- or 10-point small fonts for most text
Because icons are only 32×32 pixels, their contents must be small and punchy. Create graphics and fonts that are legible and meaningful within these space constraints. A glyph is a recognizable graphical symbol, such as a public sign or traffic signal. Signs are excellent examples of graphics and text that are combined to provide distinct meaning in a small area. Libraries of glyphs, graphics, and art are available with most drawing applications and online as well. For example, NI Developer Zone hosts an Icon Art Glossary at www.ni.com/devzone/idnet/library/icon_art_glossary.htm.
Applying the default 13-point application font, we are limited to about five characters per line of text, filling one-third of the icon’s height per line. This font is effective for icons that contain just a few large characters, such as F -> C, representing a Fahrenheit to Celsius unit conversion. Use 8- or 10-point small fonts for whole words and acronyms because this maximizes the number of characters that will fit on the icon while maintaining legibility. Using uppercase 8-point small fonts, we can squeeze seven characters of text in one line, occupying just one-quarter of the icon. Note that I am not advocating that we fill up our icons with four lines of text. Graphics and some empty space are desirable, as per Rule 5.6. However, 8- or 10-point small fonts provide more room for graphics and white space for the same amount of text as any larger font. Figure 5-2 provides a comparison of several icon fonts and capitalization.
Figure 5-2. This code snippet provides a comparison of several icon fonts and capitalization. Eight-point small font with all characters capitalized is the smallest legible font.
![]()
The most intuitive and attractive icons combine a glyph, succinct text, and two or three colors. The glyph comprises about half or two-thirds of the icon, with one to three succinct words or meaningful acronyms. Any color can be used for any portion of the icon, but a high level of contrast between foreground and background is desired. This is the case for Find Screw Ends VI, shown in Figure 5-3. A glyph of a screw dimension comprises the bottom two-thirds of the icon, and two words appear across the top third. Black and gray are used for the screw and text, and a bright yellow background is used for contrast.1 Not the preferred color scheme for the panel of a GUI VI, but great for an icon. The combination of text and graphics is important because they reinforce each other. A glyph can be incomplete or subject to interpretation, and succinct text is an excellent enhancement.
Figure 5-3. The icon of Find Screw Ends VI combines a glyph of a screw with two words created using 8-point small fonts.

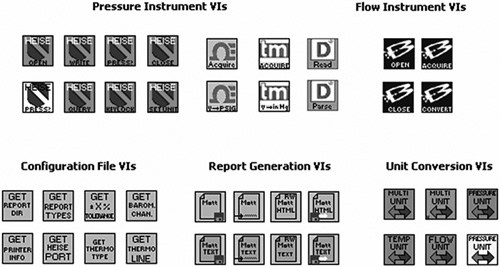
If you have a collection of VIs that work together to perform a specific task, such as data logging or instrument control, choose an icon convention that associates those VIs. One simple approach is to choose a common background color, glyph, and font, and vary the text to signify the unique meaning of each VI. For example, Figure 5-4 contains several sets of VIs, each with its own icon convention. The pressure and flow instrument icons contain a glyph of the manufacturer’s logo for each instrument and a unique word across the bottom describing each VI. The configuration file icons contain black text on a light blue background, each containing the word “GET” across the top, followed by the name of the configuration parameter across the bottom. The report generation icons resemble a page on a brown border containing some text. The unit conversion icons contain a two-colored bidirectional arrow, with the measured parameter in capital letters across the top, and the word “UNIT” in the middle. Hence, graphics, color, and fonts are used to associate each set of related VIs, and text is used to distinguish the specific purpose of each VI.
Figure 5-4. An icon convention with unified styles for several sets of related VIs
Budget the time and effort for icon development in proportion to the intended scope of VI reuse. If you are creating a developer toolkit or instrument driver for distribution as a product or shareware, it is worthwhile to invest significant time and effort to create a well-conceived icon convention. If you are developing a very large application with several hundred subVIs, a tight deadline, and no specific plans for reuse, you might need to apply the most expedient method possible for creating unique and meaningful icons. Icon shortcuts are discussed next.
5.1.2 Icon Shortcuts
Creating really cute icons from scratch is an art. However, some developers are not artistically inclined. Also, an artist’s creativity can be compromised by deadlines and time constraints. Realistically, it is impractical to create an imaginative new icon for every VI within a large application. Shortcuts are essential. The following rules help to minimize icon development time, while ensuring meaningful and effective icons.
Rule 5.11
![]()
Use textual foreground, colored background, and a black border for fastest results
Rule 5.12
![]()
Contrast the text and background colors
Rule 5.13
![]()
Choose a color convention for the type of VI
From my experience, the fastest way to create a unique and meaningful icon for every VI is to create icons that consist of a text-based foreground, a colored background, and a black border. In other words, eliminate the glyph. Choose text and background colors that provide sufficient contrast, such as black or dark text on a white or light background, or vice versa. Choose the background color to designate the type of VI, via color code convention. In the Icon Editor, start with a new VI containing a default icon, select the desired background color, and double-click the Filled Rectangle tool, as shown in Figure 5-5. Note that black should already be selected as the default foreground color, unless you have changed it. This operation effectively replaces the default icon contents with an empty icon filled with the background color and bounded with a black border. This is how I begin most of my icons. Type the VI’s name or a succinct description using 8- or 10-point small fonts. I find that this technique minimizes the required imagination, time, and effort. If you can name the VI, then you can create an icon containing its name or a meaningful subset of characters abbreviating the name. Later, when your application is nearing completion, you can return to them and enhance the icons, if desired. If you run out of time and cannot return to it, as we often do, then you can rest assured that you have satisfied the requirements that unique and meaningful icons were created via text, and related VIs are unified via the background color.
Figure 5-5. The top illustration is a new VI containing a default icon. Select the desired background color and double-click the Filled Rectangle tool to initiate an icon with a colored background and black border.

Rule 5.14
![]()
Create an icon template for related VIs
Rule 5.15
![]()
Reuse one glyph, color scheme, and font for related VIs
Commercial developer tools such as instrument drivers and toolkits demand a professional-grade icon convention. Create a project library or VI template containing a standard icon for use throughout the toolkit. For a project library, simply edit the library’s default icon, and the icon is automatically applied to all new VIs in the library. For a template, create a VI containing the desired default icon, connector, controls, and indicators, and save it with the VIT extension. Create one glyph that depicts the type of operations that the VIs are used for, and leave room for a line of text across the top. Create each new VI from the library or template, and edit only the text portion of each icon. This way, you invest your time on only one glyph, and you maximize the return by applying it to all related VIs. Additionally, note that instrument drivers have some conventions already established for icons and connectors. Refer to the NI Instrument Driver Development Guidelines2 document for more information.
Figure 5-6A contains the icon of the VI template used for a commercial developer toolkit that controls a semiconductor wafer probe system. It consists of a glyph of a probe tip contacting a semiconductor device, and some text containing an acronym for the product manufacturer and model across the top. This icon required a significant amount of time, effort, and creativity to create. As shown in the VI Tree in Figure 5-6B, all VIs in the toolkit contain the same icon convention, based on the template. Hence, only one creative icon design was developed, and the resulting template is reused throughout the toolkit. This example is revisited in Section 5.3, “Examples.”
Figure 5-6A. The icon template for the Suss Interface Toolkit contains a glyph of a probe tip contacting a semiconductor device, and an acronym describing the instrument manufacturer and model.
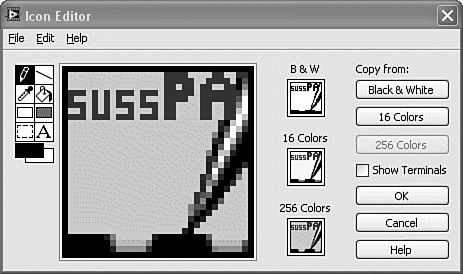
Figure 5-6B. All VIs contained in the toolkit are based on the template, as shown in the VI tree.

Within legal limits, copy your graphics instead of drawing them from scratch. Copy and paste portions of other LabVIEW icons, or import images from a variety of applications and image files. When you copy portions of other icons, make your icons distinctively different so that your subVIs are not confused with the standard VIs in LabVIEW’s vi.lib folder. For example, the OpenG File Tools contain icons that resemble LabVIEW’s File I/O palette, as shown in Figure 5-7. These icons are formed by simply copying the images from the related LabVIEW functions. However, the OpenG File Tools are shaded green, for a distinctively different appearance. As another example, when I create file logging VIs, I like to copy and paste the floppy disk and pencil symbols that appear on other VIs and functions in the File I/O palette, as shown in Save Scan VI in Figure 5-8. The text, background color, and border help distinguish my VI from the LabVIEW shipping VIs.
Figure 5-7. The OpenG File Tools palette contains icons that resemble functions from the LabVIEW File I/O palette. The OpenG icons are shaded green, to distinguish them from the LabVIEW functions.
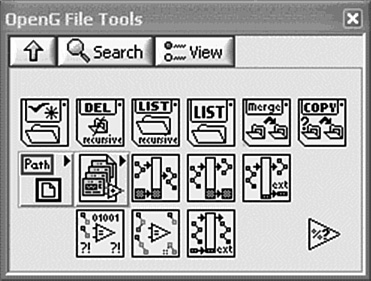
Figure 5-8. The floppy disk and pencil graphics are copied from an Express VI on the File I/O palette. The background color and text are customized, for distinction.

Many free icon galleries are available on the Web. Most web browsers allow you to copy or save the graphics right out of a web page. Using Microsoft Internet Explorer, simply right-click on a graphic and choose Copy. Then open the icon editor in LabVIEW and paste the image from the clipboard onto the icon. Alternatively, drag and drop the graphic from the web browser to the icon in the upper-right corner of the target VI’s front panel window. If you need to rescale the image to fit into the 32×32 pixel area, first save the image to file using a drawing application such as Microsoft Paint. Scale or edit the image within the drawing application, save the modified image file, and then import the image onto the clipboard for use in LabVIEW’s icon editor using Edit»Import Picture to Clipboard. LabVIEW supports several standard graphic formats, including bitmaps (BMP), JPEG (JPG), Portable Networks Graphics (PNG), Multi-Image Network Graphics (MNG), and Graphics Interchange Format (GIF). Additionally, you can drag and drop the image file from Microsoft Explorer into the icon on the front panel window. Using the latter method, LabVIEW automatically resizes the image as necessary to fit the 32×32 pixel area. Finally, note that the NI Developer Zone provides an online icon art glossary3. The corresponding glyphs are already sized appropriately for a LabVIEW icon.
5.1.3 International Icons
LabVIEW is used internationally, with localized versions available for multiple languages. Because icons are images, they appear the same, regardless of the native language of the LabVIEW development system they are loaded into. This is an important consideration if you happen to be developing VIs intended for use by developers on an international scale. This may include the software reuse library for a multinational organization or a commercial toolkit intended for international distribution. In these instances, observe the following rule:
Rule 5.17
![]()
Avoid text and graphics not universally understood on international icons
Although text alone makes for fast and easy icons, text is language specific. A glyph combined with a line of text is preferred, as long as the text and glyph are chosen to be as universal as possible. For example, all LabVIEW Plug and Play–compatible instrument drivers contain an acronym representing the instrument manufacturer and model. This is known as the instrument prefix, a universally recognized convention with roots from the VXIplug&play Consortium.
Many LabVIEW developers like to create cute glyphs describing a word or an action indirectly referencing the desired word or action. For example, an axe-wielding lumberjack or a pile of timber may be used to describe data logging, a gun may represent arming a measurement trigger, or a toilet may be used to describe the flushing of a buffer or file. Additionally, Figure 5-9 contains a fisherman that is used to represent the word cast, which indirectly references the VI’s file casting operation. All of these examples are cute and fun, but not universal. Feel free to develop such icons for your own applications, but avoid them for developer tools intended for international distribution.
Figure 5-9. A graphic of a fisherman is used to describe a file casting operation. The association between a fisherman and the term cast exists only in the English language.
5.2 Connector Pane
The connector pane is the subVI’s wiring terminal interface. Conventions for connector panes are presented in this section.
Rule 5.18
![]()
Choose connectors and terminal assignments that promote clear wiring and proper data flow
Judicious terminal assignments promote clear wiring and proper data flow on the diagrams of the subVI’s callers. Style rules related to wiring and data flow are presented in Chapter 4. A few of them are repeated here, for convenience.
Rule 4.11 Minimize wire bends, eliminate kinks and loops
Rule 4.12 Maintain even spacing of parallel wires
Rule 4.22 Always flow data left to right
Rule 4.23 Propagate the error cluster
We begin with some connector rules that help prevent wire clutter.
Rule 5.19
![]()
Select a pattern with extra terminals
It is common to add and remove inputs and outputs from subVIs throughout an application’s development and maintenance cycles, which necessitate changes to their terminal assignments. A change in the connector pattern is required when the number of inputs and outputs exceeds the number of available terminals. Changes to the connector pattern cause the connected wires in the callers’ diagrams to move, become misaligned with their terminals, or break altogether. Additionally, every instance of the subVI call must be manually relinked by right-clicking and selecting Relink to SubVI from the shortcut menu on each instance. These undesirable side effects can ripple throughout an application, requiring close inspection and fine adjustments to the subVI calls. However, connector pattern changes can be avoided by always selecting a pattern that contains more terminals than you will likely need, starting from the outset.
Related VIs that are commonly used together typically share some common inputs and outputs that are normally wired together. For example, data acquisition VIs must share their task and error cluster by propagating wires between the corresponding input and output terminals of each VI. Likewise, instrument control VIs share a common VISA resource name and error cluster. Wire bends are avoided if the related VIs have the same connector pattern, with the common inputs and outputs assigned to the same terminals. As we can see from Figure 5-10, the DAQmx VIs all use the 5×3×3×5 connector pattern, with the task assigned to the top left and right terminals, and the error cluster assigned to the bottom left and right terminals. In Figure 5-11, the niDMM VIs all use the 4×2×2×4 connector pattern.
Figure 5-10. Cont Acq&Graph Voltage-Int Clk VI is a LabVIEW shipping example containing several DAQmx VIs. The standard icon view is shown at the top. These VIs utilize the 5×3×3×5 connector pattern, as shown at the bottom.

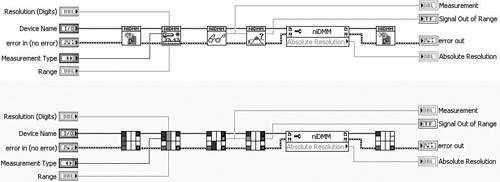
Figure 5-11. DMM Measurement VI is an example VI from the niDMM instrument driver. These VIs all utilize the 4×2×2×4 connector pattern, as shown at the bottom.
We can take the unified pattern rule one step further and standardize on the same pattern for most VIs we create, regardless of their purpose and association. If all of our VIs have similar connector patterns and terminal assignments to the maximum extent possible, the benefit to our diagrams is maximized. As of LabVIEW version 8.2, 4×2×2×4 is the default pattern applied to new VIs. I recommend this pattern because it promotes better modularity and neater diagrams than patterns with more terminals, while providing ample room for expansion compared to patterns with fewer terminals. If you need more than 12 connector terminals, you are probably performing too many tasks within one subVI, or you may need to modularize some of your wires with a cluster. As an example, Find Screw Ends VI from Figure 5-1 uses the 4×2×2×4 pattern. It propagates an array of cluster named Line Endpoints and returns a cluster named Edge Point, in addition to six other inputs and outputs. These parameters occupy a total of 9 of the 12 terminals, leaving 3 spares. As seen in Figure 5-10, the DAQmx VIs use the 5×3×3×5 pattern, although the VIs in the example use no more than 11 of the 16 available terminals. The DAQmx VIs are polymorphic and are designed to support a very wide variety of hardware and applications. Indeed, some configurations of the DAQmx VIs exceed the 12 terminals available from the 4×2×2×4 pattern, and future expandability is critical.
There will always be exceptions to the 4×2×2×4 rule. However, you can save at least 1 minute on every VI you create and improve the neatness and ease of maintenance of all of your VIs if you start with a template containing the 4×2×2×4 pattern and a few common terminal assignments, such as error clusters. LabVIEW has a SubVI with Error Handling template that meets this criteria. It may be selected from the New dialog by choosing File»New…»VI»From Template»Frameworks.
Rule 5.22
![]()
Assign controls to left terminals, indicators to right terminals
Rule 5.23
![]()
Never cross wire stubs in the Context Help window
The terminal assignments of the connector pane must promote left-to-right data flow, without wire bends and crossovers. Therefore, controls must be assigned to terminals on the left and indicators to terminals on the right. Otherwise, input wires flowing in from the left will cross output wires flowing out to the right. The middle terminals may be assigned to controls or indicators, as long as they are not intermixed, causing crossovers. To check your terminal assignments for crossovers, inspect the wire stubs in the Context Help window.
The example VI in Figure 5-12A uses a densely populated 5×3×3×5 connector pattern to receive and return multiple arrays. The input arrays are set points for FieldPoint analog output modules, and the output arrays are measurements from analog input modules. One of the array inputs is assigned to the top middle right terminal, while two of the array output terminals are assigned to the top middle left terminals, causing crossovers to appear in the Context Help window. These assignments may have been careless mistakes by the developer or a conscious decision to avoid terminal reassignments when adding new inputs or outputs. Indeed, each instance of this VI would require rewiring within the caller’s diagram if the connector pattern is changed or the terminals are reassigned. In Figure 5-12B, the terminals are reassigned with the inputs on the left and outputs on the right, and no crossovers in the Context Help window. In Figure 5-12C, the input arrays are all assigned to the left side and bottom middle terminals, and the output arrays are all assigned to the top middle and right side terminals. Figures 5-12B and 5-12C are equivalent methods of eliminating crossovers. However, the dense population of the 5×3×3×5 connector pattern limits expandability and maintainability while promoting wire clutter. In Figure 5-12D, the input and output arrays have each been combined into clusters, reducing the required number of terminals while increasing expandability and maintainability. Additional arrays can simply be added to the clusters without adding or rearranging terminals. Also, the connector pattern is reduced to the preferred 4×2×2×4 pattern.
Figure 5-12A. This VI uses the 5×3×3×5 connector pattern. The Context Help window reveals wire stub crossovers.

Figure 5-12B. Connector assignments with middle terminals divided, with controls on the left and indicators on the right and no crossovers

Figure 5-12C. Connector assignment with controls assigned to bottom middle terminals and indicators assigned to top middle terminals, and no crossovers
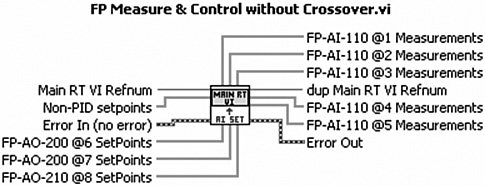
Figure 5-12D. Input arrays of set points and output arrays of measurements have been combined into clusters, and the 4×2×2×4 pattern has been applied. The number of assigned terminals is greatly reduced, decreasing wire clutter on the calling VI diagrams.
Rule 5.25
![]()
Assign error clusters to bottom left and right terminals
Rule 5.26
![]()
Assign references and I/O names to top left and right terminals
It is a long-standing convention that error clusters are always assigned to the bottom left and right terminals, and references and I/O names are always assigned to top left and right terminals. References and I/O names include file refnum, DAQmx task and channel names, VISA resource name, VI Server application and VI references, control references, and similar items. The remaining controls and indicators may be assigned to the remaining terminals, in the same respective locations as the object positions on the front panel. Therefore, the terminal assignments should resemble the front panel layout. Recall that panel layout rules were provided in Section 3.2, “Text.”
Consistent placement of controls and indicators on the subVI panels, and consistent connector terminal assignments improve the recognition and ease of use of subVIs throughout your applications. Additionally, assigning common controls to consistent terminals of a standard connector pattern ensures that the terminals will line up properly and can be wired together without wire bends. In the FieldPoint measurement and control example VIs from Figure 5-12, note that the refnums are appropriately assigned to the upper left and right terminals, and the error clusters are assigned to the lower left and right terminals.
Rule 5.27
![]()
Choose left and right vertical edge connector terminals for high priority inputs and outputs
Rule 5.28
![]()
Choose top and bottom horizontal edge connector terminals for lower priority inputs and outputs
Be sure to prioritize your terminals appropriately. Priority can be specified explicitly using the required, recommended, and optional priority settings from the context menu, and implicitly using the locations of the terminal assignments. The most commonly used inputs and outputs are normally assigned to terminals on the left and right vertical edges of the connector pane, and the less commonly used inputs and outputs are on the top and bottom horizontal sides. The front panel layout should reflect these priorities, as was described in Chapter 3, “Front Panel Style.”
Rule 5.29
![]()
Specify required priority for critical inputs and outputs
Rule 5.30
![]()
Specify optional priority for inputs and outputs that are normally not used
If a subVI performs file I/O, data acquisition, or instrument control with a resource that was opened prior to the subVI call, a valid reference, task, or resource name is required or the subVI cannot operate properly. Specify required priority for any critical terminals that the subVI cannot run without, such as reference inputs. Additionally, specify optional priority for any inputs or outputs that are normally not used because the default values are generally acceptable. This way, the user can quickly identify the important terminals by the bold appearance of the labels in the Context Help window. However, do not set priorities unless they are really warranted. Leave the default recommended priority for most terminals.
Figure 5-13 shows the Context Help window containing Find Screw Ends VI. Original Image in and Grayscale Image in are references to images that are required for the VI to run properly. The corresponding terminal labels are boldface, indicating that the priority of these two terminals is required. All other terminals are recommended. All input terminals on the left side are propagated through the subVI’s diagram to corresponding output terminals on the right side. This provides consistency as well as symmetry. The Edge Point is an important output but is assigned to a bottom middle terminal, to allow consistent assignment of common terminals among related VIs.
Figure 5-13. Context Help window for Find Screw Ends VI indicates required priorities for Original Image in and Grayscale Image in, and recommended priority for all other terminals.

Note that many subVIs have an input for the index of looping structures. These subVIs may initialize or reset a resource or variable upon the first iteration of the loop (iteration = 0). Because the index terminal is normally at the bottom left corner of a looping structure, assigning the control to a bottom middle terminal helps minimize wire bends and overlaps.
5.3 Examples
This section contains examples of icons and connectors, including some that highlight, reinforce, and extend the syle rules from the prior sections, as well as a few exceptions to the rules. Some are quite clever, while a few are downright obnoxious. We begin with the latter.
5.3.1 Obnoxious Examples
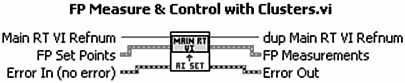
Figure 5-14A contains the icon, terminals, and connector assignments for SubVI from Selection VI, previously discussed in Chapters 3 and 4. A subVI from selection is created automatically by selecting an area of a diagram and choosing Edit»Create SubVI. They are characterized by LabVIEW’s default icon, unconventional front panel layout, counterintuitive control and indicator labels, and sloppy wiring on the diagram. As discussed in the previous chapters, these VIs never conform to good programming style without significant cleanup. Specifically, the terminal labels in Figure 5-14A are inappropriate, including task ID out, task ID out 2, error out 2, and output chunk. Input terminals should not contain the word out, and duplicate terminal labels should not be distinguished using numbers. Additionally, it contains the default icon assigned by LabVIEW instead of a unique and meaningful icon. Finally, it utilizes the 3×2 connector pattern, with no spare terminals. These are violations of Rules 3.21, 5.2, 5.3, 5.19, and 5.21.
Figure 5-14A. SubVI from Selection VI violates multiple style rules, including default icon and counterintuitive terminal labels.
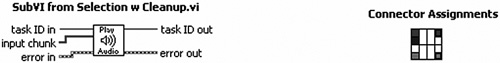
SubVI from Selection w Cleanup VI, shown in Figure 5-14B, is an improved revision of the VI. The duplicate terminal labels are distinguished using the suffix in for the inputs and out for the outputs. The input array label has the prefix input instead of output. The VI has a unique and meaningful icon that depicts what the VI actually does. It utilizes the standard 4×2×2×4 connector pattern, with plenty of spare terminals available for future expansion.
Figure 5-14B. SubVI from Selection w Cleanup VI contains a meaningful icon, intuitive terminal labels, and the standard 4×2×2×4 connector pattern.
On more than one occasion, I have seen source code in which the developer creates icons by drawing the text freehand instead of using the Icon Editor’s text tool. Figures 5-15 and 5-16 are two such examples. Figure 5-15A is a subVI extracted from the Haphazard VI from Chapter 4. We can see that it also contains an output assigned to a terminal on the left, and the data acquisition task reference has been bundled with the error cluster into one input. These elements are unrelated and should not be bundled together. Figure 5-15B is a revision containing an improved icon, connector pattern, and terminal assignments. The icon utilizes 8-point small fonts for the complete words DIGITAL INPUTS and a glyph of a pair of glasses copied from the DAQmx Read VI. The standard 4×2×2×4 connector pattern has been applied, with the DAQmx Task passed through the top left and right terminals.
Figure 5-15A. Icon contains text drawn freehand, and connector assignments are unconventional.
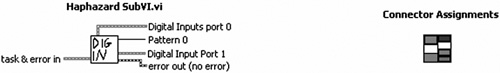
Figure 5-15B. The subVI icon has been improved using 8-point small fonts and a glyph of a pair of glasses. The DAQmx task passes through the top left and right terminals of the 4×2×2×4 connector pattern.

Figure 5-16A is a VI icon containing a custom font that the engineering staff at Bloomy Controls affectionately refers to as Bob’s Bold, after its creator, Bob Hamburger. Bob is a highly regarded Business Development Manager at Bloomy Controls who also developed the Find Screw Ends VI icon in Figure 5-4, which exemplifies good style. I would like to thank Bob for contributing his greatest as well as his most obnoxious icons for public display. The characters of Bob’s Bold are so big and bold that the icons in an application appear to be shouting at you, as seen in Figure 5-16B. Bob’s Bold is a great way to get your point across, but it should be used sparingly, to keep your diagram’s decibel level within legal limits.
Figure 5-16A. This icon illustrates Bob’s bold font.

Figure 5-16B. Bob’s bold font on several icons in a diagram section appears to shout.
5.3.2 Instrument Drivers
This section contains examples of icons and connectors corresponding to instrument drivers. The NI Instrument Driver Guidelines2 covers comprehensive requirements for the development of LabVIEW Plug and Play–compatible instrument drivers. Most of the Plug and Play requirements are consistent with the rules presented in this chapter, as well as throughout this book, with a few minor exceptions that are noted where they appear.
Figure 5-17A shows the Initialization VI for a fictitious medical instrument, the PM-1000. The icon consists of three lines of text and a glyph of a bedridden patient on a plain white background. The glyph is cute, but the icon is a bit too text heavy, giving it a complicated appearance. The connector uses the 5×3×3×5 connector pattern, and 12 of the 16 terminals are assigned to controls and indicators with recommended priority. If all 12 of these terminals are wired on the caller’s diagram, it will appear cluttered.
Figure 5-17A. Instrument driver VI for a fictitious medical instrument has a text-heavy icon and too many terminals.

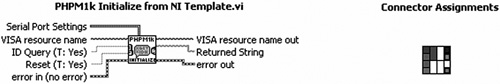
Closer inspection of the icon’s text reveals that all 14 characters on the first two lines are dedicated to identifying the instrument’s manufacturer and model. This can be improved. There exists a long-established convention, originating from the VXIplug&play consortium, for which a very succinct instrument prefix is used to represent the instrument’s manufacturer and model number. The first two or three characters of the prefix identify the manufacturer, and the following four or five characters identify the instrument model or family. The resulting six- to eight-character acronym is used in the VI or library name and appears as a banner across the top of the icons throughout the driver. Additionally, five of the connector terminals correspond to serial port settings, in addition to a terminal for the Serial Port. Because these five controls are closely related, we can modularize them into a cluster and reduce the required number of terminals, and also use the preferred 4×2×2×4 connector pattern. The Serial Port terminal is an I/O name, which is rightfully assigned to the top left terminal, per Rule 5.26.
In Figure 5-17B, the icon has been improved by replacing the top two lines of text with a banner containing PHPM1k as the instrument prefix. Additionally, the glyph is centered, for better visibility. The icon appears clear and simple as a result of these changes. Also, five serial port settings have been modularized into a cluster, and the 4×2×2×4 connector pattern is applied. The ID Query and Reset controls have been assigned to the middle terminals of the icon, which implies a slightly lower priority than the Serial Port Settings and other input terminals on the left border.
Figure 5-17B. The VI has been improved with a banner containing the instrument prefix, a centered glyph, cluster input, and fewer terminals.
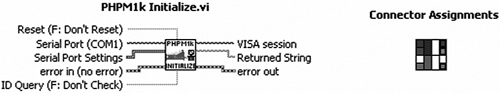
Figure 5-17C contains the icon and connector assignments for the Initialize VI from the instrument driver template. This VI is generated automatically by the Create New Instrument Driver Project utility that is selected from Tools»Instrumentation»Create Instrument Driver Project. The Reset and ID Query controls are assigned to terminals on the left border of the connector, and the Serial Port Settings cluster is assigned to the top middle terminal. These assignments are equivalent but more consistent with instrument driver standards than Figure 5-17B. The icon contains a standard glyph that the wizard applies to all Initialize VIs. The standard glyph helps to improve the recognition of common instrument driver VIs using graphics in addition to text. Also, the standard glyph reduces icon editing effort because it is created automatically by the utility. However, the standard glyph reduces the association of the VI with the specific instrument, as well as the association of the VIs that comprise the instrument driver. Instead, the banner is the only means by which the instrument is identified. Hence, a tradeoff exists between recognizing common function types using the function-specific glyphs and recognizing the instrument using a common instrument-specific glyph. The NI guidelines recommend the former, whereas I generally prefer the latter.
Figure 5-17C. The icon and connector of the Initialize VI generated automatically using the Create New Instrument Driver Project utility. The utility uses a template to create a standard glyph, connector assignments, and terminal labels.
Before embracing the PHPM1k Initialize VI revisions in Figures 5-17B and 5-17C, there are a few considerations. Depending on the application’s data structures, the callers may now have to perform a bundle operation to program the serial parameters. A tradeoff exists between reducing wire clutter and adding cluster operations to the caller’s diagram. According to the NI Instrument Driver Development Guidelines, passing cluster information between VIs increases the complexity of the calling application. However, my recommendation is to use consistent style for the instrument driver VIs, as for their calling applications. Specifically, I recommend using clusters if the data elements are closely related and are likely to be used together in more than one place. Also, judicious use of clusters in an instrument driver promotes good data structures throughout the calling applications. For example, the user of the revised VI may now be inclined to use the same Serial Port Settings cluster to pass this data among other VIs in the call chain. Data types and structures are discussed in greater detail in Chapter 6, “Data Structures.”
Figure 5-18 contains three versions of the Functions palette for the Suss Interface Toolkit for LabVIEW, as well as the icon for DoProberCommand VI. This instrument driver, previously introduced in Section 5.1.2, “Icon Shortcuts,” controls a semiconductor wafer probing system. The icon convention in Figure 5-18A consists of a banner containing the instrument prefix SussPA and a demonstrative glyph of a probe tip contacting a semiconductor device. The bright yellow background clearly distinguishes these icons on the caller application’s diagrams. The palette contains submenu icons that use the same convention but have a darker shade of yellow, to distinguish them from VI icons and to enhance the three-dimensional appearance. These icons have the professional look and feel required for a commercial toolkit. The glyph was created by first envisioning a symbol that best represents wafer probing, searching to see if that symbol can be copied from a public archive, and then laboriously editing that graphic for best appearance on a 32×32–pixel icon. It is important to note that the same glyph appears on the icons of all VIs of the toolkit, and the toolkit is a commercial product. Therefore, a high-quality icon convention is required, and it is worthwhile to invest the necessary time and effort.
Figure 5-18A. The Functions palette for the Suss Interface Toolkit for LabVIEW, a commercial product that controls a semiconductor wafer probe system. All icons share a common glyph describing the instrument. DoProberCmd VI is a subVI from the Action/Status subpalette containing an artful silhouette of a runner and common glyph.

DoProberCmd VI is one of the VIs from the Action/Status palette. The icon in Figure 5-18A contains the palette’s icon convention, with the addition of an artful silhouette of a runner. The VI name and the icon could more closely resemble each other. Why not name it SussPARunProberCmd VI? Alternatively, the runner could be replaced with the word “Do.” Moreover, the toolkit is intended for international use, and the glyph of a runner is not a universal symbol for the VI’s primary purpose of executing a command. Finally, note that Registration In and Command are input terminals with required priority.
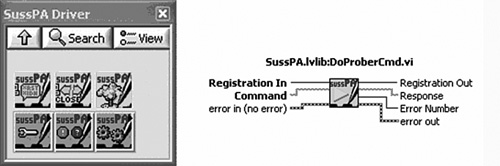
Figure 5-18B contains the palette of a similar instrument driver developed from the LabVIEW instrument driver template, using the Create New Instrument Driver Project utility. It contains standard glyphs for common functions and subpalettes, in place of the instrument-specific glyph. The banner is the only feature identifying the instrument on the icon. Consequently, the palette appears rather generic, with no direct association to wafer probing. DoProberCmd VI contains the green sideways triangle glyph commonly used to indicate Run, Start, or Initiate. This glyph is more appropriate than the runner in Figure 5-18A for describing the execute command function, but the association with wafer probing remains weak.
Figure 5-18B. An alternate icon convention consists of the standard glyphs from the instrument driver template. The icon for DoProberCmd VI contains a sideways triangle, a standard glyph for Run, Start, and Initiate. This convention weakens the association with the wafer prober.
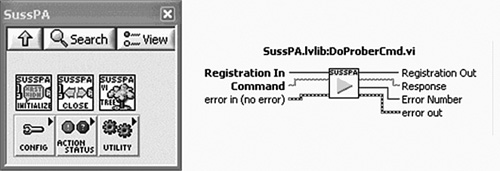
Figure 5-18C merges the standard glyphs from the instrument driver template with the custom icon convention for the prober into a new icon convention that provides the best of both worlds. The wafer prober glyph provides direct association with the instrument type. The template glyphs reinforce the consistency with LabVIEW Plug and Play standards and reduce the dependence on text. The resulting driver is intuitive and fully conforms to LabVIEW Plug and Play standards.
Figure 5-18C. The standard glyphs from the instrument driver template are merged with the instrument-specific glyphs to maintain strong association to both the wafer prober and instrument driver icon conventions.
Unfortunately, it is not always possible to merge multiple glyphs and a banner on a single icon that is only 32×32 pixels. In fact, it can be very tedious to attempt to do so. If your icons contain a banner with the instrument prefix, a color convention, and a reasonable balance between glyphs and text, and if all of the required VIs and palettes are organized according to the NI guidelines, the driver should satisfy the icon requirements for a LabVIEW Plug and Play instrument driver. It is more important for your VIs to be intuitive and strongly associated with the instrument than it is to share the same glyphs as the template. The users of your instrument driver can also identify the VIs based on the VI names and locations on the palette.
5.3.3 Miscellaneous Examples
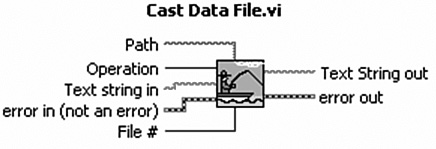
This section presents some random examples that also may be improved upon. The icon and connector from Figure 5-19A belongs to a VI that converts a data structure into a formatted string. The icon consists of a clever glyph of a telephone handset and text. I commend the developer’s creativity, or her ability to find and copy graphics, whichever the case may be. The connector, however, can use a few improvements. First, the labels of the control and indicator assigned to the input and output terminals are too long. In fact, the full labels Communication Parameters Cluster and Communication Parameters String have been cut off by the Context Help window. The words Cluster and String are not necessary because the data types are identified by the design and color of the wire stubs provided by the terminals on the caller’s diagram, and appearing in the Context Help window. Also, the terms Com and Params are commonly used abbreviations for Communications and Parameters, respectively. However, controls and indicators should always have unique names; otherwise, Property Nodes and local variables that are created for them may appear ambiguous.
Figure 5-19A. The lengthy terminal labels of Form Com Params Cluster Into a String VI are truncated by the Context Help window.
![]()
In Figure 5-19B, abbreviated terminal labels are applied, along with the suffixes in and out for the control and indicator, respectively. The corresponding terminal labels are succinct, intuitive, and unambiguous. As discussed in Chapter 3, succinct and intuitive labels are very important. However, I am not an advocate of abbreviations and acronyms unless they are either universally familiar or extremely intuitive, as they are in this case. Additionally, error terminals have been added to promote proper data flow.
Figure 5-19B. The label lengths have been reduced, and error terminals have been applied to promote proper data flow.

The example shown in Figure 5-20 is the DAQ Assistant Express VI icon and connector assignments, with View as Icon selected from the shortcut menu. This particular configuration generates inputs assigned to terminals on the right instead of the left. This causes wire crossovers in the Context Help window, and promotes wire crossovers in the diagrams of the calling VIs.
Figure 5-20. DAQ Assistant Express VI has inputs assigned to terminals on the right, causing wire crossovers on the calling VI diagrams.

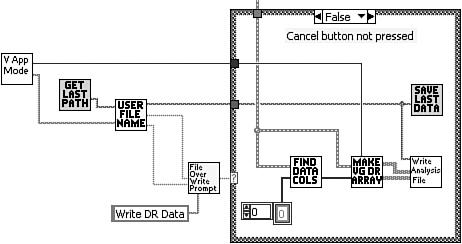
Figure 5-21A shows the icon and connector of Confirm Quit VI. The icon contains a familiar Windows system symbol that accompanies various confirmation dialogs. The glyph appears big, bold, and unmistakable. However, it does not indicate the specific type of confirmation. It contains only one output assigned to the middle terminal of the 3×3 connector pattern. In Figure 5-21B, the Confirm Quit dialog is revised with error clusters, a 4×2×2×4 connector pattern, and an icon combining text with the graphic. The type of confirmation is specified on the icon by reducing the glyph size and adding the word QUIT? using 9-point small fonts. Error cluster terminals have been added to facilitate execution ordering via data flow. The 4×2×2×4 connector pattern allows the input and output terminals to line up with VIs utilizing this standard connector pattern. In the future, the VI could be enhanced to handle more than one type of confirmation, by adding an enumerated control to specify the confirmation type and changing the icon text as appropriate.
Figure 5-21A. Confirm Quit VI has a simple graphic that has been copied from a Windows system prompt. The type of confirmation is not identified by the icon.
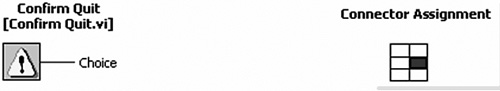
Figure 5-21B. The icon has been modified to indicate the type of confirmation. The standard 4×2×2×4 connector pattern has been applied, as well as the assignment of error terminals to facilitate execution ordering.

5.3.4 Clever Examples
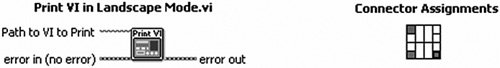
Print VI in Landscape Mode VI, shown in Figure 5-22, is composed of three-quarters graphic and one-quarter text. The graphic consists of a rectangular control panel that represents a GUI panel. A single line of text in 10-point small font simply reads Print VI. The VI uses the default 4×2×2×4 pattern with the appropriate assignments. It is neat and effective, and looks great in color.
Figure 5-22. Print VI in Landscape Mode VI is composed of three-quarters demonstrative graphic and one-quarter text.
Dynamic VI Path Builder VI, shown in Figure 5-23, contains an attractive icon that is two-thirds graphic and one-third text. The graphic depicts a fork in a yellow road, with both roads leading through green grass into an aqua blue horizon. Again, you probably need to see the full-color version to appreciate it. The VI is used to build a file path. Beware that the relationship between a graphic of a foot path and a file path is language sensitive. The 3×3 connector pattern is used to center the single input and single output terminals. However, a standard 4×2×2×4 connector pattern with error terminals should be used for consistency and proper subVI error handling. SubVI error handling is discussed in Chapter 7, “Error Handling.”
Figure 5-23. Dynamic VI Path Builder VI is composed of two-thirds demonstrative graphic and one-third text.

The next two examples utilize some special effects to achieve unique sizes and shapes. This is accomplished by erasing the default border and drawing a new border in the desired shape of the icon. LabVIEW uses the outermost nonwhite pixels to define the icon’s border. It is important to note that all controls and indicators designed to pass data into and out of the subVI must be assigned to connector terminals that reside within the icon’s border. All terminals outside the border are not visible on the calling VI diagrams. Select the connector pattern that provides the desired terminal configuration within the icon’s border. From the icon editor, select Show Terminals to display the terminal partitions along with the icon image, and design the icon to fit the desired terminal locations.
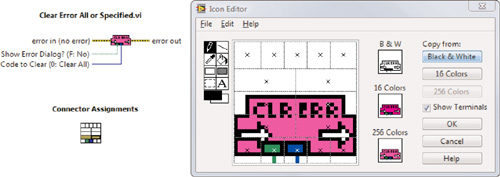
In Figure 5-24, Clear Error All or Specified VI uses a custom border and the 5×3×3×5 connector pattern rotated 90 degrees. This pattern provides nine terminals within the icon’s border, four of which are assigned. The connector pattern is rotated by selecting Rotate 90 Degrees from the connector’s shortcut menu. This VI’s function is discussed in Chapter 7.
Figure 5-24. Clear Error All or Specified VI has a custom border providing a unique shape, and a 5×3×3×5 connector pattern rotated 90 degrees.
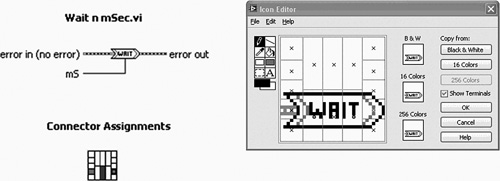
The VI in Figure 5-25 also has a unique shape formed by a custom border. Its purpose is to incorporate an in-line delay using data flow instead of a Sequence structure. Recall that good block diagram style involves using data flow over Sequence structures and variables. Wait n mSec VI promotes good style. Its small size allows it to be seamlessly inserted between the VIs of a dataflow sequence, while allowing other wires to be connected among the input and output terminals without bends. The connector pattern is 5×3×3×5, with three terminals assigned.
Figure 5-25. Wait n mSec VI has a custom border and promotes good data flow style. It has a 5×3×3×5 connector pattern with three terminals assigned.
Endnotes
1 Color versions of the example illustrations in Chapter 5 can be freely downloaded from the Publisher’s website page for this book at www.informit.com/title/9780131458352. For full-color illustrations, the electronic (eBook) version of The LabVIEW Style Book is available for purchase from www.informit.com/title/9780132414814.
2 NI Instrument Driver Guidelines, online tutorial available from the NI Developer Zone. The URL is www.ni.com/devzone/idnet/library/instrument_driver_guidelines.htm.
3 An icon art glossary is available from the NI Developer Zone at www.ni.com/devzone/idnet/library/icon_art_glossary.htm.