Explore

3.1 Welcome to Explore
Welcome to Explore. You’ve pitched your idea and it has been approved for further exploration. The main goal of Explore is to obtain evidence that your customers have a real need or problem. You will now get out of the office and speak to customers to test your assumptions. At this stage you do not yet need a large team. All you need is a small team with sufficient knowledge around the market and customers (e.g. a product manager, a UX (user experience) expert or designer, with some support from sales). The Explore stage can be split into the following phases:
- Validate problem: This phase focuses on customer needs and jobs to be done. Do customers have the need? How are customers currently solving their problems? Are the problems currently serious enough for them to pay for a solution?
- Value proposition: After validating customer needs, we can start testing our ideas for a solution. We can begin by creating experiments that present potential solutions to customers (e.g. landing pages). At this stage, we are not creating our product yet, we are simply testing our ideas for solutions and value propositions.
- Market opportunity: When we validate customer needs, we will know the type of customer and market we want to pursue. As such, during Explore we will do more detailed research on the size of the total available market and whether that market is financially viable.
- Prepare for validate: At the end of Explore, you will have confirmed customer needs and also tested some ideas for a solution. In Validate, you will begin working out how you can create a solution to sell and test the rest of your business model. So you need to define the budget for building a minimum solution and its various iterations, market it to customers and support them through their experience.
3.2 Running experiments
A key part of lean thinking is the use of evidence to make decisions. For many, innovation and product development are about the pursuit of a vision. Given the failure rates of startups and new product launches, the idea of vision alone leading to success seems more of an illusion than anything else. There is nothing wrong with chasing big audacious goals. However, our passion for our ideas must be tempered with a keen interest in reality (i.e. testing our assumptions).
To test our assumptions, we need to adopt the scientific method and apply it to innovation. The idea of science conjures up images of men and women in white coats working in a lab. However, science is merely a set of tools and methods. When we test our ideas, we are not merely collecting evidence and data. We are trying to use the evidence as a basis of learning and decision making.
Science is a hypothesis driven methodology. We cannot use the data we collect to learn and make decisions, unless we first make explicit our expectations. As such, we must turn the assumptions we identified during Idea into testable hypotheses. The best way to create hypotheses is to set minimum success criteria for our experiments. These criteria benchmark what would have to happen for us to reach the conclusion that the evidence supports our assumptions. With clear hypotheses in place, any data we collect can then be benchmarked against our criteria. This makes it easy for us to learn, make decisions and track progress.
It is also important to note that minimum success criteria cannot be developed in a vacuum. Such criteria are connected to a specific test or experiment. So, the first thing we have to do for each assumption we have is brainstorm some experiments. After we have chosen a specific experiment to run, then we can set the minimum fail criteria for that experiment. Only after this process are we now ready to get out of the building and start testing our assumptions.
3.3 Tracking progress and managing our experiments
When we run our experiments, we need a tool to track the progress of the work we are doing. Tracking progress happens at the level of a single experiment we are running, and also across experiments to see how well we are doing at reducing the number of assumptions in our value proposition or business model. For the Lean PLC, we have adopted the Experiment Canvas.16
After we have mapped out the experiment, we are now ready to get out of the building and test our assumptions. After we have finished running the experiment, we then have to analyse the data we have collected and make decisions.
| 6. | Results: At this point, we analyse and tally what we found? For example, how many people choose one option versus another? |
| 7. | Learnings: Now that we have tallied our data, what did we learn? How does the data match up to our minimum success criteria? What unexpected things did we learn when we were out of the building? |
| 8. | Decision: We are now ready to make a decision. What do you do now that the experiment is a success/failure? Do we want to pivot, persevere or stop? We also have the option to run other experiments using a different method or cohort in order to further test our assumption. |
 Tips
Tips
The key is to work as a team when designing experiments and setting minimum success criteria. The team must also come together to review the data, learn lessons and make decisions.
- Always start with your riskiest assumption. Don’t try to avoid it!
- Use tools to track every experiment and its results. This way you can always track the decisions you are making as you go.
- If your first experiment doesn’t work, you can redesign it and try again.
- It is a judgement call, but sometimes you have to know when to stop. For example, when you begin to hear the same things from customers, stop!

3.4 Earlyvangelists17
An important question for running experiments concerns who should be recruited as participants. There are also related questions about sample size and how we know when to stop running an experiment. First, experiments during the Explore stage should target early adopters or earlyvangelists. Working with earlyvangelists18 has the potential to provide the greatest amount of learning because:
- they have the problem or need we are trying to solve
- they are aware that they have the problem or need
- they have been actively looking for a solution
- They have tried to put together a solution
- they have a budget to pay for a solution.
These characteristics make earlyvangelists, if we can find them, the best people to test our assumptions early in our process. Earlyvangelists are so keen for solution that they would be happy to give us feedback on early versions of our product. It is also important to note that if we find a customer segment in which any one of these five characteristics is missing, then it will be difficult for us to test customer needs and validate early versions of our solution. For example, if we find that customers have a need but they are not aware of it, we now have a marketing job on our hands, which is the opposite of the discovery we want to do during Explore.
Figure 3.2

With that in mind, we can turn to the question of how large our sample of participants should be. We do not have any specific guidance on this. It really depends on the type of research you are doing (e.g. B2C vs B2B). Our sense is that experiments with earlyvangelists should provide strong signals. As such, a small sample of 10–15 participants should be sufficient. If you find that you are getting mixed signals, you may need to define more stricter criteria for selecting your earlyvangelists. In contrast, if you are getting a very strong and consistent signal from customers, you can stop before you reach your target sample size.
3.5 Pivot, persevere, stop
We run experiments to be able to make decisions about what to do next. We have the choice to persevere with our idea if the evidence supports our assumptions. However, sometime the data suggest that our assumptions are wrong. In that case, we don’t want to just give up on our idea. We also don’t want to keep going by simply ignoring the evidence. We can make the decision to pivot. This is when we keep one foot in what we have learned, and we make some changes to our assumptions before we test them again. In The Lean Startup, Eric Ries19 described ten types of pivots that teams can make if they find that their assumptions are not supported by the evidence.
| 1. | Customer segment pivot: This is when you find out that your product solves a real problem, but for a different customer segment to what you initially assumed. |
| 2. | Customer need pivot: This is when you learn that the problem you were trying to solve for customers is not a strong enough need for them. However, during your research you discover a related problem that is truly a need for your customers. |
| 3. | Zoom in pivot: This is when, something you were thinking of as just a feature in a bigger product, becomes the whole product. |
| 4. | Zoom out pivot: This is when, what you thought of as the whole product, becomes a feature in a bigger product. |

| 5. | Platform pivot: This refers to a situation where you change our idea from just being an application to being a platform, or vice versa. |
| 6. | Business architecture pivot: This is when you change your idea from being a long margin, high volume product serving consumers (B2C) to a high margin, low volume product serving businesses (B2B), or vice versa. |
| 7. | Value chapter pivot: This is when you change the revenue model for your product. For example, you may have been thinking about having customers subscribe to your service, but after talking to customers you learn that they are much happier to make a one-time purchase. |
| 8 | Channel pivot: This is when you change your initial ideas about the sales or distribution channels you would use to reach your customers. |
| 9. | Technology pivot: This is when we learn that we can deliver value to customers using a different technology to the one that we intended to use. |
| 10. | Engine of growth pivot: In Chapter 5, we will discuss how to grow and scale our product. In that chapter, we will present the three main engines that teams can use to grow customers numbers, revenues and profits. For now, all we need to note is that we can use evidence to change our initial growth engine to a different one. |
These are some of the options that we have when we are faced with a situation where some of our assumptions are not supported by the data. We are often asked how many pivots a team should make before they stop. This is a judgement call that depends on the strength of the signal you are getting from the market and the resources you have at hand. If the resources are available you don’t want to stop too soon. However, if you are getting really strong signals that your idea will not work, then don’t waste your resources. Stop and move on to another project!
3.6 Desk research
Desk research, also known as secondary research, is a good starting point for testing our assumptions before we get out of building. The focus here is on information that already exists. Although the data may not be specific to our hypotheses, they are great for learning about the market and our customers before we meet them face-to-face. In this age of ubiquitous information, it is amazing what data are readily available for us to review and make informed decisions.
Desk research is particularly useful for testing our assumptions about the structure and size of the available market. It is also useful for discovering any trends in population, economics and technology that may impact our product or service. We can use desk research to get information on demographic trends, suppliers, distributors, competitors, brands and products. All of these data can give us a good sense of the market environment we are about to enter.
How to do it
Desk research can be viewed as a journey of discovery. You just never know what you are going to learn. At the minimum, we need to be clear about the assumptions we want to test and then set clear learning goals. When we are ready, there are several sources of secondary research we can use.
- Market research reports: Such reports can be obtained from market research and consulting companies such as CB Insights, Nielsen, Ipsos, Deloitte and McKinsey. They are usually great sources for information around key trends.
- Government statistics: Most countries have a national statistics office. Some, like the UK government, even publish their data online. These websites allow you to research industry-based topics such as energy, education, agriculture and the labour market.
- Industry experts and bodies: If you are thinking entering a specific industry with your idea, it may be useful to read any research published by experts in that industry. There are also bodies that represent the interests of companies within a particular industry. Such bodies often conduct research and have industry-based publications that can be rich sources for learning.
- Company data: This is a good way to research the viability of particular types of business. Company data can be obtained from government run agencies such as Companies House in the UK or the US Securities and Exchange Commission. These data allow you to learn about company registrations and closures, as well as their company accounts and annual returns.
- The Internet: This is also a rich source of data. For example, you can use Google Trends, Google Keyword Planner and other Google keyword research tools, to find out how often people are searching words related to your product. Social media analysis can also be useful for tracking trends on particular topics and understanding the language that customers use around their needs and jobs to be done.
Tips
- Avoid analysis-paralysis. There is so much research out there that it can be overwhelming to make sense of it all.
- One way to stop yourself from running down every rabbit hole is to make sure that you have a learning goal. This then allows you to focus on only that research that will help you with this goal.
- Use desk research as starting point. By itself, secondary data can provide good signals, but it is not conclusive. Secondary research can point you in the right direction, but you still need to get out of the building and talk to people.
3.7 Customer observation
Genchi Genbutsu is a Japanese phrase that means ‘actual place, actual thing’. It has been popularised as a principle of Toyota’s Production System.20 The principle is based on the notion that in order to understand something you have to go to the actual place and see the actual thing you are interested in. This is why the phrase is often translated into English as ‘go and see for yourself’. As some point, we have to get up from behind our desks and see how our customers live and work in their context. Customer observation allows us to gain empathy into what our customers struggle with. Such insights can then be used to inform product development.
How to do it
When you are out observing customers, you can select from a toolbox of observation methods.
- Silent observation: This form of observation is unobtrusive. It is most powerful when people don’t know you are there. Unlike chemical compounds, people tend to respond to being watched by others and may change their behaviour as a result. So as long as you are not violating privacy laws, it may be helpful to observe people silently. You can also get prior consent from individuals and organisations to do such observation.
- Conversational observation: The challenge with silent observation is that when you observe something interesting, it is difficult to find out the underlying reasons for the behaviour. This can leave us with uninformed assumptions.
To get a deeper understanding of our customers, we can have conversations with them while we are observing their behaviour. A common technique in user experience research is to have customers talk through their thinking while they are doing a task. This can help with both seeing what they do, and understanding the reasoning behind it. - A day in a life shadowing: Rather than just watch people while they complete a single task, you can ask for permission to shadow them the for a whole morning or day. This is particularly useful within work environments, where your product might be used in a variety of different situations.
- Participant observation: Observing and speaking to customers is good way to gain insights. However, to gain even deeper insights we have can participate in the tasks that our customers are trying to complete. This allows us to walk a mile in their shoes and truly understand how difficult it is to do some of the jobs they are trying to get done. So instead of just watching, try it yourself!
Rules of the game
Customer observation can be a bit like drinking from a fire hose. There is often a lot to see, hear and capture. What we conclude from what we see can also be biased by our previous expectations. In particular, innovators can have a bias towards confirming their own ideas. As such, it is important to follow a few rules of observation so that we can collect reliable data that are useful for making decisions.
- Learning goal: Always begin with a learning goal. What are you trying to learn or find out? Making this explicit at the beginning ensures that we don’t get distracted by irrelevant observations.
- Outline questions: Even if you will not be speaking to customers, you should prepare a set of questions that you will try to answer from the observation. As you see and hear things that answer your questions, you can then capture the data in the appropriate places.
- In context: Observe customers in their context. This help you to understand their jobs to be done more fully. You will get to see what happens before, during and after the task. You will also gain an understanding of the constraints that exist within the context that the jobs are being performed.
- The mundane: When observing, don’t seek to find the extraordinary. A lot of insights lie in things that seem mundane. So, capture what you see without selective bias, even the ordinary events. As long as it is related to task you are observing, such data can help you meet your learning goals.
- The outliers: At the same time, keep an eye out for the outliers. These may be people who are heavy users of your products or people who suffer from the problem you want to solve in an extreme way. Outliers can be helpful in allows us to determine how far we might have to go when creating our solution in terms of a minimum feature set.
- Find example solutions: It may be important to capture examples of the artefacts that customers currently use to solve the problem or meet the need they have. These could be competitor products or hacked up solutions. Such artefacts can be helpful when we start designing our solution.
- In pairs: Where possible, conduct your observational research in pairs. This is particularly important when conducting conversational observation. One person can interact with the customers, while the other captures the data.
- Capture and externalise: Capture all your observation within the moment they are occurring. Do not wait to do this later as you will have to rely on your memory. If you wait till later, you will forget key information. And if you have observed more than one customer, you may misattribute behaviour to the wrong person. Capture what you see with fidelity. Don’t analyse it in the moment. You can do data analysis later.
When you have finished your observation, you can then review all the information you have captured. You can use sticky notes or flashcards to organise your data. Capture each insight from your research on a separate sticky note or flashcard. Organise the cards or sticky notes on a wall or table based on themes. Use this process to identify patterns and anomalies in your data. After analysis is complete, communicate your learning to your team.
3.8 Customer interviews
We already highlighted the limits of simply observing our customers without talking to them. While we can learn a lot from watching people, it is often difficult to understand why people are making specific choices or taking specific actions. Furthermore, it is sometimes difficult to get access to observing people in their context. There may be constraints in terms of time, availability or even legal issues. In such circumstances, customer interviews are a quick and cheap way to gain access to customers and learn about their needs.
How to do it
There are several issues to consider when interviewing customers. Our goal is to get reliable data that we can use to make decisions about possible solutions.
- Choose your participants: A key discipline to have is to make sure that we don’t just talk to anyone who will talk to us. It is important to identify early adopters and speak with them. Using the five criteria for earlyvangelists, we can craft filter questions that allow us to select the right people to talk to.
- Talk to experts: Another source for useful information are experts within the area that you are exploring. Talking to experts in particularly helpful when you are thinking of solving a problem in a space in which domain or specialist knowledge is necessary.
- Use scripts: Before talking to customers, you need to be clear about what you learning goals are. On the basis of these goals you can then create an outline of the interview with questions that are aimed at testing your assumptions.
- Go off track: Even with a script, customers can often unexpected insights. Allows the interview to go off track every now and again. Capture the new insights and then return to your script.
- Get connected: At the end of every interview, ask customers whether they know other people facing similar challenges that they can introduce you to. This snowball method is a good way to find early adopters for our solution.
- Capture data: During the interview you have to capture all the data and learning that you can. One way to do this, is to ask for permission to record the interview, and then you transcribe and review the script. Another way is to do interviewing in pairs.
- Review immediately: At the end of every interview, review the notes you have taken and highlight key learnings before you move on to the next interview.
The Mom Test
Talking to customers can be a great source of insights and learnings. However, when it is not done correctly, it can also be a source of false signals and misleading information. First, people have a tendency to want to make a good impression on other people. This social need may lead them to answer questions in way that they think will please the interviewer or make them look good. Second, people may find it difficult to introspect and find the right language to communicate their feelings. Often people don’t have an opinion and may feel pressured to create one because of the interview. Finally, people are terrible at predicting what they will do in the future, even if they appear to be confident when answering your questions.
These challenges in talking to customers led Rob Fitzpatrick to write a book entitled The Mom Test.21 In the book, Rob argues that innovators should not ask customers questions that if they asked their own mum she could lie to them. Instead, they should only ask questions that is they asked their mum she would have to tell them the truth.
- Stop fishing for compliments. Don’t ask questions such as ‘We have this idea for an app, do you like it?’. Try as much as possible to not talk about your idea and instead focus on the customer and their needs. For example, you can say: ‘Talk me through the last time you had this problem’.
- Stop pitching. Don’t describe the features of your intended solution. We are not making a sales call. We are trying to learn about our customers. So instead you can ask customer to describe the biggest challenges they face when they are trying to get their jobs done.
- Don’t ask questions about the future. Questions such as ‘Would you buy this product?’ or ‘How much would you pay for this?’ are not very useful. People can’t predict what they will do in the future. If you really want to know whether people will buy something, it is better to run experiments that measure actual behaviour (see Chapter 4).
3.9 Empathy map
Now that you have been out of the building observing and talking to customer, it is time to create a picture of what we have learned. Furthermore, there could be members of our team who were not out of the building with us, who also need to develop an understanding of what we learned. A good tool for developing this picture is the empathy map. It allows teams to map what they saw customer say, do, feel and think.22
Figure 3.4

How to do it
Before you start the session, make sure that all the key members of your team are present. Developing a point of view about our customers is something that is for every member of the team not just the product developers. So, make sure a cross-functional group of people is present (e.g. sales, finance, marketing, technology and customer support). Also make sure you have the necessary tools for the session; a large empathy map, sticky notes and sharpies.
- The first step is to unpack all the research work that you did when you were out of building. Capture your main observations and key themes. Share with the teams some stories from your experiences with customers. Ask them what stands out or surprises them. Have them capture the key observations and themes from your story.
- After this, identify key segments from your customers. Which individuals share pains, gains and jobs to be done? You need to identify these segments because you will create an empathy for each one.
- Now complete an empathy for each of your customer segments. Write one insight per sticky note. What do they say, do, think and feel?
- When you are done mapping, analyse each map. What stands out to you? Are they any contradictions? Do people say one thing and do another? Why might that be? Are there any other insights from your research you can bring into the conversation?
- As you do the analysis, also look for similarities between customer segments. This may help with identifying needs that are shared by a broader group of customers.
Tips
When working on your empathy maps, here are some useful tips you can follow.
- Use sticky notes, do not write directly on the map.
- Create different maps for different customer segments. However, if you use one map, then use different-coloured sticky notes for each customer segment.
- Focus on what you learned about the customers and their needs. This is not the time to start brainstorming solutions.
- At the end of the session, make sure there is a shared understanding of the empathy maps throughout your team.
3.10 Update the circle
At this point, we need to revisit the customer profile on our value proposition canvas. Remember that all the work we have been doing so far exploring customer needs was triggered by the risky assumptions we identified when we reviewed our value proposition canvas. So, the question we need answer is whether all the lessons we are learning support our assumptions and hypotheses.
- Customer jobs, pains and gains: As team, we need to review each sticky note on our value proposition canvas. For each sticky note, we need to discuss whether what we learned from customers supports that assumption. Were we correct in making that assumption about customer jobs, pains or gains? Do we need to revise the assumption? Or should we remove it from the canvas altogether?
- New learnings: We will also have learned new things about our customers that were not part of our original canvas. These new learnings will need to be added to the canvas as well. Remember to put only one job, pain or gain per sticky note.
- Make decisions: The more we get out of the building, the more our value proposition canvas will change. At some point, we will have to make decisions. Do we know enough about customers to start thinking about solutions? Have we found meaningful customer jobs to be done? How strong are the customer pains/gains? How are they currently solving their problems or meeting their needs? Do we think customer may pay for a solution to help with their jobs to be done?
The answers to these questions will inform the decision to stop, pivot or persevere. But once we have a sense that there is a real need that we can serve, it is time to revisit the value map on our value proposition canvas.
3.11 Update the square
As our customer profile has been evolving based on customer learnings, we now need to revisit our value map. It is highly like that we will have to update our value map based on learnings. Remember that our goal is to get to problem-solution fit. This means that we need the features of our product or service to match our customer jobs to be done, pain and gains.
- Product and services, pains relievers and gain creators. Given what we now know about customer jobs, pains and gains, do we still have the right product or service in mind? Do we have the right feature set to relieve the pains or create the gains that customers want?
- Learn then confirm: Innovators have a tendency to take customers at their word. This is partly because of the confirmation bias we spoke about earlier. It is important to recognise that, even if our revised value map is based on customer learnings, our ideas about solutions are still untested. So, an important principle for all innovators to follow is to learn then confirm. In other words, talk to customers then get them to do something.
- Identify assumptions: So, after we finish revising our value map, we must resist the urge to make the leap to building a product. Instead, we have to review the map for risky assumptions. Are we confident that customers would want the solution in the way we are imagining it? Will they be willing to sign up for updates, pre-order, engage in a free-trial or make a purchase?
- Early solution testing: Believe it or not, these questions can be answered without building a product. Furthermore, the questions can be answered, not with interviews, but by running experiments that get customers to do something. We will now turn to a few examples of experiments we can run. Such early solution testing, ensures that we enter the Validate stage of the Lean PLC with clearer ideas about the solution we should be building.
3.12 The landing page
The landing page is a single web page that is used to test our value proposition. You can also use flyers and posters to run similar tests. The goal of the test is to check whether our value proposition resonates with customers. Our landing page simply says what the product does and then asks customers to perform some sort of action that registers their interest.

How to do it
- Below are some elements of good landing pages.
- Headline: At the top of the page make sure you have a clear headline of what your product is. It is good at this point to have a name for your product. Although, you can actually use the landing page to test out different product names too! A nice image on the landing page also helps, but this is not absolutely necessary.
- Value proposition: Underneath the headline, you can put a clear value proposition. This is not a description of the features of your product but a statement or promise of the value to be delivered to customers. For example, Lyft once had a landing page with a value proposition statement that simply read, ‘Make up to $35/hr driving your own car’.
- Call to action: This is the best way to gauge customer interest and intent. After seeing the headline and value proposition, you have to get them to do something. A call to action can be a button that customers can click to sign-up for updates, sign-up for a free trial, pre-order or buy the product. The conversion rates on your call to action is the real data of interest from a landing page. This shows us whether we are thinking of the right solution.
- A/B testing: A single landing page can be useful for testing your value proposition, but this process is more powerful when you test different versions of your landing page and compare the results. For example, you can randomly allocate people to see different version of the page with different value propositions or product names and see which one resonates the most.
Tips
- When describing your value proposition, focus on customer needs or jobs to be done, rather than the features of your product.
- Make sure you have a clear call to action. Also avoid having multiple calls to action as this may confuse customers and muddy your data.
- Make sure you measure the responses of the visitors your site. There is no experimentation without measurement.
- When running A/B tests, focus on one variable at a time. The point here is to keep everything the same and change only the one thing you are interested in testing (e.g. headline or value proposition). If you change too many things, then it becomes difficult to learn what is impacting customer behaviour.
*Optional extra – Test advertising: The advent of Google and Facebook advertising has provided another for testing value propositions. Similar to landing pages, you can launch an online advertising campaign to test your solution ideas. Using A/B testing, you can measure which value proposition or product name gets the highest click-through rates. Test ads can also be used to test the right channel to reach customers in the future (e.g. Google vs Facebook vs Amazon).
3.13 Comprehension test
The results obtained from a landing page or a test advertising campaign are only meaningful to the extent that people understand the headline or the value proposition. It is possible for an experiment to fail simply because people did not understand the value that was offer. As such, before setting up your landing page or running a test adds, it makes sense to run a comprehension test.
How to do it
This test takes about 15 minutes to complete. All you need to do is to find a sample of early adopters. The test must be run one person at a time:
- Create the landing page or simply write value proposition statement clearly on a piece of paper.
- Show the landing page or value proposition statement for a few seconds. Provide enough time for them to read it (e.g. 5–10 seconds).
- Remove the landing page or value proposition statement and ask the person to tell you what the offering is in their own words.
- Capture their responses and compare to your own landing page or value proposition statement.
If what people say is similar to your value proposition, then you have a clear offering. However, if people are saying things that are different from your value proposition then you might have to revise your statement to make it clearer.
Tip
Remember that if you revise your value proposition statement, you have to retest the new statement with customers.
3.14 The explainer video
Another way to ensure that people understand the value proposition is to create an explainer video. This is especially useful when you are thinking of creating a complex product or a product that serves complex needs. A popular example of an explainer video is the one Dropbox created before they had finished building their product. This video illustrated how the product ‘worked’ and resulted in over 50,000 signups for a product that was yet to be completed!
How to do it
With explainer videos it’s all about the script. This is something that has to be well designed. A good script for an explainer video has the following elements.
- Start with the problem or customer need to be solved.
- Then present current solutions and why they are not providing value.
- Now introduce your solution and describe how it provides value.
- Provide some social proof that your solution works.
- End the video with a call to action.
Figure 3.6

Tips
- Given people’s attention spans, short videos are better than long ones. You also have to get people’s attention early, so make the first 20 seconds count.
- But remember that short is not the same as fast. So, don’t jam your scripts with loads of information and have the narrator talk fast just so that you keep the video short. Instead, curate your script to ensure that only the essential information and details are provided.
- Even if you are thinking of a complex solution, try and keep it simple. Avoid jargon and use the everyday terms that customers use to describe their problems and needs. This means we have to pay attention to the audience we are making the video for.
- Even if you are using a script make sure that the video feels natural and unscripted.
- There is a temptation when making videos to want to highlight the cool features of our product. Please avoid this and instead focus on the benefits to the customer.
- Make a good quality video with good visuals, picture quality and sound. Given the technology available these days, quality is now table stakes. Use animation, good actors or narrators. However, remember that the ultimate measure of quality is how easy it is for customers to understand your value proposition after watching the video.
- Explainer videos are usually part of a landing page. As with all landing pages, always include a call to action.
3.15 Paper prototypes and storyboards
If making a video is too costly an option for you, there is another way to test your value proposition visually. With paper prototypes, you can talk people through the potential experience of using your product. You can then invite them to give you feedback about your idea. You can even allow customers to scribble on the paper prototype. They can then show you the places they may look for a feature and click to find value. This feedback is powerful as an early indicator that you are headed in the right direction.
Storyboards are also a great visual way to test your value proposition. You can sketch out a narrative storyboard or a short cartoon that tells the story of how your customers can use your product to solve their problems. Such a visual presentation can help in two ways: it can help you check whether your understanding of the customer context and needs is correct; it can also help you test whether your proposed solution resonates with customers.
As shown in the image, a storyboard needs to have only a few panels that show:
Figure 3.7
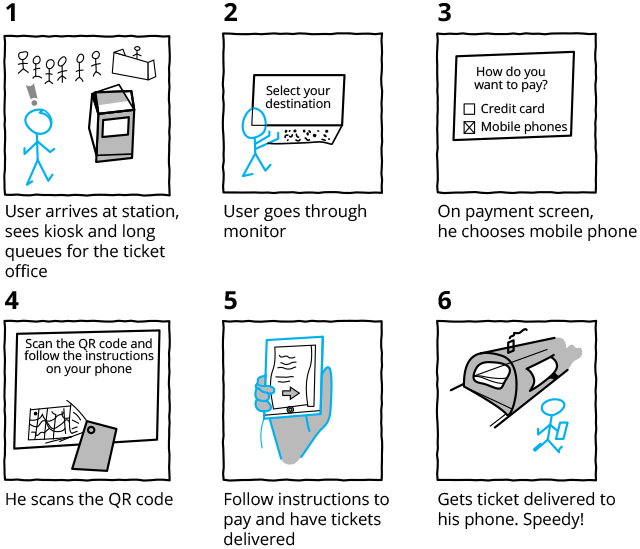
- the problem you are trying to solve for customers
- the context in which customers will encounter and use your solution
- how the solution will help them solve their problem or get their jobs done
- the key benefits they will get from using your solution.
Tips
- Use your prototype or storyboard is created to test specific assumptions.
- Use these tools test whether the customer need is serious enough and also whether the solution you are thinking of is the right one.
- Keep the visuals simple and easy to understand.
- Do not pitch or try to sell your idea. Instead allow customer to review and critique the paper prototype or storyboard.
- Allow customer to lead the conversation. Try not to guide them too much.
- Make copies of the storyboard and allow customers to write their feedback, preferred solutions and workflows on the map.
- Use the lessons learned to iterate on your solution ideas.
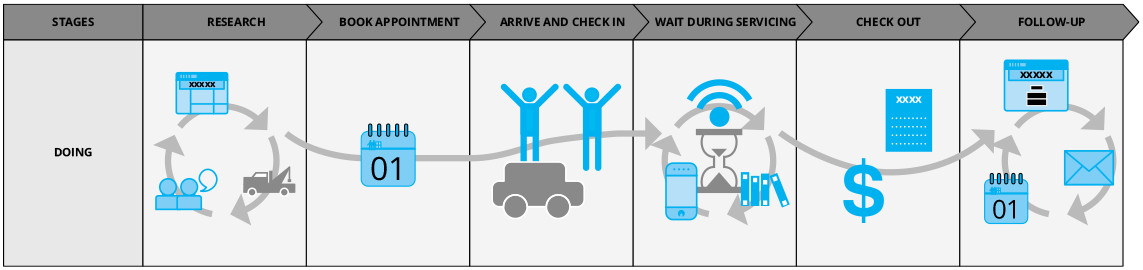
3.16 Customer journey mapping
A variation of the storyboard is the customer journey map. This map is a graphical representation of the customer’s experience via key touch points with your organisation and the solution. This process is often used for products that are already in the market. However, it can also be used for new ideas as a way to test our thinking about how our solution is going work within a customer journey.
How to do it
- Clarify the customer segment for whom you are mapping the journey.
- Also, be clear about which journey to are mapping (e.g. awareness, purchase and first experience).
- Walk a mile in your customer’s shoes. Imagine all the touchpoints that they will have with your organisation and the solution.
- Capture the activities and feelings that should be part of each key step along the journey.
- Make clear the multiple ways that customers can reach the same touchpoint (e.g. customer can get to the purchase point via sales calls, website or visiting a physical store).
- Differentiate touch points that are visible to the customer, versus those that happen backstage within your company.
- Make your journey easy to understand. You can use A3 or A4 size paper in landscape. Map the steps of the journey horizontally along the top. Along the vertical axis, you can map the customer activities, thoughts and feelings that are part of each step.
- Test the journey map with customers. Ask them to identify additional steps and activities. You can also ask them to rate or rank the steps that are most important to them (e.g. on a scale of 1–10).
Tip
Use customer feedback to identify any gaps in understanding their journey that you may have.
3.17 Picnic in the graveyard
When to use it
This method is called picnic in the graveyard, because it focuses on examining products that have failed and ‘died’. The goal of all the methods and tools we have described so far is to help us get an idea of the product we should be building. What features should it have? How can we deliver value? What is the minimum set of features that can be in our first version of the product? However, even if our product idea is highly creative and original, there is nothing new under sun. It is likely that someone else has had the idea before. The picnic in the graveyard23 method is based on finding products similar to our idea that been launched and failed in the market.24
Figure 3.9
How to do it
- Explore – Take time to look for products that have been launched and failed. Desk research is good for this, but you can also speak with colleagues and customers. In fact, you can explore some of the solutions that customers are currently using that are not delivering value.
- Research – Talk to customers to learn about what they disliked about the failed product. You can also reach out to the companies or founders that launched the failed product and learn from them. Some founders may not be willing to talk, but you will find that most founders are willing to help.
- Analyse – Review your findings for hints on how you could make the products better. Many products that fail are usually close to the right solution but are missing one or two features.
Tip
If you are going to be introducing a product that is similar to those that have gone before, then you need to be sure about your key differentiator.
3.18 The market opportunity
As the picture of your target customer and their needs becomes clearer, it is time face up to a very important question: does your target customer represent a market that is large enough to build a sustainable business? This is an important question because finding a group of customers with a need is not the same as finding a profitable market. As such, you can use the desk research techniques we described earlier to perform some market analysis.
How to do it
- An important first step in your market analysis is to consider the total size of your market. When doing this analysis, you must consider both volume and value. Volume speaks to the potential number of customers, while value speaks the total amount of dollars available in the market. Ideally, you want a market with high volume and high value. However, it is likely that you might have to make trade-offs.
- Next, you need to be more specific about the type of customer within that broader market that you are going to target with your product. We often encounter innovators who think that they their product is for everyone. They commonly make broad statements such as ‘My product is for everyone who needs X’. No product is for everyone, even if they share the same needs! As such, we have to use our learnings to select a more specific target market.
- Another mistake innovators make is to pick a random percentage and use that as their target. For example, people will say things like, ‘There are over five million dog owners in England, and if we get just 10 per cent of that market then we will be rich!’ Such estimates do not provide a proper basis for decision making. Instead, we need to define a specific target market and then estimate what size of the total market those people represent.
- One way to make these distinctions is to calculate TAM, SAM and SOM. The total addressable market (TAM) is the total market demand for a product. The serviceable addressable market (SAM) is the part of the TAM that is served by your product or service. Finally, the serviceable obtainable market (SOM) is the part of the SAM that you can realistically reach.
- In addition to the potential size of the market, you also have to consider competitors. Are there any strong competitors in the market? What is their market share? Is this a red ocean where you have to succeed by taking customers away from the competitors? If yes, what are the switching costs for your customers? Or is there a market segment that competitors have ignored that will be served by your product? After analysing competitors, you may need to revise your market size numbers, especially for SAM and SOM.
- Finally, you need to analyse whether there are any barriers or regulations that make it hard to enter your target market. For example, you may need licences and permissions from other companies to use certain technologies. There could also be barriers that restrict access to distribution channels (e.g. exclusive contracts). Barriers often raise the costs of entering a market, which must then be offset against the value of that market.
After completing your market analysis, you should then return to question; does your target customer represent a market that is large enough to build a sustainable business? If the answer is yes, then you are good to go. If the answer is no, you can make the decision to pivot to another target customers or decide to stop the project entirely.
Tip
When performing market analysis, please be honest with yourself. Non-existent markets won’t just pop up after you have created the product. Remember that people will not pay to solve a problem they don’t have!
3.19 On surveys and focus groups
So now it’s time to address the elephant in the room. You may have noticed that our review of methods left out surveys and focus groups. Although these two methods are quite popular among market researchers, there are not top of the list for us in the Lean PLC. Our concern is with getting a deep understanding of customers and their needs. We feel that these two methods are not best suited for doing that.
Surveys do have their place in the research methods toolbox, but only if they are used with other methods. The reason we don’t encourage innovators to use online or mail survey is because violates the ‘actual place actual thing’ rule (i.e. Genchi Genbutsu). When trying to learn about customer there is nothing better than going to see their lives for yourself. Surveys may be useful when you have a product out in the market. But even then, these market data must be supported by going to the market and speaking to real people.
Focus groups are also a popular market research tool. However, this method of engaging with customers increases the social desirability challenges we highlighted earlier. People’s behaviour is strongly impacted by the presence of others. It’s always important to remember that we are not just interested in hearing customers speak. We are interested in what they really think and feel. So, it is important to put customers in situations where they will be comfortable sharing their inner thoughts with us. Focus groups with strangers are not really the place for that.
Top tip
We are not saying that people should never use surveys or focus groups. However, these methods should be used with caution and they should be used as part of a larger toolbox of research methods (i.e. learn then confirm).
3.20 Making decisions
We have reached the appropriate point in our journey to remind ourselves why we are doing all this work in the first place. During Explore, the methods and tools we have described are used to test some key assumptions: is there a real customer need, how strong is that need, what are the customer jobs to be done and what might be good solutions to meet those customer needs? At the end of every experiment, we have to review our learnings and make decisions.
Remember that if we are making something that nobody wants, then it doesn’t matter if we are on time and on budget. – Eric Ries
Our main goal as we move through the Lean PLC is to make products people want, and to figure out a profitable business model with which to deliver that value. While we do our work, we will run down rabbit holes and dead ends. As we pivot and iterate our way through Explore, we will eventually come to the end of our runway. Then it’s time to face reality:
Have we found a real customer need and potential solutions for that need?
If the answer to this question is ‘YES’, then we are ready to start building a solution. However, if the answer is ‘NO’, then we have to make a decision. Do we pivot or do we stop? This decision is a judgement call based on learnings, context and available resources. It is possible that while you have been out of the building, you have picked up a strong signal of a potentially strong need or new customer segment to pursue. In this case, if you have the funding and resources you can remain in Explore and make a pivot.
On the other hand, it is sometimes a good idea to stop. This is particularly important, if there is no real customer need. Rather than waste time and money insisting on pursuing a dead end, it is better to save our resources and deploy them in new ideas. We may not throw away our idea. We may just park it for a while. It is possible that overtime, new insights will emerge within our company that can revive our idea in some form. However, for the time being we have to STOP.
Figure 3.10

3.21 The business model
If we have found customers with a real need and we have an idea of the solution we might want to build for them, then it is time for us to start thinking about the business model. Beyond ideation about products and services, business model design allows us to take a more holistic approach to innovation. We can see how our ideas about products and services work in concert with the key partners we might need to deliver value, the channels or customer relationships we might need, potential cost structures and revenue models.
One of our favourite tools for business model design is the business model canvas. Developed by Alexander Osterwalder and colleagues,25 it has nine key elements that make up typical business models. Each of these elements is described below.
Figure 3.11
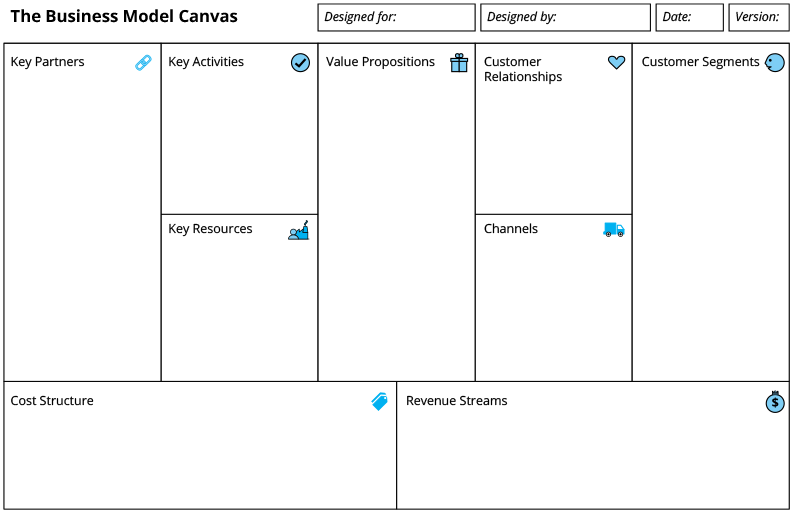
- Key partners: It is sometimes important for companies to form partnerships with other organisations. This can help your company reduce risks and acquire capabilities it does not currently have.
- Key activities: In order to make the business model work, there are certain activities your team will have to do well. These can include product, problem solving, marketing or developing a network/platform.
- Key resources: This refers to the physical, human, intellectual and financial resources you will need to create value and make your business model work.
- Value propositions: This describes the value that you provide your chosen customer segments. This is a summary of the detailed information you have already captured in the Value Proposition Canvas.
- Customer relationships: This is about the type of relationship you are going to have with you customer segment. There are various types of relationships including dedicated personal assistance, self-service and automated service.
- Channels: This is how you are going to reach your customers. How will they learn about the value you offer? How will you communicate with them? And how will they get the product or service delivered to them?
- Customer segments: These are the various groups that you have identified during Explore that will be served by your product or service.
- Cost structure: This describes all the fixed and variable costs you will need to create and deliver value. Identifying risks around costs is an important part of deciding whether you have a profitable business model.
- Revenue streams: This describes how your organisation is going to capture value back from the customers. There are various revenue models you can have including asset sale, usage fees, subscription fees, renting and licensing.
3.22 Business model prototyping
The business model canvas can be used as a prototyping tool. This business model design method allows us to think through various types of models for our product or service. As we start to settle on the right solution for our customers, we need to imagine several business models we can use to create and deliver value. Prototyping prevents us from getting trapped in the local maxima of using the first business model we can think of. Below is a facilitator’s guide on how to run a business model prototyping session.
How to do it
3.23 Identify assumptions – make plans to test
At this point we have achieved three key milestones. We have discovered a real customer need that we can help solve, we have identified a value proposition and potential solution that resonates with customers and we have designed our ‘Plan A’ business model. Indeed, the lessons we have learned so far will have informed our business model design. However, all this does not mean that we are ready to build and launch our product. There are still many assumptions about the solution and business model that need to be tested.
Our first business model is referred to as our Plan A for reason. We will have to iterate our way to Plan B, C, D… Z using lean innovation methods. So, as we did with our value proposition canvas, we need to identify our risky assumptions (see Figure 2.2).
- As such, the team must step back after mapping their business model and review each sticky note using the same key question: Do we have evidence for this or is it an assumption? When in doubt, it is an assumption and we must put a large red X on all sticky notes with untested assumptions.
- After this, we will then rate each untested assumption in terms of how critical it is to the success of the business model (1 = Not critical and 10 = Critical). Remember that an assumption is critical if you have to stop the project if it turns out you are wrong.
- After identifying our riskiest assumptions, we can then make plans to test to them. The next stage of the Lean PLC is the Validate stage. During this stage you will test your assumption about the solution as you are creating it. You will also test your assumptions about the business model. Your team can use the experiment canvas to start coming up with different ideas for the experiments you might run to test your ideas (see Figure 3.1). This is the critical final step as you prepare for the Validate stage.
3.24 Preparing for Validate
If you have done the activities we described above, your team is ready to ask for a larger investment to move to the Validate stage. Indeed, the product council is happy to invest a larger amount of money in your project because you have validated real customer needs and a resonant value proposition. However, Lean PLC rules still apply; do the right things at the right time. At this stage, teams should not be asking for massive investments to launch their product at scale. Instead, they should be asking for the minimal investment they need to test their assumptions around the solution and business model. We may include:
- brief details about the solution we plan to work on and how the solution supports the strategic goals of our company
- an update of the work we have done so far and how the evidence supports our proposed solution
- an update of our research on the market opportunity and whether it represents a real market
- our assumptions about the right product or service to create for customers
- our assumptions about the right business model to create and deliver value
- the assumptions we plan to test during Validate, and brief details of the tests we plan to run
- the resources and funding we think we will need to complete the iterative creative of the solution and validate our business model.
We are still not looking for a 40-page business case with five-year projections in it. The product council or investment board is looking for evidence of a real customer need that faces a large enough market and clear next steps that take us closer to a successful launch.
SUBMISSION TEMPLATE
Explore to Validate SUBMISSION
Idea ownership
| Investment board | |
| Business sponsor | |
| Product owner |
Idea overview
| Product name | |
| Idea description | |
| Strategic fit |
Target customers and jobs to be done
Describe your potential customer segments and their needs or jobs to be done.
| Customer segments | Jobs to be done |
Explore lessons learned
Provide an overview of the assumptions you tested in Explore and the lessons learned. Add more customer assumptions as necessary.
| We believe that: | |
| To verify that we: | |
| And we measure: | |
| We learned that:25a |
Market opportunity
Please update your learnings about the market opportunity below:
| Total addressable market (TAM) in dollars ($) | Serviceable addressable market (SAM) as % of TAM | Serviceable obtainable market (SOM) as % of SAM | ||
Market description
| |
How much did you spend in explore
Provide a breakdown of your spend during Explore.
| |
What are your plans for validate?
Please provide a summary of the activity you plan to do next.
| |
Assumptions to test during validate
Provide an overview of the assumptions about the business model you plan to test during Validate, how you will test them and your success criteria.
| We believe that: | |
| To verify that we: | |
| And we will measure: | |
| We will know we are right if: |
Market opportunity
Beyond the research that you have done so far, please provide an overview of any further research on the market opportunity that you plan to do in the next phase.
Resources and funding requested
To complete the Validate stage, we are asking for (e.g. dollars, time, people):
* Please note that you also have the option to remain in Explore, go back to Idea or stop the project entirely. If either of these options are what you are choosing, then you need to adapt this template so that you can update the product council on work done so far, key lessons learned, what you plan to do next and the resources you need

An interview with:
The Innovaid team at Rabobank
Rabobank is a Dutch multinational bank headquartered in Utrecht, Netherlands. It has over 40 000 employees and is among one of the largest financial institutions in the world. The bank is a global leader in food and agriculture financing. This interview case study was conducted with Rabobank’s Innovaid team. This team is led by Siddi Wouters, Global Head of Innovation at Rabobank. Innovaid is responsible for the education and acceleration of innovation within Rabobank.
In your experience, what are some of the top challenges large companies face when it comes to testing new ideas for products or services?
There are a couple of challenges large organisations face when it comes to testing new products/services. Most organisations follow the horizon classification of McKinsey: Horizon 1 and 2 innovations are implemented by the Execution part of the company and Horizon 3 initiatives are created by a separate department, accelerator or incubator. The biggest challenge with this approach is that the learning curve, mindset and skillsets gained grow faster in this separate unit than within the execution (main) part of the organisation. At Rabobank we help bridge that gap by facilitating knowledge and coaching from our innovation unit (the separate department) to include the entire organisation no matter what type of innovation initiative you want to investigate. Getting the business lines to learn as fast as the innovation teams do, is one of our goals. We are still trying to balance the often reactive and time-consuming demand from the organisation and our own mission to create new, Horizon 3 initiatives.
Another challenge within large organisations is the time provided to employees to ‘work on innovation’. Often, employees do not get dedicated time to work on innovation, as there is no time, mandate or priority to focus on innovation. Which leaves employees in many situations demotivated to really get the idea going. At Rabobank we enable dedicated time to work on innovation through campaigns and innovation programs to have a continuous impact on employees, ideas and the business as a whole.
Finally, the entrepreneurial mindset, to find ways to run experiments, is limited or less appreciated within large organisations as it is not a mandatory integrated part of the day-to-day activities and can be viewed as risky as it can affect business. Innovaid aims to change this.
As the Innovaid Team, what best practices do you recommend companies like Rabobank put in place to help their teams generate great ideas?
The Innovaid team is responsible for empowering Rabobank to innovate more, faster, fact-based and customer oriented. We do this by training, coaching and facilitating the time, room and space to innovate. Our current focus and starting point is on idea generation, for which we created our own Ideation game and workshops. We train our enthusiastic employees how to facilitate their own workshops and campaign globally to create traction. This way we spread innovation through the bank exponentially.
Without giving away too much detail, can you share a story of a team that you have worked with in Rabobank that did great work of testing their idea? What did they do well?
We can name many teams that tested their ideas successfully. However, teams that potentially did even a better job, are those that killed their initiative based on customer feedback. These ‘successful failures’ learned what won’t work and acted upon that instead of continuing based on their gut feelings. The teams we work with have one objective: understand your customer. We guide teams through several phases: Ideation, Problem-, Solution- and Market fit. All these phases have different aspects and deliverables, but are all focused on one thing: solving a problem for the customer! When the results or assumptions don’t match we take a step back to align or even stop with the initiative. When they do align, we coach them through the next phase.
Finally, what do you think companies should do once they have found an idea that has potential traction?
If homegrown initiatives show positive signs of traction, companies should unleash the teams. Depending on what the team needs to grow, from a staffing point of view, as well as from a marketing point of view, the company should reward the team.
What companies should avoid is funding the team for multiple years in a row, but instead offer short funding cycles that are effective and result orientated: are we solving a customer problem?
____________________
16 Viki, T., Toma, D. and Gons, E. (2017). The corporate startup. Deventer: Vakmedianet.
17 Moore, G.A. (1999). Crossing the chasm. New York: Harper Business.
18 Blank, S. and Dorf, B. (2012). The startup owner’s manual. California: K & S Ranch.
19 Ries, E. (2011). The Lean Startup. New York: Crown Books.
20 Liker, J.K. (2004). The Toyota way. New York: McGraw Hill.
21 Fitzpatrick, R. (2014). The mom test: how to talk to customers and learn if your business is a good idea when everyone is lying to you. Amazon CreateSpace.
22 Gray, D., Brown, S. and Macanufo, J. (2010). Gamestorming: A playbook for innovators, rulebreakers, and changemakers.Sebastapol: O’Reilly Media.
23 Murphy, S.K. (2012). Pretotyping – Techniques for building the right product. Available at http://www.skmurphy. com/blog/2012/03/06/pretotyping-techniques-for-building-the-right-product/
24 Kromer, T. (2015). Generative research: Picnic in the graveyard. Available at https://grasshopperherder.com/generative-research-picnic-graveyard/
25 Osterwalder, A. and Pigneur, Y. (2010). Business model generation: a handbook for visionaries, game changers, and challengers. New York: John Wiley & Sons.
25a Osterwalder, A., Pigneur, Y., Bernarda, G. and Smith, A. (2015). Value proposition design. New York: John Wiley.challengers. New York: John Wiley & Sons.