Grow

5.1 Welcome to Grow
Welcome to the right side of the Lean Product Lifecycle (Lean PLC)! As you went through Idea, Explore and Validate, you ploughed through the paths of uncertainty using experimentation and iterative product development methods. Emerging from that journey, you now have some clarity on the right solution for your customers and the right business model to deliver that value. This is the transition point from the left side of the PLC to the right side. It is now time to double down on your validated business model. But if you think that this is all about execution; well think again!
Grow will be a critical and challenging stage for your product. It is not as simple as pouring fuel in your rocket and watching it fly. This is the lifecycle stage where many of the technology game changers that have been documented in the media such as Uber, Airbnb and Dropbox really knocked it out of the park.37 But this is also the stage at which a lot of great products have failed. Grow requires relentless focus, energy and commitment over the long term. And even as you scale, you will need to continuously apply lean thinking within an environment which is constantly evolving.
To succeed in Grow, you will need to navigate the operational and cultural challenges of discovering and executing your business model at the same time. You will need to continuously improve operations so that you can scale fast. It will require you to keep pace with the progression of technology against a continuously evolving and relentlessly changing business environment. And if you stand still for too long, someone will be ready and waiting to take your customers. The Grow stage can be split into the following key phases.
- Tuning the engine: This phase focuses on finding the right growth engine and testing our growth hypotheses. We will have learned some key lessons around potential growth during Validate, but now we want to refine our learnings so we can fully execute on our growth strategy.
- Accelerating growth: As our knowledge and confidence around our strategy increases, we can then turn our attention to accelerating growth. We can deploy various growth tactics to rapidly increase customer numbers, revenues and profits. The goal here is to not only grow these key numbers but also improve our growth rates.
- Optimising the engine: When we get to full velocity, our product will be growing fast. This does not mean that we rest on our laurels. We will continue to improve the product and optimise our growth engines. Such continuous improvement is a key part of lean thinking; and we will use it to maintain our growth rates.
- Preparing for sustain: Every product eventually matures in the market. Growth rates will slow down as technologies and customer preferences shift. This does not mean we kill our cash cow. Rather, it means we have to change how we manage it. Our investments in growth can now be decreased and we can turn our attention to optimising and reducing costs.
5.2 Premature optimisation
So far in this book, we have been cautioning you against premature scaling. If you have followed our advice, you have worked hard to systematically uncover a great business model for your product. While this may be exciting, we have some more words of caution for you: avoid premature optimisation. In most companies, when a team with great product enters the Grow stage, they come under immediate pressure from leadership to rapidly grow the product. This can lead to early standardisation and counterproductive marketing expenses before the team has found the right growth engine. In other words, avoid those Super Bowl ads.
Before scaling rapidly, what we want to do first is find sustainable growth. According to Eric Ries, a product has sustainable growth when new customers come from the actions of current customers.38 This is different from one-off marketing activities that may drive an initial bump in customer numbers and then fade over time. There are various ways to achieve sustainable growth and we will discuss these in more detail later. At the moment, we want to emphasise that before finding sustainable growth, any actions towards ramping up scale are bound to fail.
To find sustainable growth, we have to apply the same build–measure–learn process that we used during the earlier stages of the Lean PLC. We have to identify clear hypotheses about the level of growth we want to achieve and how we think we might achieve that. We then have to test these assumptions by deliberately measuring the impact of each growth tactic on the bottom line. Our goal is to find a repeatable process for driving customers to our product, converting them into paying customer and retaining them over the long term. Only after we have found this repeatable process are we then ready to scale.
As such, we never stop using lean thinking across the entire Lean PLC. As we grow our product we have to manage a continuous cycle of learning and development.
- We will need to ensure that our teams are balanced and resourced so that they can simultaneously manage searching and executing on your business model.
- We will need to decide on a range of key metrics that we will track to manage growth and scaling.
- We will benefit from introducing a cadence for growth reviews during which we examine whether our growth tactics achieve our hypothesised results.
- We will need to continuously advance our practices so that we can reach a state of continuous delivery.
5.3 Beyond the early adopter
As can be seen from Figure 3.2, on the left side of the Lean PLC you did most of your work with early adopters. However, in order to scale, you have to start thinking about mainstream customers. Unlike early adopters, mainstream customers are more demanding in terms of product quality and reliable service. The channels and marketing messages to reach mainstream customers will also be a little different to those you used to reach early adopters; and as your customer numbers increase you cannot retain the intimacy you once had with customers.
As such you need to adopt a different mindset. All of your learnings from Validate will need to be reconfirmed as you take the product to scale. This includes the technology stack, levels of service provision and business model which will need to be continuously refined as you learn. When maturing operations for scale, your team’s culture will be challenged and will be expected to evolve. In most cases each challenge may slightly change the culture and you will need to be mindful of the direction it takes. These changes are needed to grow, but also risk negatively impacting growth if not managed well.
To go beyond innovators and early adopters there are several things that you now need to consider. Table 5.1 lists things which your early majority customers and beyond will expect over your early adopters which you’ll need to prepare for.
Table 5.1 Early adopters versus early majority
| Early adopters | Early majority | |
| Takes higher risks | Takes lower risks | |
| 1 | Open and willing to try the product and excited to be involved with a new innovation. Willing to apply the product to many applications. | Focused around what the product can do for their specific job to be done and less excited about a new technology novelty. Will need a more obvious application to the job to be done. |
| 2 | Willing to pay a higher price than adjacent competitors, to be the first to access a new technology. | More price-aware and will be actively comparing a broader range of competitive solutions. |
| 3 | Open to trying the product with limited or no marketed company presence. | More assurance of the company behind the product and brand. Likely to want to see marketing presence and market domain association. |
| 4 | Willing to tolerate some failures and willing to spend time to work around minor problems and configuration issues. | Expects a higher level of product quality with provisioned support and services. Expects the product to not fail when used. |
| 5 | An adoption leader is willing to make choices which are unpopular and new as an individual. | Is part of a crowd and will follow the trends. Considered a follower. |
5.4 Engines of growth
In order to grow effectively, companies need to have a shared language. As part of the lexicon, innovation teams need to understand the growth engines for their product. An engine of growth is our system for sustainable traction. It is how we ensure that the actions of current customers are consistently driving new customers and revenues to our product. In other words, engines of growth are a repeatable system for growing customer numbers, customer retention, engagement, revenues and profits. There are three main engines of growth that teams can use.
- The paid engine relies on paid advertising, marketing or a sales force to grow your product. With this engine, the key behaviour from current customers that drives growth is the amount of money they spend when they purchase our product. Since we are paying to acquire customers through advertising, marketing or a sales force, there are costs associated with every new customer we get. To achieve sustainable growth, the cost of customer acquisition must be less than the money those customers spend when they purchase our product. This then allows us to reinvest the money to acquire more customers creating a virtuous cycle of sustainable growth.
- The sticky engine relies on customer retention. The challenge here is how we get customers to stay with our product and potentially increase our share of their wallet. With this engine, the key behaviour from current customers that drives growth is whether they keep coming back to use our product. For sustainable growth, our retention rate has to be higher than our churn rate. If the rate at which we acquire and keep new customers is greater than the rate at which we lose customers, then sustainable growth will be achieved.
- The viral engine relies on word of mouth and usage by your current customers to drive growth. With this engine, the key behaviour from current customers that drives growth is the extent to which customers are willing to actively market our product for us by making referrals. The viral engine can also work when current customers inadvertently market our product through their active use of it. The success of our viral engine is indicated by our viral coefficient. In a good viral engine, a current customer brings with them on average more than one other customer (e.g. 2 or 3). This means that any viral coefficient above 1 indicates a good engine with sustainable growth.
It is possible for a product to have more than one growth engine. For example, a viral engine works really well if you have also got a sticky product with good retention rates. The key is to identify your primary engine and use that to make decisions. Our goal is to ensure that our growth engine works the same way with mainstream customers as it did with early adopters. Getting your growth engine right and refining it regularly is really important. For example, Dropbox had to pivot away from their initial paid engine of growth to a viral engine of growth. This change increased their user base from 100,000 to 4 million in 18 months.39
It is also important to recognise that sustainable growth has to be based on sustainable profits. A great viral engine with high retention rates is a good indicator that customers love our product. While we can grow customer numbers with a good viral engine, we don’t want to do this while losing money! It is true that some great companies have been built through an initial focus on growing customer numbers (e.g. Facebook). But this growth was not an end in itself. It was simply an initial step to grow customer numbers with a view to eventually monetising those customers and becoming profitable.
5.5 Tuning your engine
When you first enter Grow you are still learning and your product could still be changing in response to the market. It is possible to view the first stages of Grow as beta. The best way to avoid premature optimisation is to benchmark where you are at the moment. You may not yet have the large numbers of customers that indicate a growing product. What we need to know at the moment is the product’s potential for growth and make decisions about what to do next.
In order to tune our engines of growth, we have to revisit our funnel and cohort analyses. As can be seen in Figure 4.1, we are looking to examine our per-customer metrics. What are our customer acquisition rates using our current marketing channels? What is our average cost of customer acquisition? How well are we converting or activating our customers? What are our current customer retention rates? How much revenue are we getting per customer? What is our customer lifetime value? How many referral customers are we getting? What is our viral coefficient?
If we benchmark these numbers, we will know what the current state of our product is. We can then begin to work towards growing the product while tracking any improvements in these numbers. The cadence at the which we track the numbers depends on the number of growth experiments we are running and the pace at which we acquire new cohorts of customers (e.g. weekly or monthly).
As noted in the previous chapter (Figure 4.2), we want to track our metrics on a cohort by cohort basis. We do not want to mix last month’s customers with the new customers acquired this month. The reason for separating our cohorts is that we want to see if there are any real improvements on our per-customer metrics. Are we growing the product at an improving rate? This benchmark becomes the basis for decision making going forward. The success of every decision we make will be judged by our ability to move that needle.
Things to look out for in the first sub-phase of Grow:
- The customer expectations of quality in terms of your product and supporting services have significantly increased and will continue to do so.
- The engine of growth, customer behaviours and business model defined in Validate will be subject to change as you expand to the Early Majority and beyond.
- The cost and effort to maintain and transfer knowledge across your team will increase as your team sizes grow.
- Your customer support, services and sales teams need to be laser focused and coordinated constantly. This is especially required where many parts of your business will have direct contact with customers where others won’t; increasing the risk of assumption and interpretation.
- You will need to advance and refine technical operations, services and performance constantly for repeatability and scalability.
- If you are part of a larger enterprise or have investors, you will need to actively obtain and maintain explicit senior support and buy in to maintain momentum on a regular basis.
5.6 Growth hypotheses
In most traditional business plans, you will find growth projections. These are usually described in 3–5 year periods. Within the Lean PLC, we prefer the team use growth hypotheses instead. This minor difference in wording represents a significant difference in orientation. While growth projections can result in an exclusive focus on execution, growth hypotheses orient teams toward learning and discovery as they scale.
It is important to note that our growth hypotheses are not pulled out of the air. They are based on what we learned during validate and what we need to learn going forward. Much of what you think you know is an assumption and not necessarily fact. At the same time, we need to have a vision about where we need to be for the product to be successful.
Figure 5.1
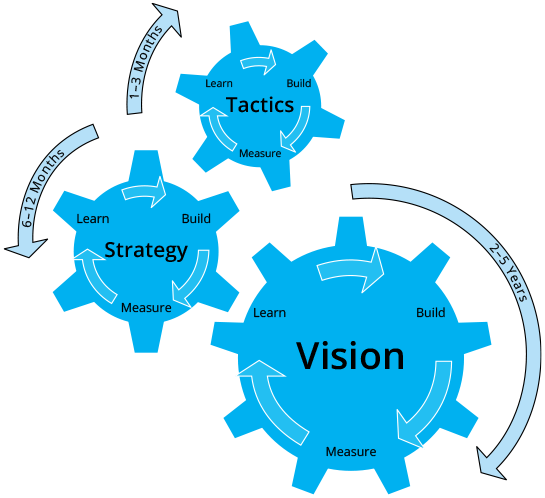
There are three main time layers within our hypotheses. The first layer is our 2–5 year vision of where we want the product to be. The second layer is our annual growth strategy that will help us achieve our long-term vision. Finally, the third layer is more tactical and refers to shorter time cycles such as monthly or quarterly growth numbers that are related to our annual growth hypotheses. The time to validate each of the layers varies and as such, each of these three layers have their own set of hypotheses which should have a direct connection to each other through leading indicators. If tactics need to pivot when reviewed at a quarterly point, this doesn’t and shouldn’t mean your vision needs to. If you fail to deliver tactical success on a continuous basis though, this might indicate a change in strategy is needed.
Our growth hypotheses have to be specific and actionable. As part of our 2–5 year vision we have to set clear goals of the customer numbers, market share, revenues and profits we want to achieve. Once we know our long-term goals, we can then break it down into our per-customer metrics or business relevant units of value (e.g. customer numbers or number of new subscriptions).
Imagine a team that wants to achieve $50 million in annual revenue by year three. This broad number can be broken down into the number of customers, sales, or subscriptions needed to achieve that goal. For example, the team using a subscription model can calculate that they need 200,000 customers paying $250 per year to reach their target of $50 million in annual revenue. This larger growth target, together with the current state of the business, can be used to set annual growth hypotheses (e.g. Year 1 = 50,000 customers at $150; Year 2 = 125,000 = customers at $200, Years 3 = 50,000 new customers at $100 CLV (customer lifetime value)).
At the tactical level the annual growth hypotheses can be then broken down further into monthly hypotheses. Now the team has clear benchmarks with which to monitor progress and learn early whether they are on track to reach their goal. As the team deploys its growth tactics, it can set clear per-customer target metrics such as conversion rates, retention rates and lifetime value. Each cycle of tactical growth experiments can then be tracked against these minimum success criteria.
 Tip
Tip
Although metrics are needed to validate your hypotheses, it’s recommended that tactical reviews incorporate subjective learnings. Asking and recording explicitly what a team has learnt at each review point, will help construct a narrative to be explored which will inform strategy. This practice also provides reassurance that the teams are actively learning and having the ability to apply new approaches which reduces waste and risk.
5.7 Growth tactics
Once we have outlined our growth benchmarks, we can then begin implementing and optimising our growth engines. On the basis of our funnel we can develop techniques to acquire, activate and get customers to pay for our product. There are also techniques that help us retain customers and convince them to make referrals on our behalf. As we deploy each tactic we should do it in a systematic way, while keeping an eye on our target metrics.
Patel and Taylor40 differentiate between pull and push tactics for acquiring customers. Pull tactics involve subtle marketing techniques such as blogging, writing magazine articles and social media campaigns. The goal is to give customers a reason to come to our product through enticements and incentives. In contrast, push tactics are more aggressive and involve acquiring customer in more direct ways such as sales teams. Both pull and push tactics apply are part of the paid engine of growth. As such, when we use these tactics we have to ensure that our cost of customer acquisition is lower than the customer’s lifetime value.
The viral engine of growth can also be used when the product becomes its own customer acquisition tool. Product-based tactics include customers inviting friends to our product, enabling customers to talk about our product on social networks and incentives such as giving customers some reward if they make referrals and get their friends to sign-up. It is important to note here that acquiring customers is not the end goal. We want to activate them to buy and use our product.
To activate customers and get them to buy our product, we must have clear calls to action. Once the customers are engaged it must be clear what is expected from them. This applies to both physical and digital products. Customers need to know how they can buy the product, sign-up or subscribe if necessary. For complex products, it is also important to have a good process for onboarding customers which reduces the customers’ time to value. A good onboarding process can increase customer activation rates. Teams should provide support and guidelines to help customers use our product. Finally, we should test whether we have the right price to attract customers to activate, while also maintaining good profit margins for us.
The best way to retain customers is to make sure they are happy and engaged with our product. This is why the Grow stage is not just about scaling the product. Part of the focus should be on improving the product to ensure that we get better and better at delivering value. For example, we should not focus on giving good deals to new customers only. We should also offer similar rewards to current customers. Rather than treating our customers as disposable commodities, we should treat them as members of a community. We should consistently seek their feedback and improve our product in response to this feedback.
These are some tactics we can use to scale our product. What is important is to always remember to apply lean thinking. Do not apply every single tactic at once. Using the build–measure–learn loop, we can systematically test each tactic and how it is impacting our key growth metrics. We must always remember that we are trying to learn about what works. The discipline is to keep learning with data.
5.8 Learning with data
Usually the things that see themselves as immeasurable in business usually reveal themselves to much simpler measurements of observation once we learn to see through the illusion of immeasurability – Douglass W Hubbard41
Decision making in the Lean PLC is based on evidence. As such, whenever we deploy our growth tactics we have to use data to track progress. The effort spent in capturing data is worth it if we want to stay lean and ensure we are not wasting time and resources. We should only collect data that allow us to learn. We don’t need to know everything, we just need know enough to focus on our growth hypotheses and track the relevant metrics.
Another common mistake to avoid is not collecting data due to the perceived of difficulty of capturing them. Whatever you need to learn, you should know that pretty much everything is measurable, albeit with variable degrees of complexity. Don’t fall into the trap of thinking that what is difficult to measure cannot be measured. If you need to learn something, figure out a way to measure it! Based on the work of Douglass Hubbard, please consider the following factors when deciding what to measure:
- What is the decision the measurement is expected to support?
- What is the definition of what is being measured in terms of observable consequences and how does it matter to the decision being made?
- How do we compute outcomes based on the value of this variable?
- How much do we know or what is our current level of uncertainty?
- How does uncertainty about this variable create risk for the decision makers?
- Is there a ‘threshold’ value above which one action is preferred and below which another is preferred?
- What is the value of additional information?
These seven questions can help us discover the key data we need to capture, as well as how much effort to put into capturing these key data points. This allows us to focus our effort where there is a return in value.
Data categories
There are four main categories of data we recommend for the right side of the Lean PLC. These are market, customer, finance and operations. By examining and correlating these data groups, you will be positioned to make better decisions around strategic and tactical changes that maximise value. Let’s explore each of these data categories and explain what you can expect to learn from each.
- Market data
Market data will help you observe and learn from your business environment at all times. Within these data you should be looking to see how competitors are evolving, what macroeconomic conditions are changing which could restrict or allow you to exploit your product, how channels and partnerships are performing, as well as emerging social and technological trends. Even as you scale your product, keeping an eye on market data will help us stay ahead of the curve. - Customer data
As we have already noted, customers should be at the heart of all decisions made. Data collection efforts should focus on how well your product and business performs against customer needs and expectations. The pirate metrics42 funnel we have mentioned several times is a good way to track customer data. In general, we should be tracking the following key customer data points:- Customer satisfaction metrics/scores (CSAT) or related measures such as net promoter score (NPS).
- Customer services should be actively collecting information on common issues or pain points raised by customers over a set time period. The customers services team should also be actively monitoring and managing escalation categories ranging from critical to minor issues by type, product release versions and volume.
- Product performance against the customer job to be done. This could include time on task, retention/repeat visits and number of identified tasks completion.
- Time to value from point of sale to customer engagement.
- Customer recommendations and referrals to other potential customers.
- Lifetime value of the customer by customer cohort and across the group.
- Finance
It goes without saying that you will need to monitor and capture financial data on an ongoing basis. You will need to monitor actual financials against forecasts across all operations and revenue streams. This should be done on an ongoing basis to ensure that you are on track and are responding to any negative or positive changes. You will need to track cost (including variable costs), revenues and profit margins. Your goal is to create and scale a sustainably profitable business model for the long term. - Operations
Operational data will allow you to learn how your internal business engine is performing under the bonnet. You can learn a lot about your ability to scale and where performance opportunities exist within your operational data. Some of these may extend financial data and others could be around performance of the business itself. Typical data points include:- Frequency of product releases – Remember the shorter the cycles, the better the propensity to learn, exploit opportunities, adapt to change, provide customer value and eliminate waste.
- Product availability – Your service availability is key to customer satisfaction. Monitoring the uptime, downtime and response time of a service can reveal a lot about your product maturity and ability to scale while still satisfying your customers. As you grow, it’s likely that your technology or operational stack will be challenged and you will need to know where the points of failure are or are likely to be.
- Incident monitoring and reviews – These measure the frequency and type of major and minor incidents across the business. This can stretch across all departments to include customer issues, service issues, response times and other operational issues.
- Employee engagement – This can be a revealing data point to observe. As your customers are central to your business model, so are your employees. Employee engagement which could include satisfaction, sickness, retention, vacancy referrals could reveal relationships to other key data points. As your business scales, your culture will be challenged. Don’t overlook the value of people and your teams. Great companies who scale recognise the valuable contribution of their employees.
Although reviewing these data points may seem intimidating, many of the data points we recommend can be populated or retrieved automatically through many of the common systems already in place. Many companies beyond a certain size have the systems in place already capturing key data, although it’s often inaccessible to product teams. For example, the following systems which many of you may already have in place can be sources of great knowledge to help you learn:
- Customer relationship management systems (CRM) – Systems such as Salesforce, Microsoft Dynamics, SugarCRM, Netsuite CRM, Zendesk, Freshdesk or others will likely have a great deal of information on your customer base, customer issues, sales funnels and marketing inbound leads.
- Enterprise resource planning (ERP) – Systems such as Oracle EBS, SAP or JD Edwards will likely have all your financial, HR and operational data stored giving you an overview of costs, revenue and profits for your business model.
- Application lifecycle management (ALM) – Systems which monitor your delivery flow and service status such as Atlassian JIRA, VersionOne, Rally, LeanKit and others contain a wealth of information around operational state and delivery cadence. Such systems may potentially provide insight into flow which includes defect trends, mean time to restore systems, deployment frequency and lead times.
- Corporate performance management (CPM) – Systems which are integrated with many elements of the operational, planning and controls of an enterprise. Solutions such as Anaplan, Host Analytics and Hubble can provide and help release trapped knowledge within your business helping empowered employees make decisions using key data points. Such systems can integrate across data sources and provide enterprise-wide performance insights through data analysis. Releasing this information on a real-time basis could significantly inform your Lean PLC progress and provide key insights to business model design.
- Business intelligence (BI) – Tools which provide integration, collection, analysis, and presentation of business information. Tools such as Tableu, Microsoft Power BI, Qlik and Domo can be configured to present key data trends and KPIs from multiple data sources. Utilised well these can provide beneficial outcomes which could relate to your products performance relevant to your lifecycle stage.
Although many systems have been referenced above, these are not required or necessary by any means to operate successfully with the Lean PLC. In fact, for smaller lightweight and agile teams, we would advocate keeping your processes very simple and avoiding ALM tools until absolutely necessary, where the benefits are understood and explicit. Many smaller companies want to appear like bigger companies so are tempted to adopt their practices. This can introduce waste and limit the nimble and responsive states that some smaller companies should take advantage of.
Teams can succeed with simple operational tools and processes, often observed with development teams using iterative development practices using nothing but post-it notes and office wall space supported by the Scrum Process.43 The important point is to focus on growth and key outcomes in line with your strategic vision and to use the appropriate data when necessary. If you are large enough or operate in an environment with any of the systems above already in place, we would however encourage you to unlock the data trapped within these systems to provide meaningful knowledge to help inform your Lean PLC phase. This explicitly requires you to challenge organisational cultures which may prohibit cross-departmental and cross-functional working collaborative working.
The range of data categories can also be extended or altered as you see fit in order to meet your business needs and domain. For instance, Pearson have a whole data category on learner and efficacy outcomes for all their educational-based products.44 This supports their global strategy that all products must demonstrate clear benefits to their learners. Tesco have a strategic category on contribution to local communities which is measured using performance scorecards on a store by store basis.45
Tip
As obvious as this may sound, ensure that seasonality is reflected in your growth hypotheses and data trends. For example, the 8-week Christmas period accounts for one third of annual sales in the fragrance industry.46 Also when measuring more complex lagging indicators such as efficacy or lifetime value of the customer (LTV), this might take more than a quarter. You will need to decide when a KPI measurement will be best measured in reference to time in order to be meaningful.
5.9 Metrics are people too
Out of all the things we did, the most important change was in how we thought. In simple terms, we reversed the flow of the company: instead of our work ending with the customer, it started with the customer. That basic principle embodied our desire to avoid letting them down again. We would do everything and anything to ensure that we knew what customers needed, and that we gave it to them before any of our competitors did – Sir Terry Leahy47
One of the points that can get lost when exploring data is that there are customers behind each of those metrics. As businesses scale, the focus on improving the numbers can lead to counterproductive behaviour. This is a particular challenge when it comes to handling financial metrics. There is often a lot of pressure to keep those profit numbers improving. Over time this pressure can lead to poor decision making and subsequently long-term loss.
A lot of companies fail to realise that you can improve profits in the short term, while destroying value in the long term. This is because profits are a ratio. They can be improved by revenue increases or by cutting costs. In a competitive market where the cost of switching is low, companies must avoid falling into the trap of increasing revenues by raising prices while not improving on the value they provide. Cutting costs can also lead to increased profit but a poorer service for customers. In a competitive market or a well-defined category, not balancing this ratio with customer value in mind can be costly.
Metrics are people too. Regardless of the Lean PLC stage we are in, the focus on customers must be ever present. As we deploy our growth tactics, we will be tracking our key metrics. However, we should also consistently get out of the building and talk to customers face to face. This is especially powerful when our growth tactics are not working. Instead of just trying different tactics to see what sticks, we should find our key customers and talk to them. The lessons learned will add more colour to our numbers and ensure that we keep delivering value.
5.10 Managing prioritisation through risk and value
No matter where your product is in its lifecycle, the environment, competition and future changes ahead will present risks and uncertainty. To help you adapt, apply and recognise new learnings and challenges that have emerged, we recommend regularly facilitating a prioritisation and roadmap review. These reviews should reflect your experimental outcomes and look to apply the learnings directly. There are a number of different practices and techniques that you can apply to facilitate prioritisation sessions and we have shared just a few below. The important points to consider when reviewing your priorities are:
- Evidence and data will reduce prioritisation subjectivity. Contribute learnings from previous experiments and surface examples containing antilogs (things that have failed in the past) and analogues (similar things that had worked in the past). Remember internal validation has limited to no value. There is no substitute for direct customer feedback.
- Re-state the problem you are solving for who and why. Overtime assumptions creep in and can blur the focus or goals previously set. It is beneficial to recap on the goals and outcomes to help re-prioritise goals as well as helping new ideas to be prioritised against.
- Ensure you have a cross-section of representatives. If you’re organising a group facilitated session, ensure you have a small, but decisive group which contains a spread of stakeholder and/or functional roles.
- Ensure you understand and are clear on the strategic objectives. When we engage in our day-to-day activities, many opportunities surface for pivoting. Although all learnings are captured, it is important to ensure the correlation with strategy is clear as this may affect stakeholder value and continued sponsorship.
With these suggestions in mind, below are some techniques you can apply to help prioritise your backlog.
Prioritising risky assumptions
Building upon the earlier exercises which explore the identification of risky assumptions, we should now have more information to work with being in Grow. Taking a similar approach, the following exercise which is a light version of a traditional risk monitoring approach, can be quite revealing and powerful to facilitate with your team. This is particularly useful when referencing risk as a confidence indicator when planning your product roadmap. To explore new risks and assumptions, the following six steps exercise can help your team prioritise what to do next.
- Business model review – Review your business model canvas and call out and untested introductions, opportunities, risks, changes as well as new learnings. For instance, to grow to the next level you may introduce a new channel or key relationship and may want to test the value of this before committing. You can also review any new inputs and learnings at this point around your business model as a whole.
- Learning reflection – Reflect on your growth hypotheses and learnings to date. Then review your proposed growth hypotheses for the next period 1–3 months.
- Capture outstanding assumptions – With your teams, individually list assumptions, goals and risks.
- Group visibility – Group all the results and list them on a board for everyone to see and input into.
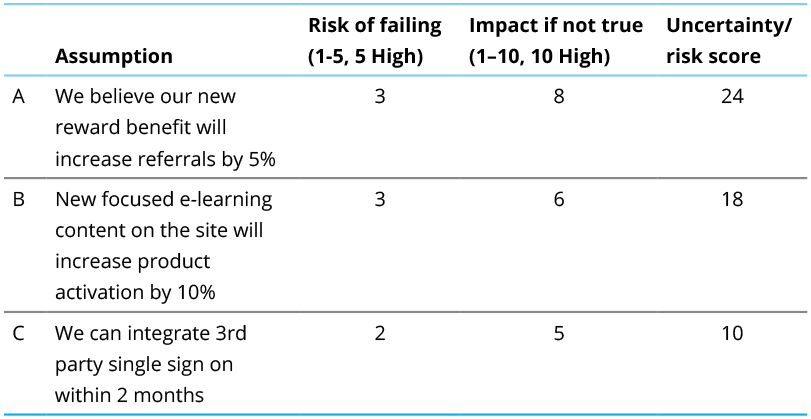
- Scoring – Score each item by the risk of failing and the impact to the business if not true. It is recommended that you establish and define a few examples for each scoring reference. For example, an item which has evidence of high risk of failure or conversely has no evidence to reference should increase the risk of failure to 5. The impact rating should be informed by the dependencies of its success against your business model projections. For instance, if you will cease to operate if regulatory needs aren’t met or you will put at risk continued sponsorship, then the outcomes of this should be scored 10.
- Refine – Discuss and refine through conversation as a team.
By applying evidence from learnings, antilogs and analogues, you are able to highlight a reasonable prioritised list to tackle next with an improved level of understanding. This fairly quick way to numerically quantify some of the risks, helps you prioritise your backlog for experimentation. It will also help invoke interesting conversations as a team, surfacing further insights whilst providing improved team alignment. You may be surprised to see what new evidence surfaces when facilitating these sessions.
Cost of delay and weighted shortest job first
Depending where you are on your growth path, another factor to consider is the cost of delay. This is useful where you have a lot of ideas channelled through a bottleneck competing for resources and need a logical prioritised path of value. When your business model has a level of increased certainty you will be able to call upon more evidence and lean more towards operational efficiency. This is where the weighted shortest job first (WSJF) can be beneficial as a prioritisation effort, especially considering the effort versus returned value.
Tip
Don’t make the mistake that many do by assuming you’re in a predictable state where assumptions are confused with facts. We recommend regularly reviewing your riskiest assumptions for the whole period that you’re in Grow. Therefore, however you prioritise, always consider data and evidence as a prioritisation qualifier. Where there is an absence of data and evidence, consider prioritising and obtaining this first. This should be a small investment in time and will reduce risk significantly.
The WSJF is a common practice advocated by larger agile development teams to capture value and prioritise the product backlog. This is further explained by Donald G. Reinertsen in his book The Principles of Product Development Flow.48 This approach considers the following three aspects when prioritising the backlog.
- Shortest job first (SJF) – The principle is to do the shortest job first where the jobs have the same cost of delay. If one were to do the longest job first, it would delay many short jobs and result in the ‘Convoy Effect’, delaying the overall time to value.
- High delay cost first (HDCF) – Where job durations are homogenous, but the cost of delay differs, it’s best to do the high delay costs first.
- Weighted shortest job first (WSJF) – When both duration and delay costs are different which is most common, the best approach is WSJF. Priority is based on delay costs divided by task duration. An example of this can be seen in Figure 5.2.
As further highlighted by Reinertsen, there are three common mistakes to avoid when implementing this process.

- Assuming the return on investment (ROI) alone should be used for priority where high ROI projects are prioritised over lower ROI projects. You should consider the sequence of the ROI and the sensitivity to profit. A project with lower ROI, but higher sensitivity to profit should go first. Overall portfolio ROI adjusted for delay is more important than an individual project ROI.
- In the absence of quantitative information, companies can operate on a ‘first in first out’ basis. Although simple, this is dangerous when jobs have a different delay cost.
- Some companies use a critical chain which allocates buffer time to each job and gives priority to the project with the smallest remaining buffer also known as minimal slack time first (MSTF). This aims to minimise the total number of projects that miss their planned schedules. This approach is not optimal when considering overall delay costs and projects with a higher cost of delay with ample slack time should take priority over projects with lower costs of delay, but with less slack time.
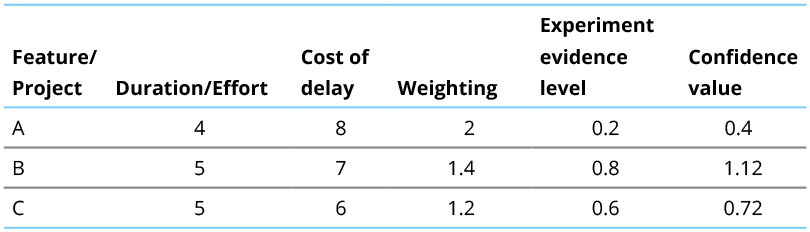
When taking a hypothesis-driven approach to calculating or estimating the WSJF, we would strongly advise that the values are informed by evidence. When working with some teams and particularly those in larger enterprises with reference to mature products, we advocate using evidence as a multiplier. This is particularly important if you’re operating within a complex or complicated domain as defined by the Cynefin framework’49 where discovery is expected. Evidence helps calculations of WSFJ to have a higher degree of certainty, removing some subjectivity from the scoring. Taking the example shown in Table 5.3, you can see how this can transform the previous priorities set.
Table 5.3 WSJF – evidence as a multiplier
To support the inclusion of evidence in a more structured format, we would recommend that you establish an agreed understanding of weighting towards the evidence provided using a confidence indicator. The more evidence and data provided the more confident you should be with your projected outcomes. Recognising this can help facilitate the emergence and realisation of risk which could reduce waste early. If something is deemed as high value for growth, then supporting evidence should be strong.
You should extend and contextualise your scoring system for your business and environment. It’s important that this is explicit and shared before any scores are applied. An example of such a weighting can be seen in Table 5.4.
The scoring guide is an example of how evidence can be considered. We weighted the cost of delay against effort equally to balance the investment to the outcome. The value of the confidence score is that it challenges the commonly observed practice where people treat estimates and numbers as fact. That’s not to say there is no value in estimation, but the added realisation of risk and confidence will encourage teams to experiment more.
Tip
Hierarchy is built into the cultural operating system of society and does influence behaviour and direction whether we like it or not. The consequence of this is that ideas born from HiPPOs (Higher Paid Person’s Opinions) are seldom challenged or refined to be more meaningful. This isn’t necessarily the fault of the individuals but is inherited through our cultural development of behaviours, experiences and the working system. Where failure isn’t accepted, few people like to take high risks, especially in situations where accountability is at play. In almost all our experiences dealing with HiPPOs, we have come to learn that the favourite food of the HiPPO is data! We actively encourage the collection and contribution of data for any proposed ideas and recommend you feed the HiPPOs!
Table 5.4 Confidence value scoring
Combining risk and value
Building on the technique above as an alternative to the confidence indicator, another useful exercise is to combine both the values above: impact uncertainty scores and WSJF. Whereas the WSJF in practice can sometimes omit uncertainty, the uncertainty score can omit the effort and duration and the benefits of WSJF. Where you have higher risk features, ideas, projects or stories it would be beneficial to experiment and obtain more knowledge before deciding to invest significant effort and detail. Taking the Risk prioritisation and the WSJF technique above, it can sometimes be beneficial to visually cross-reference the values. The following model illustrates this point.
Value-uncertainty prioritisation quadrant
In Figure 5.3 we are recognising that although there equally or similar weighted scores for both Risk, Impact and WSJF, when combined there’s a distinction which realises limited certainty and/or understanding. The top right quadrant recognises that there are three ideas which present a higher risk of uncertainty against higher value of return, measured by WSJF. One could argue that these ideas would need to be prioritised and explored further to reduce the risk which might position them in the lower right quadrant. Recognising this explicitly surfaces questions and uncertainty back to the stakeholders to not yet bet on these outcomes. It also implies more exploration and knowledge is needed before value can be realised.
Figure 5.3
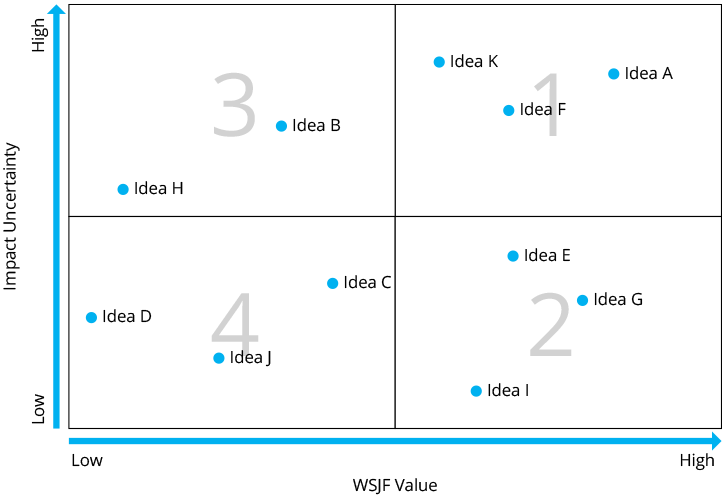
If prioritising the ideas above, the order of priority recommended would be to follow the number convention from 1–4 as a guide. Some subjectivity is required as the metrics informing the positions in the first instance are subjective. Taking the example of idea H against idea C, you might prioritise idea C first as the cost of delay in the WSJF may have more value than the risk exploration than idea H.
Tip
It’s important to note that evidence and inputs should be used to support the numerical projections above. Estimates alone without qualitative evidence to help quantify your backlog of ideas will limit the value of prioritisation.
5.11 Managing a nonlinear adaptive state
With all the best projections and plans, in each Lean PLC phase you are highly likely to be in multiple states simultaneously while you expand your business and execute. In the digital economy, nothing stays still for very long and therefore it’s important to recognise the constant need to adapt and respond. Not only are you looking to make unknowns become knowns, but your environment could also reduce the lifespan or relevance of some knowns over time.
Providing insights into understanding your domain state and how to operate successfully to build successful products in this space can be established through the support and reference of the Cynefin Framework.50 This framework identifies five domain states.
- Simple/obvious – Represents known-knowns where the relationship between cause and effect are clear. This domain advocates best practice through ‘sense–categorise–respond’ behaviour.
- Complicated – Represent known-unknowns where analysis and/or expertise is required to understand the cause and effect relationship and then apply appropriate good practice. The framework recommends ‘sense–analyse–respond’ behaviour.
- Complex – Represents unknown-unknowns. The cause and effect relationship can only be understood in retrospect within this domain. The framework recommends ‘probe–sense–respond’ behaviour. This can be achieved through safe to fail experimentation.
- Chaotic – The cause and effect relationship are unclear and as such a knowledge-based response cannot be applied, and any action is the most appropriate initial response to establish order. The framework recommends ‘act–sense–response’ behaviour which allows the responder to use the established order to then sense and better understand the situation then respond accordingly which will move the domain to being complex.
- Disorder – Unclear which domain applies and there are multiple perspectives in conflict. It’s recommended that event or situation is dissected into parts and distributed appropriately to each of the other four domains.
This sense-making framework provides much depth and realisation into the preferred paths and ways of working when you identify your product and business model context. It is also possible to be in more than one state at a given time depending on what level of granularity you observe. For example, your customer services team could be operating within the simple domain, while R&D operate in a complex domain and your business model across all domains across its respective areas. It’s worth noting that your domain state can change over time with environmental influences. This is why we recommend reviewing your strategy, vision and tactics on a regular basis.
The common overall domain state of product development when in the Grow stage of the Lean PLC is often likely to be weighted towards the complex and complicated domains. This is due to the inherent complexity of product development and management, coupled with emergent complexity and knowledge around your business model and environment in Grow. These domains reveal more than one right answer to any given problem or hypotheses and advocate the recognition of assumptions to be explored and validated. Recognising which state you’re in will help inform preferred operational practice. The realisation that product development in the Lean PLC phases from Idea through Grow is complex to complicated is recognition that you’re exploring known-unknowns and unknown-unknowns; where the learning in the latter state by definition can only be obtained in retrospect.
A common mistake that businesses make is assuming they are in a complicated or simple domain where there are fewer unknowns. They operate where exploration, discovery and change are unwelcomed or not expected and then default investment to longer term plans which are highly detailed. The Lean PLC on the contrary advocates emergence and continuous learning, particularly through Idea to Grow. This supports the behaviours of probe–sense–respond (complex domain) or probe–analyse–respond (complicated domains) to improve the chances of success and maximise learning. This is why the similarities of build–measure–learn practices and the scientific approach of hypothesis-driven development can be exploited to maximise your potential from Idea through Grow Lean PLC phases.
5.12 Capturing your product roadmap
Your product roadmap is an extremely powerful and a living artefact which impacts every function in your organisation. It’s a declaration of all the knowns and unknown outcomes ahead, built on the presumption of the most valuable return on the investment of effort contributed. Don’t get misled by the term ‘Product’. The Product Roadmap is the path of value delivery which an entire business is undertaking. The ongoing delivery of the product is the repetitive transaction of value between the customer and business. Your roadmap is the one true reflection of all the points previously discussed, disseminated into a clear and transparent sequence for all to see and contribute towards.
In order for the Product Roadmap to be most effective, there are some common attributes which should be sought and employed. An effective roadmap should be simple and need little or no explanation to those consuming it. The following list of properties should be considered when forming and supporting your product roadmap.
| 1. | Prioritised: | |
| (a) | What have we completed? | |
| (b) | What are we currently working on? | |
| (c) | What is coming next and why with clear strategic alignment? | |
| 2. | Engaging – Clearly articulating value and supporting activity undergone and to be discovered ahead against a clear goal and purpose of what and why something is being delivered or achieved. | |
| 3. | Accessible – Roadmaps should align product organisations and promote engagement. Therefore, they should be accessible and available to a wide audience and in a language which requires little or no explanation. | |
| 4. | Up to date – There should be one single source of truth which is up to date. A more up to date roadmap will likely encourage more engagement and contribution. | |
| 5. | Strategic – The product roadmap is a strategic artefact which communicates how you are delivering on your strategic objectives. Stakeholders should be able to clearly understand how the product roadmap seeks to deliver value against the strategic goals set. | |
Although a single roadmap is desirable, in larger organisations it’s likely that you will need to expand the details and provide different views of granularity for the different viewers. As companies need to be more adaptive to change and are becoming learning organisations, using tools which are more open to discover value and explore outcomes and respond to change are more effective for the Grow phase of the Lean PLC. A useful tool to use is the Go Roadmap by Roman Pichler.
Go Roadmap
The benefit of this approach is that the Go Roadmap is goal orientated which allows teams to inspect and adapt as they delivery to shape to best solution for the desired outcome. Supporting the explanations during Explore, Validate and Grow, the Go Roadmap also supports a hypothesis-driven approach with key measurements and metrics for review. It’s also at a high enough level that it can be shared across a broader range of your organisation.
Figure 5.451
If you are working in larger organisations need to communicate intentions and state across many locations and people, you may want to use a digital tool. There are many options available and the choice of tool should be carefully selected not to compromise the principles expressed in the Lean PLC. Using a tool shouldn’t replace the behaviours and working practices advocated, but should be used to complement them and to add value.
A useful roadmap tool which we have used with some teams is http://www.aha.io, which offers a range of solutions which support goal orientated product roadmaps with references to business model. Another powerful capability of this tool is that it can translate and provide different views and granularity levels of the same path. Having multiple views presented from one single source of truth can be useful.
Whatever roadmap tool or technique you use remember you employ a tool to work for you and not the other way around! The practices shared during this book are advised as paramount over the use of any tool chosen. A Gantt chart of any kind is not a defined path of the future, but a shared snapshot of understanding at a given time. Another way to look at this is that the roadmap is simply a list of questions yet to be clarified to achieve the value desired.
A useful tip employed by many teams is to explicitly communicate certainty on the roadmap itself to ensure that the roadmap doesn’t end up being a contract of delivery. An example of this is shown in Table 5.5.
5.13 Entering new markets
Another way to accelerate and expected growth is to enter new markets. Common questions surface when mapping products to a stage in the product lifecycle around whether a product should be mapped by distinct markets. As a general rule of thumb, new markets present new and sometimes very high risks and differences which should to recognised. There are countless cases where very successful products and businesses in one market dramatically fail are constrained or choose not to operate in distinct markets.
By way of example, the tech giant Google who have well publicised success on most global regions, pulled out of China in 2013, despite the Internet user base of China being twice the residency population of the USA.52 Another retail and tech giant Amazon which is no doubt the default online destination for purchasing goods and maybe the distribution channel you purchased this very book from, has only recently entered and expanded in Brazil.53 This is due to the unique challenges and difficulties faced in this market place. Both these giants carefully made their decisions knowing the growth model in each of these markets is unlike the other markets they have success in and needed to refine their business model or review the strategic impact.
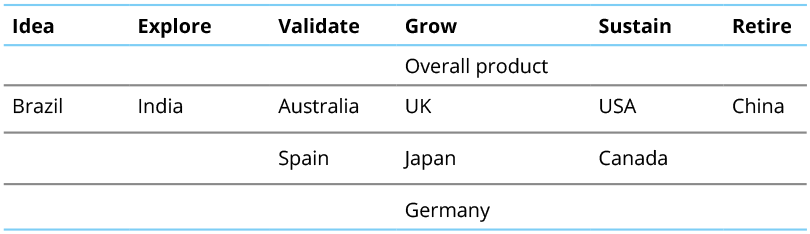
Wherever you are in the lifecycle, when entering a new market we would advocate that you start from Idea to explicitly recognise there are unknown-unknowns which will need discovery and validation. This doesn’t mean that the product shifts its stage in the lifecycle, but simply means that each market can be in a different stage. You can have a product in more than one product lifecycle stage at a given time. Let’s say for instance you are in Grow and you have a product in the USA, but you want to go to Brazil. Your product overall and a high level would be in Grow (total combined growth), but in one market it could be in Explore (Brazil) and another in Grow (USA). Let’s take a look at the following example:
In Table 5.6, the product and business model is being refined and contextualised per market, but overall is considered to be in Grow. Collectively this declares that the product and business is expected to see growth. Market contextualisation is a key factor in success and which speaks to the reasons why Amazon may have taken longer to expand into Brazil.
What defines a new market?
- A new geographical boundary where your product does not yet have a presence. If you have a product which is serving a market, such as the USA and you would like to start selling in the UK, this would be defined as a new market. The UK entry should start from Idea and evolve through the Lean PLC stages utilising the governance and principles provided.
- A new market, could also be a new demographic in an existing geographic boundary. If you currently serve a particular user base such as consumers in the USA and now you would like to serve business users in the USA, this would be considered a new market.
Tip
If managing a product portfolio or multinational product in the Lean PLC, you can change the lens by market and the collective view. In fact this is strongly encouraged in order for you to not make the explicit separation by market, and reducing the risk of wrongly assuming that the current business model need not be refined. In each market your product could be in a different Lean PLC stage, but overall if you are growing your market share it could be collectively in Grow. From a financial perspective in the portfolio, you can set growth hypotheses per market and overall for the product as a collective. Generally this reduces the risk of financial investment by assumption.
A case study: Monzo in Grow
An example of company executing in the beta phase of Grow at the time of writing is the disruptive FinTech company Monzo (previously known as Mondo). This rapidly growing company which raised its first £1m in just 96 seconds via crowdcube.com in March 2016,54 is growing a bank in beta and could be referenced as being at the early stage of Grow in the product lifecycle.
Distributing approximately 1000 debit cards per week and managing a customer waiting list of 52,000 people, Monzo clearly have found a value proposition which is attracting huge interest. They also have to grow at a sustainable rate they can support, while keeping customers interested and engaged in a very competitive environment.
Monzo have extended their capability to scale by harvesting a community knowledge base at community.monzo.com. Monzo’s community strategy is a very tactical growth programme, helping Monzo to accelerate and learn fast. Members suggest product improvements, report issues and even support each other in solving issues that arise creating a continuous cycle of improvement with validated customer input. This gives Monzo a lot of insight into what is the next most important thing to develop and improve and where there is huge value to be obtained. In August 2016 they obtained their much-anticipated banking license. As such they are required to mature their business processes and technologies to improve compliance and risk management to satisfy regulatory authorities and third-party interfaces. Such practices will likely be expected from the early majority and beyond where higher quality and standards are expected for product adoption. Their continued customer expansion is matched by their ability to continuously learn.
5.14 Prepare for sustain – when growth slows down
Our hope is that our product grows and continues to grow for many years. But nothing lasts forever. At a certain point, the product will reach a level of maturity in the market and growth will slow down. Recognising whether you’re in Grow or Sustain is important for Lean PLC management. This helps align expectations and goals so that appropriate resourcing, investment, support and revenue projections can be considered.
It is also important to note that, unlike the Lean PLC stages on the left side, moving a product from one stage to another on the right side is not based on teams making the decision and bringing the product to the council. When a product is on the right side of the PLC, it may remain in Grow or Sustain for many years. As such, Lean PLC governance on the right side is done via quarterly, bi-annual and annual reviews. The cadence of the reviews depends on the size of the company and the business models of each product.
At each review, the product council or investment board can analyse the performance of the product and make decision. Below are some key points to consider during these reviews in terms of making the decision to move a product from Grow to Sustain.
The move from Grow to Sustain raises one fundamental question: How can we maintain revenues and profits while reducing costs? This also raises fundamental product roadmap questions. As such, as we prepare to move to Sustain we should be able to answer the following questions.
- How can you reduce your team size and other operational costs?
- Does your roadmap focus on maintaining customer numbers, satisfaction and engagement? Is your roadmap weighted too heavy on discovery over execution?
- Entering new markets would automatically position your product into Grow. By declaring your product in Sustain, you may be declaring that you are not attacking new markets as defined in Grow.
- If you’re a digital company, how will your product keep pace with the third-party delivery platforms? Consider the frequent releases operating systems, user interface (UI) capabilities and evolving application programming interfaces (APIs) that your application might rely on.
- How will you defend market share and what indicators will you need to monitor for early signals to respond to? How quickly can you react to change?
With these captured and defined, you’ll need to monitor and manage the transition from Grow to Sustain. This rarely happens quickly and should be handled and coordinated to assure you are seeing the impact of changes and that you’re limiting the negative effects on the company. Remember that products in Sustain should be profitable with optimised margins and operations.
SUBMISSION TEMPLATE
Grow to Sustain SUBMISSION
Product ownership
| Investment board | |
| Business sponsor | |
| Product owner |
Idea overview
| Product name | |
| Idea description | |
| Strategic fit |
Product performance
Please describe the financial performance of the product to date.
| Revenue | Costs | Profit | |
| Forecast | |||
| Actual (or re-forecast based on actuals |
Growth lessons learned
Provide an overview of the growth hypotheses that you have tested since the last review and the lessons you have learned.
| We believe that: | |
| To verify that we: | |
| And we measure: | |
| We learned that:55 |
Unexpected learnings
Provide a summary of the unexpected learnings you got during Grow.
Sustain hypotheses
Provide an overview of the assumptions about Sustain that you plan to test in the next stage.
| We believe that: | |
| To verify that we: | |
| And we will measure: | |
| We will know we are right if: |
Financial projections
Since you are asking to move to Sustain, please complete the financial data below.
| Expected revenue over 3 years | Expected costs over 3 years | Profit margins over 3 years (%) |
Resources and funding requested
To Sustain the product, we are asking for (e.g. dollars, time, people):
* Please note that you also have the option to remain in Grow, go back to Validate or move straight to Retire. If either of these options are what you are choosing, then you need to adapt this template so that you can update the product council on work done so far, key lessons learned, what you plan to do next and the resources you need.

An interview with:
Marc Abraham, Chief Product Officer at Settled
Marc Abraham is an experienced product management practitioner, who has worked for a large number of successful digital organisations – at 7digital, carwow, Beamly, World First, notonthehighstreet.com and currently at Settled. Marc writes about his learning and digital trends on his blog at marcabraham.com. We caught up with Marc to find out what lessons he has learned in his experience of working to grow successful companies from idea to scale.
Please tell us a bit about your experience with scaling products. How tricky can that be?
It’s funny, because I sometimes hear people say that reaching product–market fit is the hard part, and that scaling beyond that point is the easy bit. I have experienced first hand how tricky the scaling of a product can be, and it doesn’t matter whether you are working at an early-stage startup or a big corporate. I guess the mistake people sometimes make is that it isn’t just about scaling your product, it’s about scaling your business.
That is interesting. Please tell us about some challenges teams can face when attempting to scale and how they might overcome them.
From scaling numerous products, I have learned that ‘market-fit’, being in a good market and satisfying that market, is far from enough. Suddenly competition starts to erupt from everywhere and the things that brought you success initially are no longer sufficient. This is why:
Challenge 1 – Scaling the back end of your product: I once worked at a company where the engineers had their own internal nickname for the technical infrastructure which underpinned their product. Trust me, it was not a flattering nickname! In their effort to get to market-fit as quickly as possible, they had made lots of shortcuts in building the technical platform with elements that were not reusable. As a result, building on the successful, first version of the product was very time consuming; even the smallest of product changes would take require a month on average!
My suggestion here is to have a wider plan in which your MVP fits into. I strongly recommend not treating your MVP as a one off, and ‘just throwing something out there’ to see if it resonates. Instead, treat your MVP as part of long and successful sequence of product iterations. I often compare it with wanting to have a number of special marbles in a jar. If that is your desire, I suggest you start working backwards to figure out how you get your first marble and how to go from there. The same applies to delivering value to the customer; you can wait till you can deliver lots of customer value in one go, or you can unlock value early and often.
This approach forces you to consider the reusability of your first product iteration - both from a front and a back-end perspective. This approach will enable you to make well informed scaling trade-off decisions right from the outset.
Challenge 2 – Compliance is part of a grownup product: I hold my hand up for releasing a product iteration which breached some fairly significant data laws … Luckily, we found a solution very quickly and avoided causing any damage to our customers. However, it taught me a valuable lesson that whilst it might be ‘fine’ to not worry too much about complying with data and security legislation when you have got 10 users, that becomes a whole different story when you have got 10,000 users!
What I’ve learned from this error, is that by including ‘compliance’ in your definition of ‘DONE’ of a product or feature, you’re less likely to treat data or legal compliance as an afterthought. For example, I am currently working on enabling homeowners to enter their property details online. Even though the current focus is on launching an MVP, we are already thinking about how the home data will be stored securely and protected.
Challenge 3 – Customers expecting more and better: I once worked on a project where we were creating a ‘second screen’ app, which offered TV viewers with extra content related to whatever they were watching on TV. When we initially launched the app, our users were happy with its functionality and content. However, over time, our user needs evolved: instead of using the app for additional content during the airing of a show, people started using the app before and after the show, interested much more in chatting with other people about the show that they had just watched. I feel this a great example of a product that had reached product–market fit but then needed to evolve with user needs.
I know it sounds obvious, but I’ve found ‘curiosity’ to be the best antidote to thinking that you have figured out what customers want and that you simply need to iterate on the product that helped you achieve product–market fit. User needs and problems aren’t static and you need to be constantly learning about the customer. Don’t get me wrong, I’m not suggesting you should go into ‘analysis paralysis’ mode. Just speaking to 3–5 (prospective) customers per week, will give you a wealth of information and new insights which you can feed into the ongoing development of your product.
Challenge 4 – Revenue growth needs to continue: When you’re trying to get to product–market fit, it’s easy to fall in the trap of focusing more on market share than on a sustainable revenue model or profit margins. For example, I worked at a company once which had grown rapidly on the back of a product with very small profit margins. As the market started becoming much more saturated, we needed to move quickly and evolve both pricing model to make sure that we could continue growing the business in a sustainable manner.
Not forgetting about your business model, sounds obvious I know. But I’ve learned how the hard way that you can get very closely to precipice with your business if you haven’t at least thought through a high-level strategy of how you’re looking to make money beyond the MVP and product–market fit. For example, whenever I have good idea for a product or a problem I want to solve, I force myself to take a step back and ask myself ‘Are we going to make money off this? If so, how?’ Even if you don’t have all the answers at this stage, that’s fine. It will at least give you a direction of travel with respect to your overall business model and value proposition.
Thanks for sharing your insights. It has been very helpful. If you had to summarise some of your learnings regarding scaling, what would be your one final thought?
To quote the great Kathy Sierra, ‘Don’t make a better [X], make a better [user of X].’ Because of some of the scaling challenges that we talked about, there’s a risk of neglecting some of the aspects which brought you market fit in the first place. It’s easy to introduce a slightly worse customer experience, just because you want to generate more revenue, for example. Even if you might reap some benefit from this approach in the short term, I don’t believe it will help scale your product and business in the long term.
In order to not fall prey to this trap, I strongly recommend having a high-level product strategy from the outset. Naturally, this strategy is likely to evolve and that’s absolutely fine. If anything, thinking strategically right at the beginning will urge you think about scaling and will give you an initial path to bear in mind, well before you’ve achieved product–market fit.)
____________________
37 Bulygo, Z. (2012). The 7 ways Dropbox hacked growth to become a $4 billion company. Kissmetrics Blog. Available at https://blog.kissmetrics.com/dropbox-hacked-growth/
38 Ries, E. (2011). The lean startup. New York: Crown Business.
39 Kissmetrics Blog (2016). The 7 ways Dropbox hacked growth to become a $4 billion company. Available at https://blog.kissmetrics.com/dropbox-hacked-growth/
40 Patel, N. and Taylor, B. (2017). The definitive guide to growth hacking. Quicksprout. Available at: https://www.quicksprout.com/the-definitive-guide-to-growth-hacking/
41 Hubbard, D.W. (2014). How to measure anything: finding the value of intangibles in business. Hoboken: Wiley.
42 McClure, D. (2010). ‘MoneyBall for startups: invest before product/market fit, double-down after.’ Master of 500 Hats. Available at http://500hats.typepad.com/
43 Sutherland, J. and Schwaber, K. (2016). The Scrum guide. Available at http://www.scrumguides.org/docs/scrumguide/v2016/2016-Scrum-Guide-US.pdf
44 Efficacy and research at Pearson. Available at https://www.pearson.com/corporate/efficacy-and-research.html
45 Tesco on supporting local communities. Available at https://www.tescoplc.com/tesco-and-society/supporting-local-communities/
46 Blitenthall, M. (2016). The sweet smell of success. Available at http://www.nielsen.com/nz/en/insights/news/2016/the-sweet-smell-of-seasonal-success.html
47 Leahy, T. (2013). Management in 10 words. London: Random House.
48 Reinertsen, D.G (2009). The principles of product development flow: second generation lean product development. 1st edition. Celeritas Publishing.
49 Wikipedia (2017). Cynefin framework. Available at https://en.wikipedia.org/wiki/Cynefin_framework
50 Snowden, D.J. and Boone, M.E. (2007). A leader’s framework for decision making. Available at https://hbr.org/2007/11/a-leaders-framework-for-decision-making
51 Pichler, R. (2016). Strategize: product strategy and product roadmap practices for the digital age. London: Pichler Consulting.
52 The Atlantic –Waddell, K. (2016). Why Google quit China—and why it’s heading back. Available at https://www.theatlantic.com/technology/archive/2016/01/why-google-quit-china-and-why-its-heading-back/424482/
53 Bloomberg-Moura, F. and Sciaudone, C. (2017). Amazon expands in Brazil, making worst-kept secret official. Available at https://www.bloomberg.com/news/articles/2017-10-18/amazon-expands-in-brazil-making-worst-kept-secret-official
54 Mondo reaches £1m in 96 seconds in record breaking raise | The Crowdcube Blog. 2016. Mondo reaches £1m in 96 seconds in record breaking raise | The Crowdcube Blog. Available at http://blog.crowdcube.com/2016/03/03/mondo-reaches-1m-in-96-seconds/
55 Osterwalder, A., Pigneur, Y., Bernarda, G. and Smith, A. (2015). Value proposition design. New York: John Wiley.