
THREE
Research Methodology and Data Collection
The research method we chose to address the raised research questions and to finally test our hypotheses are discussed in this section. We took a quantitative approach to analyze the role and influence of a project manager's PVM across many different projects within different industries.
Data Collection Method
A survey instrument was developed and data were collected during 2008 and 2009 from many different projects across a variety of industries, including manufacturing, software, and telecommunications, and from many different organizations. One of the major goals was to obtain a large-scale sample, allowing for advanced statistical analyses. To achieve a high return rate, and to have some control over the data collection process, we recruited the participants of this study from among part-time graduate students studying and/or earning their certifications in project management while working in industry. They were instructed as to how to conduct the data collection, and their questions about the data collection process were answered directly by the principal investigators of this study. The questionnaires were distributed to them as hardcopies or, if requested, as files via e-mail.
For the purpose of this research, we found it necessary and important to require multiple sources of data. As the focus of this study is a project manager's PVM, it was important to collect data based on the perceptions of several members of a project manager's team regarding which project-related decisions were made by the project managers. Also, what considerations were taken, and what decisions could or should have been made. To prevent single-informant bias issues, the contacts for this study (representatives from the participating companies) were asked to identify five project members and each of those five was asked to return a completed questionnaire. In each case, the group of five was composed of three key members of the project team, the project manager, and the senior manager (sponsor) responsible for funding the project. All respondents received the same questionnaire to avoid confusion in the data collection process on the side of our contacts. Due to their direct involvement, these respondents were believed to be the most knowledgeable about the project decisions and processes. Further, given that project team members and project sponsors were directly affected by project decisions and processes, understanding their views about the PVM and the project results was most important.
Finally, to ensure a reasonably comparable level of familiarity with the projects across the sample, project members were instructed by the contact person to choose a project with which they were most familiar and involved throughout its implementation. This retrospective methods approach is identical to many empirical studies conducted in project settings (e.g., Meyer & Utterback, 1995 and Tatikonda & Montoya-Weiss, 2001). To improve the accuracy of retrospective reports, respondents were asked by the contact person to select recent projects, in order to control for the elapsed time between the events of interest and the data collection.
Data for this study were mainly collected in the United States and from 10 projects in China. The Chinese participants were also graduate students, in a master's degree program with a concentration in project management at a partner university in Beijing. The total sample obtained so far is 646 questionnaires (596 in the United States and 50 in China). The U.S. sample includes responses from 387 core team members, 114 project managers, and 95 senior managers, and the Chinese sample includes responses from 30 core team members, 10 project managers, and 10 senior managers. Actually, the original number of collected questionnaires was higher, but 21 cases had to be rejected because they were incomplete or had other serious quality issues (e.g., questionnaires that were filled out by the wrong respondents, or questionnaires that included information on different projects) and did not meet the requirements for the project characteristics. These 21 cases were excluded from further analyses. The final U.S. sample used in our further data analyses includes the data of 114 projects and consists of 104 mainly successful and 10 clearly unsuccessful projects. Some unsuccessful projects were possibly not reported because they were never completed. Such restriction in range tends to impact correlations more than regression weights and path coefficients, and consequently we do not expect seriously distorted results.
The participating project members worked on new product development projects (20%), software development projects (28%), construction projects 10%, and systems development and implementation projects (31%) across many industries. Over 60% of the projects were implemented for internal clients, and 7% were implemented for international clients. All projects had a budget of at least $500,000 and their duration was at least three months, with an average of 18 months. The projects consisted, on average, of nine core members who were responsible for specific tasks throughout the entire implementation of the project. On average, six departments were involved in implementing the projects, demonstrating the multifunctional characters of the projects.
Research Methodology
One of the main challenges we faced during this research project was the measurement of a project manager's project value mindset (PVM). Since the PVM is not directly observable and, despite our intensive search, we did not find any published measurement tools that were appropriate for this study, we had to develop the measurement instrument ourselves. Over the course of this research project we incorporated many different steps to develop a valid and reliable measurement tool.
In the organizational behavior science field it is quite common to use Likert-scales to measure a respondent's feelings or attitudes about a variable that is not directly observable. Each Likert-scale consists of several questions, called “items.” Each item describes a continuum between two extremes from “Strongly Disagree” to “Strongly Agree.” The respondents must indicate how closely their feelings match the question or statement on a rating scale consisting of numbers ranging between 1 and 5 or higher. During the summer of 2006, a 118-item questionnaire was developed. A pilot-scale investigation was performed in the fall of 2006 and spring of 2007 to evaluate the quality of the survey instrument. In total, 30 respondents with project experience were asked to provide detailed feedback on how they understood the questions. Based on this investigation several minor modifications were made to improve the survey instrument. Besides rewording some items, we expanded the survey instrument to 120 items.
The analyses of the data were conducted in several steps. In the first step, the quality and final configurations of the measurement scales were determined. This step was conducted on the full sample of 596 surveys. Several statistical tests were used to analyze the quality of the measurement scales. In the second step the constructed scales were used to analyze the proposed relationships between the model variables depicted in Figure 1.
The first step tested the developed measurement scales for validity and reliability. Reliability refers to the consistency of a measure, and a measure is considered reliable if the same result is received repeatedly. Cronbach's Alpha test was used to assess the reliability of the measurement scales. It is a test commonly used as a measure of the internal consistency reliability of Likert-scales. Values below .70 would lead to a rejection or modification of the constructed scale. Values above .80 are acceptable and above .90 are deemed very good. The value of Alpha is not related to the factorial homogeneity because it depends on the size of the average inter-item covariance, while unidimensionality depends on the pattern of the inter-item covariances.
For the latter reason, we used the Principal Component Analysis to investigate the construct validity of our measurement scales. The test of validity is important, as it tests if the measure actually measures what it proposes to. Validity cannot be evaluated by one single test, and several aspects of validity are important. In this step we are interested in testing the construct validity of the measurement scales. It demonstrates whether all single measures (items) are measuring a theoretical construct, like the mindset of a project manager. Principal Component Analysis was conducted to test for construct validity. The factor was accepted and not further modified only if it achieved an explained variance of at least 60% and all factor loadings were at least .7 for each individual item or each component of a scale.
In the second step of the data analyses all scales were aggregated to the project level. The responses of the project managers were used for the specific project information (name, size, etc.) and to replace missing values in the individual answers. Otherwise, to avoid any respondent-specific bias, only the responses of the team members and the senior managers were aggregated by calculating the mean across the developed scales of project value, PVM, and exploited opportunities. The aggregated scales were used as the input for the final data analysis step. To test the derived research hypotheses we used the Structural Equation Modeling (SEM) technique. This technique allows the simultaneous testing of interactions between several model variables. Furthermore, it is “quasi”—that is, a combination of a factor analysis and a regression analysis, allowing us to include the measurement errors of all model variables to test the influence of a latent variable (not directly observable variable) on other similar constructed variables. The advantage is that the estimates are more accurate, since a total aggregation of different scales measuring a variable is not necessary and specific measurement errors could be included in the estimation without distorting the estimates. This is particularly necessary for the PVM variable in our study. The results of the SEM are direct tests for our hypotheses. For the model estimation we used LISREL (Linear Structural Relationships) version 8.51. LISREL is a statistical method that allows simultaneous analyses of hypothesized causal relationships for multiple variables (Jöreskog & Sörbom, 1993). The use of SEM also offers several test statistics to evaluate several aspects of the validity of the measurement scales. In particular, we used it to test for criterion validity by checking if the proposed causal relations are indeed of statistical significance (predictive validity) and if the constructs (model variables) are clearly explained by the several scales (concurrent validity).
Measures for Project Value
The achieved project value is a complex and multidimensional construct that is difficult to measure, and many different alternative measures for project success are suggested. Pinto and Mantel (1990) identified three distinct aspects of project performance: (a) the implementation process, (b) the perceived value of the project, and (c) client satisfaction with the delivered project outcome. Shenhar, Ofer, and Dvir (1997) suggested four different criteria to assess project success: (a) meeting design goals, (b) benefits to customers, (c) commercial success, and (d) future potential. Even though there is no consensus about the scales to be used to determine project success, it is commonly agreed, as the examples from the literature show, that multiple measures are necessary. Following this line of thought, project value was measured using four different scales that we derived from the literature review and also using the 19 different items shown in Table 2, which were developed during our conceptual discussion of the project value paradigm.
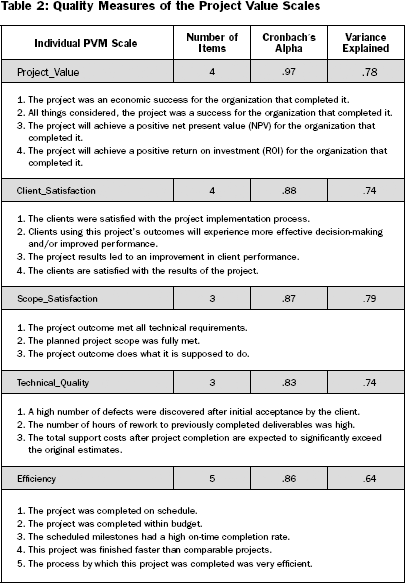
The scales of efficiency, satisfaction with scope, and technical quality are standard measures of the TC-paradigm. However, contrary to the conceptual TC-paradigm, time and budget are not independent measures; rather, they are highly correlated. The empirical data demonstrate that both are alternative measures describing the efficiency of a process. Five items are used to measure project efficiency. The statistics for the Efficiency scale which tested reliability and construct validity reached satisfying levels.
Originally, six items were developed to measure a project's Effectiveness. However, an orthogonal factor analysis with varimax rotation of the effectiveness items yielded two different factors representing different aspects of project effectiveness. One scale measures the achieved technical quality of the project output, and the other scale measures the level of satisfaction with the fulfillment of a project's scope requirements. The first and third items used are from an Effectiveness scale developed by Pinto (1986). In summary, both Effectiveness scales satisfy the statistical criteria for reliability and validity.
Client satisfaction as a success criterion is mentioned by many authors and represents an extension of the TC-paradigm. The perceived client satisfaction was measured using four items. The first three items were adopted from Pinto's (1986) client satisfaction scale. As demonstrated in Table 2, the Client_Satisfaction scale satisfies all statistical requirements.
The fifth scale measures the perception of the value the project has created for the organization that implemented the project. The implementing organization might not necessarily be the project owner. The Project_Value scale consists of four items and, as shown in Table 2, it satisfies the discussed requirements for reliability and validity.
The scores for each scale were calculated by averaging the scores across the single items of each scale. These values were used as a basis for the statistical analyses that followed.
Measures for Project Value Mindset Components
The PVM definition indicates that operationalization of the variable PVM to test the research hypotheses is complex and requires several scales representing the different aspects of PVM. This problem constitutes one of the major methodological challenges of this study: How to measure the PVM of a project manager.
In this step we are building a comprehensive measurement model consisting of several measurement scales. In total, seven different scales were developed based on 29 items to measure the PVM of a project manager. The scales correspond with the different conceptual components discussed in the sections above.
Table 3: PVM Component—PVM Scale Relationships
Conceptual PVM Components |
Empirical PVM Measurement Scales |
| Opportunity Disposition | Value_Opportunity_Search—project manager seeks out ways to improve efficiency and effectiveness, which should result in lowering the budgeted costs, shortening the time, or improving the functionality for the benefit of the managing firm and client. |
| Overachievement Disposition | Overachievement—project manager seeks to overachieve the original objectives. |
| Dialectic Requirement Disposition | Strategic_Gap_Analysis—project manager puts effort into understanding the requirements that are beyond the written scope statement and that are relevant for the achievement of project value. |
Specifications_Analysis—project manager seeks, at the project start, inconsistencies and looks for accuracy; anticipates missing data or project requirements. |
|
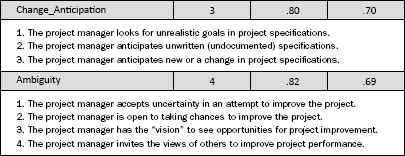
| Ambiguity Disposition | Change_Anticipation—project manager consistently tries to anticipate sources of change. |
Ambiguity—project manager is not risk-averse and if an opportunity occurs is accepting uncertainty to increase the value of the project. |
|
| Traits | Traits—Adapted from the Five-Factor personality characteristic, attitudinal views, and attention to detail. |
Two components of the PVM concept are measured by two scales. The Dialectic Requirement Analysis is measured with the Strategic_Gap_Analysis and the Specifications_Gap_Analysis. The first scale measures attitudes and activities to specify or seek out project requirements that are not formally defined. These activities consume resources that are most likely not considered in the project plan, and therefore it is the project manager's decision to “invest” in these activities. Since the investment of resources in these activities could be seen as a strategic decision, the scale is called Strategic_Gap_Analysis. The other scale measures activities and attitudes to adjust, modify, and identify project specifications and is therefore called Specifications_Gap_Analysis. The literature differentiates between specifications as technical issues and requirements that are broader, including nontechnical issues as well.
The ambiguity construct is also measured with two scales. The Ambiguity scale represents the positive attitude of a project manager toward uncertainty. The Change_Anticipation scale represents the avoidance of changes by anticipation. The latter stands to some extend as a contrast to ambiguity.
The only scale that was not developed for this study is the traits scale. It was adapted from a Five-Factor personality scale (AAI, 1999) and used to measure a project manager's traits. The scale used for personality trait determination is composed of a list of standard adjectives, one for each of the “Big-Five” in the Five-Factor Inventory. The traits are: Extraversion, Openness, Stability, Conscientiousness, and Agreeableness. This scale has achieved good results in other empirical studies which one of the authors has conducted over the past 10 years.
The analysis conducted to construct the scale used to measure a project managers PVM (illustrated in Table 4) was a two-step process: First, the individual scales measuring the different components of the PVM were developed. In the second step, we tested these scales to determine if they represent the mindset of project managers as a group.
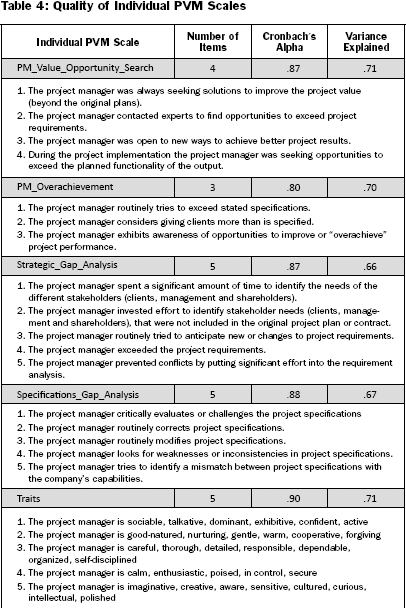
The developed individual PVM scales achieve good to very good Alpha values, as the statistical values in Table 4 demonstrate, indicating that the developed scales could be used for further analyses.
Aggregated Measures for Project Value Mindset
In this section we combine the different scales measuring specific aspects of a project manager's value mindset with the Project-Value-Mindset scale. Several statistical tests were conducted to determine if these scales are indeed representing the mindset of project managers.
Both statistical scale tests, the Cronbach's Alpha test as well as the PCA, indicated that the scale PM_Change_Anticipation had to be removed from the final PVM scale. The inclusion of this scale lowered the Alpha to an unacceptable level, and it also lowered the portion of explained variance estimated with the PCA, indicating that the project manager's change anticipation could not be statistically integrated into the overall PVM scale. From a practical perspective this result is consistent with our whole discussion. The relative low variance of the PM_Change_Anticipation scale indicates that the anticipation of changes is an act that all project managers, independent of their mindset, are considering. After this step we needed to reduce the number from seven sub-scales to, finally, six. The final results of the analyses are demonstrated in Table 5.
Table 5: Quality of PVM—Overall Scale
PVM_Scale |
|
| Cronbach's Alpha 0.90 | Variance Explained 0.67 |
| PVM Subscales | Factor Loadings |
| Strategic requirement gap | 0.787 |
| Traits | 0.861 |
| Requirement analyses | 0.771 |
| Ambiguity | 0.820 |
| Overachievement | 0.771 |
| Opportunity recognition | 0.895 |
Overall, the resulting PVM scale to measure the value mindset of project managers represents a very good base to be further used in our analyses to test our initial hypotheses.
Measures for Exploited Project Value Opportunities
The existence of a specific mindset could only be validated by the specific decisions that could be related to it. We developed seven items to measure whether opportunities were exploited during the project implementation. Surprisingly, the analyses resulted in two different scales measuring two kinds of exploited opportunities. One scale measures exploited opportunities that are directly related to the TC-paradigm as they describe opportunities to increase schedule, budget, and scope objectives (Exploited TC-Opportunities). The second scale measures exploited opportunities with the purpose of increasing the value of a project.
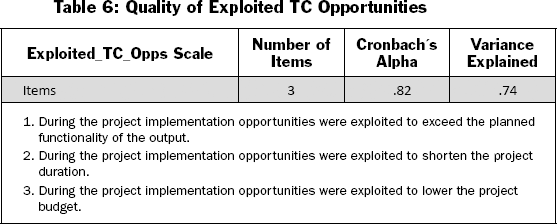
The statistical parameters of the Exploited_TC_Opps scale indicate a very good scale quality to measure whether TC-opportunities were exploited during the project implementation.
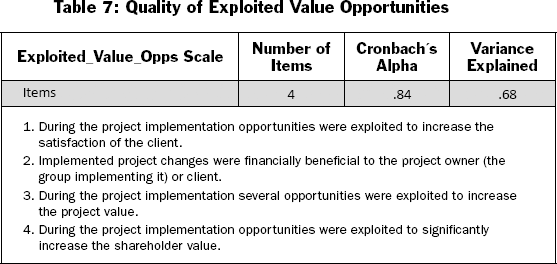
The second scale measuring exploited opportunities to increase the project value in general (Exploited_Value_Opps Scale) also demonstrates a good statistical quality.
Several statistical tests were conducted, a PC-analysis across all seven items, to confirm these results. Despite the exploratory nature of this study these results are consistent with our initial idea about the constraints of the TC-paradigm and its consequences for managing projects and achieving project results.