
CHAPTER 15
Regulatory Reporting and Principles of Policy Documentation
“I had the good fortune to have grown up under several outstanding leaders who had given me a lot of hands‐on experience with people and technically complex missions. I didn't have innate talent, so I surrounded myself with smart people and relied on them to work with me as a team to get the job done. My credo: always hire people who are smarter and better than you are, and learn with them.”
—Gene Kranz, Failure Is Not an Option: Mission Control from Mercury to Apollo 13 and Beyond, New York, NY: Berkley Books, 2000
This chapter, which is also the last in Part III, may at first glance give the impression of being something of an “odds and ends” piece or even worse, no more than a filler, but in reality from a perpetual viability standpoint it's as important as any of the chapters preceding it. Regulatory reporting is a vital fact of life for a bank and one would expect it to continue to be so for the foreseeable future, thus justifying the presence of this chapter in the “future” part of the book's sub‐title. As for policy documentation, that subject may elicit a yawn from many readers but since just about every relationship with all stakeholders including the regulator, the central bank daily monetary operation, rating agencies, customers, employees, and investors revolves around and is governed by formal policy statements, then it is apparent that there is a need to implement and adhere to best‐practice principles governing how policies should be drafted and documented.
We summarise the main tenets of regulatory reporting and for illustration provide a description of the process that UK banks would follow. This is followed by a discussion on the main principles of organising a bank's policy documentation process.
The final section is a listing of the various template policy documents that are contained on the book's companion website. These are all relevant to the topics and disciplines discussed in the last section of this chapter and are applicable at most banks, irrespective of size or business model specificities. To access the templates, please see the instructions in Chapter 20.
REGULATORY REPORTING FOR CAPITAL AND LIQUIDITY1
In this section, we consider the regulatory reporting requirements for capital and liquidity for banks based in the European Union as part of the CRDIV requirements (implementation of Basel III provisions). This material is provided as illustration of the basic principles; banks outside the EU will of course have variations on what is discussed here.
Capital Regulatory Reporting
Regulatory reporting of capital and liquidity is necessary because:
- It obliges banks to monitor their capital adequacy and liquidity risk on a daily or intra‐day basis;
- The data required by the regulator would normally be required by firms for their own purposes in undertaking prudent risk management;
- It enables the regulator to identify and challenge outliers;
- Supervisors can apply their own stress testing scenario analysis to data provided by a firm;
- It enables the regulator to form firm specific, sector, and industry‐wide views on capital adequacy and liquidity risk during good and bad times, and provide feedback to firms on their positioning within their peer group.
EU Common Reporting In 2006, the Committee of European Bank Supervisors (CEBS) established common reporting framework guidelines with the aim of achieving four key objectives:
In this context, the European Banking Authority (EBA) mandated COREP (“Common Reporting”) and FINREP (“Financial Reporting”) as the new European reporting frameworks to achieve harmonised supervisory reporting standards for regulated institutions in over 30 countries across the EU. In the UK, COREP and FINREP were adopted in 2014. COREP implementation has required institutions to increase the volume and granularity of regulatory data they report from approximately 2,000 data elements to more than 10,000 for larger banks. COREP and FINREP reports must be delivered to the EBA in the XBRL (Extendable Business Reporting Language) format, using the European Banking Authority's reporting requirement, format, and layout (Data Point Model). The Data Point Model (DPM) is a structured representation of the data, identifying all the business concepts and their relationships, as well as validation rules and the associated taxonomy (the vehicle that enables data to be shared in line with the DPM structure). In the UK, this is collected via the Financial Conduct Authority's (FCA) GABRIEL system. EU supervisory reporting is required in the following areas (on either a quarterly, semi‐annual, or annual basis):
Capital Adequacy is covered by the Own Funds requirements. In total, there are 29 reporting templates, split into capital adequacy, transitional provisions, group solvency, credit risk, market risk, and operational risk categories. Abridged versions of templates 1 (Own Funds), 2 (Own Funds Requirements), and 3 (Capital Ratios and Capital Levels) are illustrated at Figures 15.1, 15.2, and 15.3.
FIGURE 15.1 COREP Own Funds Reporting Template (CA1)
FIGURE 15.2 Own Funds Requirements (CA2)
FIGURE 15.3 Capital Ratios and Capital Levels (CA3) The EBA reporting on the Leverage Ratio consists of four templates:
In the UK, prior to the implementation of COREP, banks were required to submit a variety of FSA (the UK regulator at that time) returns on various aspects of capital adequacy. Since 2014, as illustrated in Table 15.1, a number of these reports have been discontinued, whilst others have been retained, either in full or with an amended application by the Financial Conduct Authority. TABLE 15.1 Changes to Gabriel Reporting under COREP and FINREP Challenges Posed by COREP COREP (and FINREP) poses a range of potential issues for banks to manage. Organisational Reporting processes, frequency, and related technology must be aligned across traditionally silo'd areas such as Risk and Finance. In addition, there are data mapping and data modelling challenges, since reported information will be underpinned by the same set of regulations and assumptions, for the same reporting dates. This can be extremely challenging, given that most organisations are embedded with multiple layers of source systems and complex data transformations. There are also organisational challenges related to regulatory interpretation, as the lack of subject matter experts and different interpretations of the same data definition could only add to the level of complexity. Operational Data needs to be correct and consistent across each of the reporting submissions, requiring a robust financial and risk control framework. Maintenance of the template rules and hierarchies is also vital. “Hard‐coding” of business rules to hit reporting deadline is likely to be a costly approach. A robust operational process to understand both the Prudential Regulation Authority (PRA) and EBA requirements and implement any changes to the DPM is important. The operational impact of the new reporting requirements and maintenance of the DPM and templates can be minimised by utilising a granular business data model to assemble reporting information, aggregated and mapped to the EBA reporting model. That way, if the view of the data required for reporting changes, essentially all that is required is a tweak to the aggregation and mapping process. Process In the areas of data mapping and data modelling, for example, data may not be stored in a single data warehouse, in which case it may prove problematic to source the information required for the reporting templates. As a result, many institutions have created or enhanced reporting systems to collate, normalise, and output the required data. For many firms, the final XBRL format of the reports also proved to be a large technical challenge. As the XBRL reports are subject to a large set of validation rules embedded in the XBRL taxonomy, the reports need to be created with a high degree of accuracy, with appropriate pre‐submission formatting and validation checks. Many organisations have purchased third‐party software to facilitate the formatting of the reports to XBRL. Additional UK PRA Capital Reporting Requirements The collection and availability of data obtained under the European regime, for example, COREP and FINREP, form the baseline against which any additional data requirements are assessed in the context of the PRA's review of reporting requirements in the UK. In addition to regulatory reporting, the PRA requires a wide variety of data to be collected from firms including management information, financial accounts, and other ad‐hoc data, which are used to support supervisory reviews and risk assessment. The PRA also collects data to support the work of the Financial Policy Committee (FPC) in identifying and understanding common sectoral risks that have the potential to affect the stability of the UK financial system as a whole and to monitor the impact of the Committee's decisions and recommendations. Additional data collected by the PRA includes, but is not confined to:
C 01.00 ‐ OWN FUNDS (CA1)
Rows
ID
Item
Amount
010
1
OWN FUNDS
015
1.1
TIER 1 CAPITAL
020
1.1.1
COMMON EQUITY TIER 1 CAPITAL
030
1.1.1.1
Capital instruments eligible as CET1 Capital
130
1.1.1.2
Retained earnings
180
1.1.1.3
Accumulated other comprehensive income
200
1.1.1.4
Other reserves
210
1.1.1.5
Funds for general banking risk
220
1.1.1.6
Transitional adjustments due to grandfathered CET1 Capital instruments
230
1.1.1.7
Minority interest given recognition in CET1 capital
240
1.1.1.8
Transitional adjustments due to additional minority interests
250
1.1.1.9
Adjustments to CET1 due to prudential filters
300
1.1.1.10
(‐) Goodwill
340
1.1.1.11
(‐) Other intangible assets
370
1.1.1.12
(‐) Deferred tax assets that rely on future profitability and do not arise from temporary differences net of associated tax liabilities
380
1.1.1.13
(‐) IRB shortfall of credit risk adjustments to expected losses
390
1.1.1.14
(‐) Defined benefit pension fund assets
430
1.1.1.15
(‐) Reciprocal cross holdings in CET1 Capital
440
1.1.1.16
(‐) Excess of deduction from AT1 items over AT1 Capital
450
1.1.1.17
(‐) Qualifying holdings outside the financial sector which can alternatively be subject to a 1.250% risk weight
460
1.1.1.18
(‐) Securitisation positions which can alternatively be subject to a 1.250% risk weight
470
1.1.1.19
(‐) Free deliveries which can alternatively be subject to a 1.250% risk weight
471
1.1.1.20
(‐) Positions in a basket for which an institution cannot determine the risk weight under the IRB approach, and can alternatively be subject to a 1.250% risk weight
472
1.1.1.21
(‐) Equity exposures under an internal models approach which can alternatively be subject to a 1.250% risk weight
480
1.1.1.22
(‐) CET1 instruments of financial sector entities where the institution does not have a significant investment
490
1.1.1.23
(‐) Deductible deferred tax assets that rely on future profitability and arise from temporary differences
500
1.1.1.24
(‐) CET1 instruments of financial sector entities where the institution has a significant investment
510
1.1.1.25
(‐) Amount exceeding the 17.65% threshold
520
1.1.1.26
Other transitional adjustments to CET1 Capital
524
1.1.1.27
(‐) Additional deductions of CET1 Capital due to Article 3 CRR
529
1.1.1.28
CET1 capital elements or deductions ‐ other
530
1.1.2
ADDITIONAL TIER 1 CAPITAL
540
1.1.2.1
Capital instruments eligible as AT1 Capital
660
1.1.2.2
Transitional adjustments due to grandfathered AT1 Capital instruments
670
1.1.2.3
Instruments issued by subsidiaries that are given recognition in AT1 Capital
680
1.1.2.4
Transitional adjustments due to additional recognition in AT1 Capital of instruments issued by subsidiaries
690
1.1.2.5
(‐) Reciprocal cross holdings in AT1 Capital
700
1.1.2.6
(‐) AT1 instruments of financial sector entities where the institution does not have a significant investment
710
1.1.2.7
(‐) AT1 instruments of financial sector entities where the institution has a significant investment
720
1.1.2.8
(‐) Excess of deduction from T2 items over T2 Capital
730
1.1.2.9
Other transitional adjustments to AT1 Capital
740
1.1.2.10
Excess of deduction from AT1 items over AT1 Capital (deducted in CET1)
744
1.1.2.11
(‐) Additional deductions of AT1 Capital due to Article 3 CRR
748
1.1.2.12
AT1 capital elements or deductions ‐ other
750
1.2
TIER 2 CAPITAL
760
1.2.1
Capital instruments and subordinated loans eligible as T2 Capital
880
1.2.2
Transitional adjustments due to grandfathered T2 Capital instruments and subordinated loans
890
1.2.3
Instruments issued by subsidiaries that are given recognition in T2 Capital
900
1.2.4
Transitional adjustments due to additional recognition in T2 Capital of instruments issued by subsidiaries
910
1.2.5
IRB Excess of provisions over expected losses eligible
920
1.2.6
SA General credit risk adjustments
930
1.2.7
(‐) Reciprocal cross holdings in T2 Capital
940
1.2.8
(‐) T2 instruments of financial sector entities where the institution does not have a significant investment
950
1.2.9
(‐) T2 instruments of financial sector entities where the institution has a significant investment
960
1.2.10
Other transitional adjustments to T2 Capital
970
1.2.11
Excess of deduction from T2 items over T2 Capital (deducted in AT1)
974
1.2.12
(‐) Additional deductions of T2 Capital due to Article 3 CRR
978
1.2.13
T2 capital elements or deductions ‐ other
C 02.00 ‐ OWN FUNDS REQUIREMENTS (CA2)
Rows
Item
Label
Amount
010
1
TOTAL RISK EXPOSURE AMOUNT
040
1.1
RISK WEIGHTED EXPOSURE AMOUNTS FOR CREDIT, COUNTERPARTY CREDIT, AND DILUTION RISKS AND FREE DELIVERIES
050
1.1.1
Standardised approach (SA)
240
1.1.2
Internal ratings based Approach (IRB)
460
1.1.3
Risk exposure amount for contributions to the default fund of a CCP
490
1.2
TOTAL RISK EXPOSURE AMOUNT FOR SETTLEMENT/DELIVERY
500
1.2.1
Settlement/delivery risk in the non‐Trading book
510
1.2.2
Settlement/delivery risk in the Trading book
520
1.3
TOTAL RISK EXPOSURE AMOUNT FOR POSITION, FOREIGN EXCHANGE AND COMMODITIES RISKS
530
1.3.1
Risk exposure amount for position, foreign exchange and commodities risks under standardised approaches (SA)
580
1.3.2
Risk exposure amount for Position, foreign exchange, and commodities risks under internal models (IM)
590
1.4
TOTAL RISK EXPOSURE AMOUNT FOR OPERATIONAL RISK (OpR )
600
1.4.1
OpR Basic indicator approach (BIA)
610
1.4.2
OpR Standardised (STA) / Alternative Standardised (ASA) approaches
620
1.4.3
OpR Advanced measurement approaches (AMA)
630
1.5
ADDITIONAL RISK EXPOSURE AMOUNT DUE TO FIXED OVERHEADS
640
1.6
TOTAL RISK EXPOSURE AMOUNT FOR CREDIT VALUATION ADJUSTMENT
650
1.6.1
Advanced method
660
1.6.2
Standardised method
670
1.6.3
Based on OEM
680
1.7
TOTAL RISK EXPOSURE AMOUNT RELATED TO LARGE EXPOSURES IN THE TRADING BOOK
690
1.8
OTHER RISK EXPOSURE AMOUNTS
700
1.8.1
Of which: Additional risk exposure amount due to application of Basel I floor
710
1.8.2
Of which: Additional stricter prudential requirements based on Art 458
750
1.8.3
Of which: Additional stricter prudential requirements based on Art 459
760
1.8.4
Of which: Additional risk exposure amount due to Article 3 CRR
C 03.00 ‐ CAPITAL RATIOS AND CAPITAL LEVELS (CA3)
Rows
ID
Item
Amount
010
1
CET1 Capital ratio
020
2
Surplus(+)/Deficit(‐) of CET1 capital
030
3
T1 Capital ratio
040
4
Surplus(+)/Deficit(‐) of T1 capital
050
5
Total capital ratio
060
6
Surplus(+)/Deficit(‐) of total capital
Memorandum Items: Capital ratios due to Pillar II adjustments
070
7
CET1 capital ratio including Pillar II adjustments
080
8
Target CET1 capital ratio due to Pillar II adjustments
090
9
T1 capital ratio including Pillar II adjustments
100
10
Target T1 capital ratio due to Pillar II adjustments
110
11
Total capital ratio including Pillar II adjustments
120
12
Target Total capital ratio due to Pillar II adjustments
Data items replaced for CRD IV Firms
Data items that remain for CRD IV Firms but application differs under CRD IV rules
Data items retained for CRD III Firms
Data items unaffected by COREP / FINREP
COREP Own Funds
FSA003 ‐ Capital Adequacy
FSA004 ‐ Credit Risk
FSA005 ‐ Market Risk
FSA007 ‐ Operational Risk
FSA028 ‐ Non EEA Sub groups
FSA045 ‐ IRB Portfolio Data
FSA046 ‐ Securitisation
FSA058 ‐ Securitisation
COREP LE
FSA008 ‐ Large Exposures
FINREP IFRS
FSA001 Balance Sheet
FSA002 Income Statement
FSA005 ‐ Market Risk: Only 2 data elements for Capital Add‐ons will be completed
FSA006 ‐ Market Risk (supp.): Retained to support RNIV Framework
FSA045 ‐ IRB Portfolio Data: Guidance will change
FSA018 ‐ UKIGs Large exposures: Guidance will change as this will be applied to entities with Core UK Group and Non‐Core LE Group Waiver
(Applies to PRA Firms Only At Present)
FSA001 Balance sheet on a consolidated and solo basis
FSA002 Income Statement on a consolidated and solo basis
FSA003 ‐ Capital Adequacy
FSA004 ‐ Credit Risk
FSA005 ‐ Market Risk
FSA007 ‐ Operational Risk
FSA028 ‐ Non EEA Sub groups
FSA058 ‐ Securitisation
CRD:
FSA001 Balance Sheet
FSA002 Income Statement
FSA014 ‐ Forecast data
FSA015 ‐ Sectoral analysis
FSA016 ‐ Solo consolidation
FSA017 ‐ Interest rate gap
FSA019 ‐ Pillar 2 Questions
LIQUIDITY
FSA011, 047 – 055
Non CRD:
FSA029 ‐ 042
Payment Services:
FSA056 / 057
MLAR
RMAR
Complaints
Liquidity Regulatory Reporting
We examine the evolution of liquidity regulatory reporting through the eyes of the European regulators, notably the Prudential Regulatory Authority (PRA) and the Basel Committee on Banking Supervision (BCBS).
During the early “liquidity phase” of the financial crisis that began in 2007, many banks – despite adequate capital levels – still experienced difficulties because they did not manage their liquidity in a prudent manner. The crisis drove home the importance of the industry having a standard set of liquidity metrics to correctly assess the state of the participants in the financial markets and the banking sector.
The PRA introduced a series of new liquidity reporting standards called the ILAS stress test effective from 1 December 20092 established under the Policy Statement entitled “Strengthening liquidity standards”. This regime focused on a 3M stress test, which needed to be adequately covered by a prescribed set of liquid assets. The stress test has a prescribed set of outflow assumptions and was standardised in its approach. It enabled the PRA to consistently assess the liquidity positions of each banking institution in the market simultaneously. The banks reported to the regulators on a Monday the Friday's close of business position and subsequent qualitative discussions followed. This was founded under the overarching principle outlined in BIPRU 12.2.1R:
“ A firm must at all times maintain liquidity resources which are adequate, both as to amount and quality, to ensure that there is no significant risk that its liabilities cannot be met as they fall due”.
The PRA followed a principle‐based approach for the overall framework while using a more prescriptive approach for reporting and quantitative measures.
The key elements of this regime included the following:
- Over‐arching principles of self‐sufficiency and adequacy of liquidity resources;
- Enhanced systems and control requirements, which implement the Basel Committee's updated Principles for Sound Liquidity Risk Management and Supervision;
- New quantitative requirements, coupled with a narrow definition of liquid assets;
- A new modifications regime for branches and subsidiaries; and
- Granular and frequent reporting requirements.
This set of monitoring metrics was designed to assist supervisors in the analysis of bank specific and system wide liquidity risk trends. Whilst this practice had already existed in the UK since the introduction of the Independent Liquidity Assessment Supervision (ILAS) regime under BIPRU 12, there was no single worldwide standardised set of metrics to evaluate the quantum of liquidity risk in the banking sector.
The relevance of the framework established by the PRA was that it founded the basis of the Liquidity Coverage Ratio and Net Stable Funding Ration3 established by the Basel Committee in January 2013, which built on the standards set out in the 2008 Principles for Sound Liquidity Risk Management and Supervision4.
See Chapter 12 for detail on the Liquidity Coverage Ratio (LCR), Net Stable Funding Ratio (NSFR), and a discussion on potential business model impacts of the requirement to adhere to these funding metrics.
From a reporting perspective, the LCR should be produced on an ongoing basis to help monitor and control liquidity risk. The LCR should be reported to supervisors at least monthly and in most instances weekly, with the operational capacity to increase the frequency to weekly or even daily in stressed situations at the discretion of the supervisor. Banks are expected to meet the NSFR requirement on an ongoing basis and the NSFR should be reported at least quarterly. Over time, it is expected that the NSFR reporting frequency aligns to that prescribed for the LCR.
Reporting Requirements to Regulatory Authorities
In order to ensure a high level of consistency and harmonisation, the European Banking Supervisors (EBA) devised a set of guidelines and reporting requirements covering all aspects of Basel III. These are titled “Guidelines on Common Reporting” (COREP) which form part of the overall CRD IV EU legislative package. This section will focus on the elements of COREP that apply to the reporting of key liquidity metrics pertaining to LCR and in the future will cover NSFR, which is currently covered by separate legislation under Capital Requirements Regulation (CRR).
The European Banking Authority (EBA) is specifying all liquidity reporting data requirements for via COREP and this will continue to be collected via the Financial Conduct Authority's (FCA) GABRIEL system. The GABRIEL system was introduced under the BIPRU 12 regime in 2009. It is the PRA's centralised online system for collecting and storing regulatory data on firms.
In the UK, the sole reporting format for this data will be via XBRL (eXtensible Business Reporting Language), which is a global standard for exchanging business information. This will cover all data currently included within the EBA Implementing Technical Standards (ITS).
Under the EBA ITS standards, the following reporting frequencies have been agreed:
- Monthly reporting: on the last day of each month;
- Quarterly reporting: 31 March, 30 June, 30 September, and 31 December;
- Semi‐annual reporting: 30 June and 31 December;
- Annual reporting: 31 December.
In times of stress, it is expected that these metrics can be run on a daily basis and some regulators are asking to see these numbers on a weekly basis. Whilst this is not hard wired into the regulations, it is a request being made and one that banks can easily adhere to given that they will be managing these ratios on a daily basis to ensure adherence.
In addition to the reporting frequencies, the ITS also specified the template format that need to be populated. This is to ensure that all firms are reporting the key liquidity metrics in a standardised controlled format. These templates can be found on the EBA website5.
These templates (for LCR) are broken down into the following main components:
- Template C72.00 of Annex XXIV Liquidity coverage: liquid assets broken down into the qualifying components Level 1 assets or as Level 2 assets in accordance with Chapter 1and 2 of Title II of the delegated act and which comply with the general requirements set out in Article 7 as well as the operational requirements defined in Article 8 of the LCR delegated act;
- Template C73.00 of Annex XXIV Liquidity coverage: liquidity outflows measured over the next 30 days, for the purpose of reporting the liquidity coverage requirement as specified in the delegated act. This template contains both outflows from unsecured transactions / deposits and from liabilities resulting from secured lending and capital‐market driven transactions;
- Template C74.00 of Annex XXIV Liquidity coverage: liquidity inflows measured over the next 30 days, for the purpose of reporting the liquidity coverage requirement as specified in the delegated act. This template contains both inflows from unsecured transactions / deposits and from secured lending and capital‐market driven transactions;
- Template C75.00 of Annex XXIV Liquidity coverage: collateral swaps maturing within 30 days in which non‐cash assets are swapped for other non‐cash assets;
- Template C76.00 of Annex XXIV Liquidity coverage: calculation of the LCR for the purpose of reporting the liquidity coverage requirement as specified in the delegated act.
The reporting requirements outlined for NSFR are covered under the Capital Requirements Regulation (CRR) and follow the templates outlined in the Quantitative Impact Study (QIS). These templates can be found on the Bank for International Settlements (BIS) website6 under the tab entitled NSFR. The reporting frequency of these templates is designed to be in line with the publication of financial statements, which typically is on a quarterly, semi‐annual, and annual basis. Further information can be obtained on the BIS website contained within the “Net Stable Funding Ratio disclosure standards”7. Note that at time of writing the final form of NSFR calculation and assumptions is still to be published. LCR was the first metric to go live while NSFR should go live in 2019. There is still a lot of work to agree the templates and reporting frequencies around NSFR, but the dates that have been outlined in this chapter are good proxy for what the market expects to occur.
Intra‐day Risk Monitoring and Reporting
In April 2013, the Basel Committee on Banking Supervision (BCBS) published the requirements “Monitoring tools for intra‐day liquidity management”. The document referenced as BCBS248 set out the key metrics that need to be monitored and reported to the regulator. The management of intra‐day liquidity risk is probably one of the more challenging liquidity risks to manage by the simple nature that it requires up to the minute data on transaction information that is occurring real time in the bank.
Intra‐day liquidity and risk were described in Chapter 12.
Background Under the Principles of Sound Liquidity Risk Management and Supervision, Principle 8 identified six operational elements that should be included in a bank's strategy for managing intra‐day liquidity risk. These state that a bank should:
- Have the capacity to measure expected daily gross liquidity inflows and outflows, anticipate the intra‐day timing of these flows where possible, and forecast the range of potential net funding shortfalls that might arise at different points during the day;
- Have the capacity to monitor intra‐day liquidity positions against expected activities and available resources (balances, remaining intra‐day credit capacity, available collateral);
- Arrange to acquire sufficient intra‐day funding to meet its intra‐day objectives;
- Have the ability to manage and mobilise collateral as necessary to obtain intra‐day funds;
- Have a robust capability to manage the timing of its liquidity outflows in line with its intra‐day objectives; and
- Be prepared to deal with unexpected disruptions to its intra‐day liquidity flows.
The set of monitoring tools established within BCBS248 are listed in Table 15.2.
TABLE 15.2 Intra‐day monitoring tools
| The set of monitoring tools | |
| Tools applicable to all reporting banks | |
| A(i) | Daily maximum intra‐day liquidity usage |
| A(ii) | Available intraday liquidity at the start of the business day |
| A(iii) | Total payments |
| A(iv) | Time‐specific obligations |
| Tools applicable to reporting banks that provide correspondent banking services | |
| B(i) | Value of payments made on behalf of correspondent banking customers |
| B(ii) | Intraday credit lines extended to customers |
| Tool applicable to reporting banks which are direct participants | |
| C(i) | Intraday throughput |
These monitoring tools are explained in more detail in Chapter 12.
Reporting Templates for Intra‐day Risk The PRA's intra‐day liquidity data template is closely aligned with the Basel Committee on Banking Supervision “Monitoring Tools for Intra‐day Liquidity Management” to follow in the common format of reporting across Basel III. In similar format to other types of liquidity reports, these are submitted in XML format on a quarterly basis with a 15‐day delay time period allowed given the volumes of data required to submit.
The reporting templates are broken into three main categories:
- Table A – Direct participants;
- Table B – Banks that use correspondent banks;
- Table C – Banks that provide correspondent banking services.
These tables are reproduced at Figure 15.4.
| Direct participants | Table A | |||
| Reporting month | ||||
| Name of the large value payment system | ||||
| A(i) Daily maximum intraday liquidity usage | Max | 2d max | 3d max | Avg |
| 1. Largest positive net cumulative position | ||||
| 2. Largest negative net cumulative position | ||||
| A(ii) Available intraday liquidity at the start of the business day | Min | 2d min | 3d min | Avg |
| Total | ||||
| Of which: | ||||
| 1. Central bank reserves | ||||
| 2. Collateral pledged at the central bank | ||||
| 3. Collateral pledged at ancillary systems | ||||
| 4. Unencumbered liquid assets on a bank's balance sheet | ||||
| 5. Total credit lines available26 | ||||
| 5a. Of which secured | ||||
| 5b. Of which committed | ||||
| 6. Balances with other banks | ||||
| 7. Other | ||||
| A(iii) Total payments | Max | 2d max | 3d max | Avg |
| 1. Gross payments sent | ||||
| 2. Gross payments received | ||||
| A(iv) Time‐specific obligations | Max | 2d max | 3d max | Avg |
| 1. Total value of time‐specific obligations | ||||
| C(i) Intraday throughput (%) | Avg | – | – | — |
| 1. Throughout at 8:00 | — | — | — | |
| 2. Throughout at 9:00 | — | — | — | |
| 3. Throughout at 10:00 | — | — | — | |
| 4. Throughout at 11:00 | — | — | — | |
| 5. Throughout at 12:00 | — | — | — | |
| 6. Throughout at 13:00 | — | — | — | |
| 7. Throughout at 14:00 | — | — | — | |
| 8. Throughout at 15:00 | — | — | — | |
| 9. Throughout at 16:00 | — | — | — | |
| 10. Throughout at 17:00 | — | — | — | |
| 11. Throughout at 18:00 | — | — | — | |
| Banks that use correspondent banks | Table B | |||
| Reporting month | ||||
| Name of the correspondent bank | ||||
| A(i) Daily maximum liquidity usage | Max | 2d max | 3d max | Avg |
| 1. Largest positive net cumulative position | ||||
| 2. Largest negative net cumulative position | ||||
| A(ii) Available intraday liquidity at the start of the business day | Min | 2d min | 3d min | Avg |
| Total | ||||
| Of which: | ||||
| 1. Balance with the correspondent bank | ||||
| 2. Total credit lines from the correspondent bank27 | ||||
| 2a. Of which secured | ||||
| 2b. Of which committed | ||||
| 3. Collateral pledged at the correspondent bank | ||||
| 4. Collateral pledged at the central bank | ||||
| 5. Unencumbered liquid assets on a bank's balance sheet | ||||
| 6. Central bank reserves | ||||
| 7. Balances with other banks | ||||
| 8. Other | ||||
| A(iii) Total payments | Max | 2d max | 3d max | Avg |
| 1. Gross payments sent | ||||
| 2. Gross payments received | ||||
| A(iv) Time‐specific obligations | Max | 2d max | 3d max | Avg |
| 1. Total value of time‐specific obligations | ||||
| Banks that provide correspondent banking services | Table C | |||
| Reporting month | ||||
| B(i) Value of payments made on behalf of correspondent banking customers | Max | 2d max | 3d max | Avg |
| 1. Total gross value of payments made on behalf of correspondent banking customers | ||||
| B(ii) Intraday credit lines extended to customers | Max | 2d max | 3d max | — |
| 1. Total value of credit lines extended to customers28 | — | |||
| 1a. Of which secured | — | |||
| 1b. Of which committed | — | |||
| 1c. Of which used at peak usage | — | |||
FIGURE 15.4 Reporting Templates for Table A, B and C
This is designed to ensure that all the associated intra‐day risk from both sides of market participants – payers and receivers – are fully captured. Currently all of these reports are being disclosed to the regulators but on a quarterly basis. It is expected over time that this frequency of reporting is increased. Nevertheless, in order to ensure that they can demonstrate that they can manage intra‐day risk, banks need to evaluate this on a daily basis and set controls and procedures around the management of this liquidity risk.
PRINCIPLES OF POLICY DOCUMENTATION
These days, policy documents are a staple of the banker's art. Regulators lay great importance on the existence of detailed and “robust” policies for essentially every aspect of a bank's operations, from its recruitment policy to its staff sickness policy. The two examples just noted may not be that relevant to the discipline of ALM, however, included within the ambit of policy documentation are such important ones as the liquidity risk appetite statement and the interest‐rate risk policy. From the Board risk appetite policy downwards, it is indeed vital that the main principles of a bank's balance sheet management approach are documented formally, and that these principles are approved at the highest level and reviewed at least annually.
Therefore we can see why practitioners in the ALM and balance sheet risk management space must be well versed in what constitutes an effective policy document, and the best way to ensure that it is drafted, reviewed, approved, and implemented correctly. Ultimately, having an efficient and strong policy formulation and documentation process is connected with the long‐run well‐being of the bank.
Note that while policy statements are available for public inspection, in essence they are internal governance documents. As such they are more flexible and accessible than formal external‐facing documents such as an ILAAP or Pillar 3 disclosure document. A question the author has been asked is, “Why does the bank need to have a Liquidity Policy Statement when all that would be contained within such a policy is already contained within the ILAAP?” But the bank should have such a statement for the same reason it might have an HR policy or a customer complaints policy, to dictate governance and process discipline. And the fundamental benefit is that as an internal policy, any changes to (in this case) the funding operating model or indeed any aspect of the liquidity risk regime, whether enforced or by design, can be updated quickly in the policy statement compared to the considerably longer time it would take to edit and approve an ILAAP document. So the fact that much of what a bank does may be described in a regulatory submission does not obviate the need to maintain sound internal policy documentation.
In this section, we present an overview recommendation of best‐practice principles of the policy documentation process, and provide a template for a document format. We also provide a policy approval process template.
Baseline Approach
It is very important that every aspect of balance sheet risk management is articulated in a formal policy document, approved at ALCO. This is to ensure that every stakeholder is aware of the requirements, operating procedures, and minimum / maximum tolerances of the bank relating to any and all factors that impact the balance sheet.
Policies should be reviewed by ALCO on a regular basis; depending on the type of policy in question we suggest once every 6 to 12 months. Drafting and ownership responsibilities of each policy must be known by all relevant bank staff and appropriate stakeholders.
The key principles underpinning policy documentation are as follows:
- Ownership and drafting responsibilities clear;
- Transparent, accessible language;
- Principle objectives of the policy clear;
- Who is affected by the policy;
- Regular review timetable;
- Relevant procedures and guidelines that form part of the policy;
- Balance sheet limits.
The Treasury (or possibly, Risk) must ensure that all critical aspects of the balance sheet management function are covered with the appropriate and relevant policy. For example, at every bank these would be expected to include:
- ALM policy standard;
- Liquidity management policy (and subsets of this policy thereof);
- Capital management policy;
- Dividend policy;
- Liquid asset buffer (LAB) policy;
- IRRBB policy;
- FX assets–liabilities policy;
- ALCO ToR formulation;
- ALCO papers submission template;
- Asset encumbrance policy;
- Funds transfer pricing policy;
- Securities issuance policy;
- Market risk hedging policy;
- Standard templates.
At this stage it is important to define, if only loosely, what a “policy” is and show how it differs from other forms of rulebooks or instruction manuals. The box below differentiates a policy from, in turn, a guideline, a procedure, and a “standard” (although some commentators refer to “policy standards” which does confuse things).
Template Policy Format and Submission Process
We show the author's own recommended template for a policy format at Figure 15.5. This example is a funding concentration policy, however the layout and format is the author's recommended standard template. This may be applied to any policy within the Treasury, Risk, or Finance space, and indeed most parts of the bank.
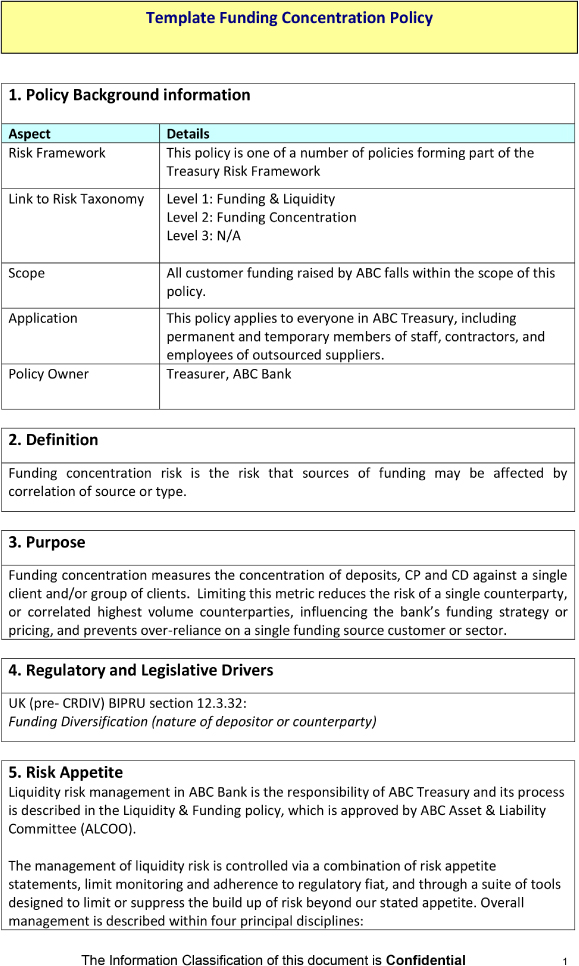
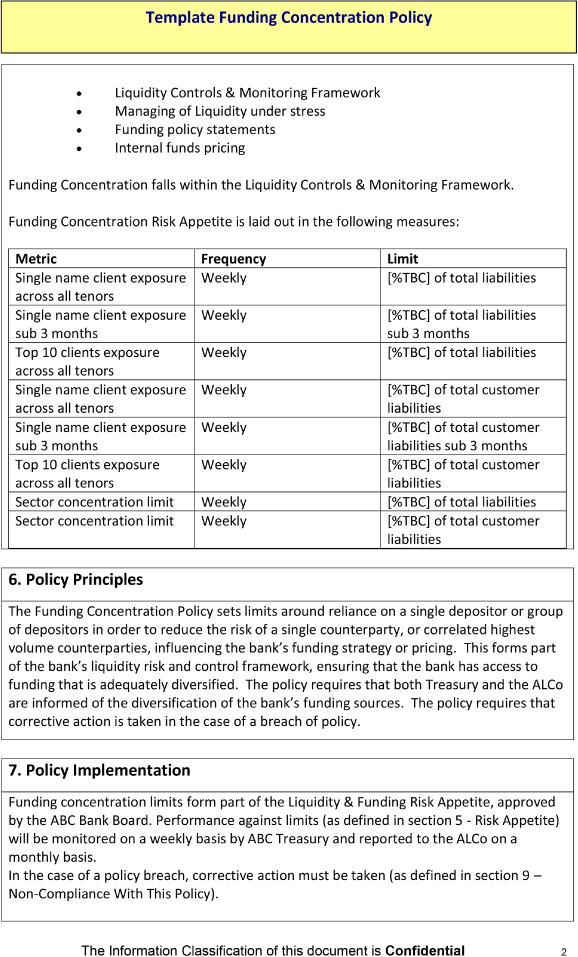
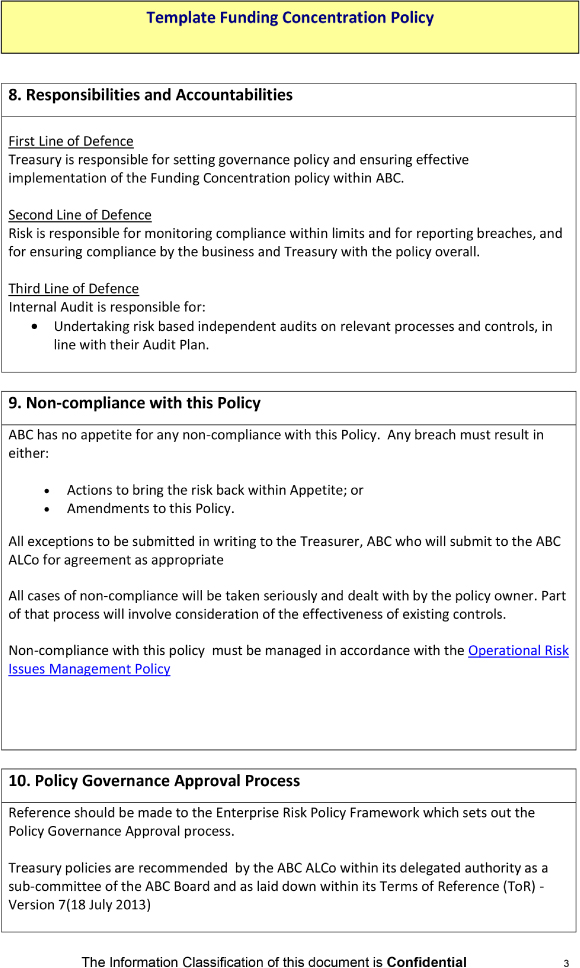
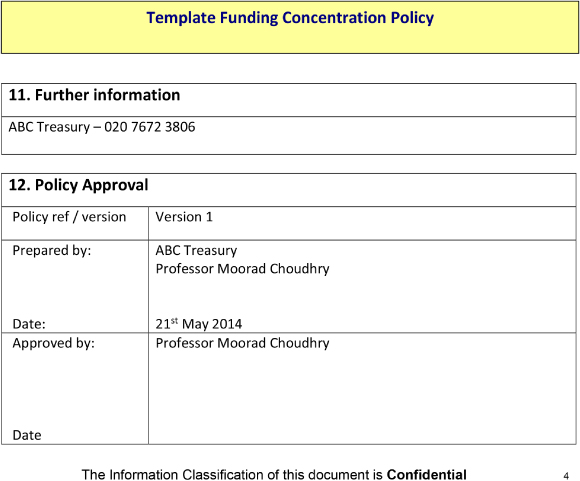
Figure 15.5 Funding concentration policy, template example.
The process of submitting a paper for approval – whether by ALCO, or any other committee up to Board level – should also be contained in a policy document. The process should also supply a standard template for all paper submissions which all business lines must use. We illustrate a recommended process for approval submission in the box below. In this example, the process described is for those business lines wishing to issue private placement or public capital market instruments such as medium‐term notes or structured notes. The approval authority in question is the Security Issuance Committee.
TEMPLATE POLICY DOCUMENTATION
We list here items contained on the book's accompanying website that are relevant to the chapters in Part III. To access the website, please see login details in Chapter 20. The files described below are held in the website folder “Part III Policy Documentation”.
- Template for an ALCO Terms of Reference;
- Example of an ALCO operating agenda (which would form part or an appendix of the ALCO ToR);
- Template for the design and format of the ALCO Monthly Pack (slide deck).
- Exercise on preferred suite of liquidity risk management metrics summary for ALCO pack;
- Example of the recommended Group Treasury weekly qualitative report summary, provided by Regional / Divisional Treasurers;
- Example strategy implemented at a commercial bank using the FTP mechanism to incentivise the raising of Retail deposits;
- Template for a commercial bank liquidity risk appetite statement. Note that the expression “TBC” alongside a particular risk metrics denotes that this is a limit that is user‐defined and user‐specified;
- Case study of the suite of liquidity metrics used and reported at a MENA commercial bank. Note that limits are set with the internal Treasury limit as the most conservative, above or below (as necessary) the Board and Regulator limits, to ensure that critical limits are not breached without sufficient advance warning;
- Template ILAA submission document which is based on case study of actual final approved submission for a medium‐sized UK commercial bank;
- Template Liquidity reserve book policy.
- Template for a commercial bank IRRBB risk management policy.
- Template for a commercial bank Group ALCO ToR. (This file is held in the folder “Chapter 14”.)
- Template for a policy standard document;
- Presentation on principles of policy documentation;
- Template and example of a Funding Concentration Policy document;
- Real‐world example of the Terms of Reference of a Treasury‐related committee, the Securities Issuance Committee (a committee of the Global Banking and Markets division of RBS) in 2011 of which the author was Chair;
- Template for a bank's Contingency Funding Plan (CFP) document.
Note that a template Trading Book Policy and FX risk hedging policy are held in the folder marked “Chapter 5”.
SELECTED BIBLIOGRAPHY AND REFERENCES
- Regulatory and financial reporting essential for effective banking supervision and financial stability, https://www.bankingsupervision.europa.eu/press/speeches/date/2014/html/se140603.en.html.
- Regulatory data,http://www.bankofengland.co.uk/PRA/Pages/regulatorydata/default.aspx.
- Regulatory Reporting: What Banks Can Do to Keep Pace with the Changes, Tata Consulting, http://www.tcs.com/resources/white_papers/Pages/Regulatory‐Reporting‐What‐Banks‐can‐do.aspx.