
Chapter 3. Stand-alone NSM Deployment and Installation

At this point, you have selected deployment locations, network access technologies, and server hardware for your NSM platform(s). This chapter demonstrates how to install the open source Security Onion (SO) NSM suite from Doug Burks (http://securityonion.blogspot.com/) to begin collecting and interpreting network traffic. SO is so incredibly easy to deploy and operate that I use it myself, rather than building my own platforms.
This chapter focuses on installing SO in its simplest configuration: as a stand-alone platform. When you finish this chapter, you will have an NSM appliance ready to provide your CIRT with the network-centric data it needs to detect and respond to intrusions.
As a preview for the rest of this part of the book, Chapter 4 explains how to install SO in a distributed configuration, with separate server and sensor components. Chapter 5 discusses housekeeping functions for stand-alone and distributed setups. In Chapter 6 and Chapter 7, we’ll try out some of the packet analysis tools that come bundled with SO, and in Chapter 8 we’ll learn how to use several of the NSM consoles available in SO.
Stand-alone or Server Plus Sensors?
SO supports two deployment modes:
- Stand-alone mode
In this mode, SO is a self-contained, single-box solution that collects and presents data to analysts.
- Server-plus-sensors mode
In this mode, SO acts as a distributed platform, with sensors collecting data and a server aggregating and presenting data to analysts.
To choose the appropriate mode, you need to decide how extensive you expect your NSM needs to become. Each mode offers certain benefits and drawbacks, but I recommend that anyone new to NSM start with a stand-alone deployment. Using a single system enables you to learn more about the NSM datatypes and how to apply them to your CIRT’s workflow. After becoming comfortable with a stand-alone deployment, consider upgrading to the server-plus-sensors arrangement explained in Chapter 4.
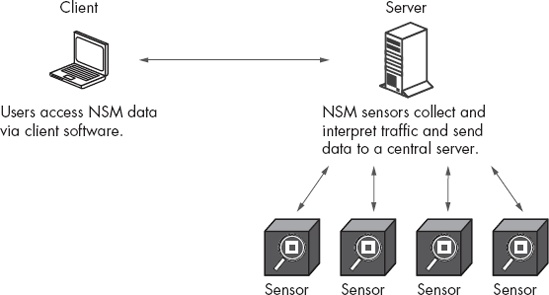
Figure 3-1 shows the stand-alone configuration with a client (such as an analyst) accessing a stand-alone SO platform. The stand-alone SO platform performs all of the functions necessary to perform NSM, on one box.

The stand-alone option is a good choice for security staff with fairly simple NSM requirements. For example, they might need to watch only a single segment, or several segments using a single sensor.
Figure 3-2 illustrates how a stand-alone NSM platform could watch traffic at locations G, B, and H, as labeled in the figure. The dashed lines show network connectivity from the network taps at locations G, B, and H to the listening network interface cards (NICs) on the NSM platform. The solid line shows network connectivity from the internal network switch to the management NIC of the NSM platform. The listening NICs passively watch network traffic, while the management NIC permits remote access to the NSM platform.

Figure 3-3 depicts another alternative: server-plus-sensors deployment. This option is suitable for larger and more complicated network requirements. Basically, the stand-alone option consolidates all collection, interpretation, and reporting duties on a single server, and the server-plus-sensors option distributes these duties.
The server-plus-sensors configuration is the deployment model of choice for any CIRT with multiple networks to monitor, especially in the case of geographically separate networks. CIRTs could choose to deploy a stand-alone SO system at geographically disparate locations, but the result would be that no single set of consoles or databases would provide the analyst with a unified view. By using the server-plus-sensors option, the CIRT can enjoy access to multiple networks from a single location.
Let’s return to our simple network diagram. This time, we assign three dedicated sensors, one for location G, one for B, and one for H, and coordinate their work using a central server, as shown in Figure 3-4.

In the server-plus-sensors mode, the sensors do not need to reside within the local network; they can be deployed globally as long as they can connect back to the central server via the network. Some organizations enable this with a VPN, while others deploy the management interfaces for each system (server and sensors) on public networks to make them universally reachable. Ask your network and security administrators to determine the choice that best meets their requirements.
Choosing How to Get SO Code onto Hardware
After deciding on the SO model, you can choose how to install SO code onto hardware. As of this writing, SO supports two ways to get SO code onto hardware:
The easiest method is to download an .iso file suitable for burning to DVD or flashing to a 2GB or larger capacity USB thumb drive. If you prefer a USB-based installation, try a program like the Universal USB Installer (http://www.pendrivelinux.com/universal-usb-installer-easy-as-1-2-3/).
The other method uses the Ubuntu Personal Package Archives (PPA) for the SO project. Using these PPAs, administrators can install SO on Ubuntu Linux (http://www.ubuntu.com/) and its derivatives, such as Xubuntu (http://xubuntu.com/).
The SO .iso is built on a 64-bit version of Xubuntu 12.04, derived from the Ubuntu 12.04 Long Term Support (LTS) release, called Precise Pangolin. The Ubuntu project will support 12.04 until April 2017, making it suitable for sensor and hardware platforms like SO.
Note
If you’re a Windows administrator, using SO is a good way to gain exposure to Linux. The SO project makes installing and using Linux very easy. In fact, making life simple for Windows administrators was one of its design goals.
The examples that follow demonstrate how to install both SO configurations. I recommend trying the stand-alone installation in a virtual machine such as VMware Workstation, but other virtualization software should work. You can also try SO on spare hardware, but remember the functional specifications recommended in Chapter 2. Available RAM is probably the most important. With less than 4GB of RAM, a stand-alone SO installation watching no more than a single monitored interface will be slower than some might like.
From this point forward, I assume you have downloaded the SO .iso file and are ready to install it. You checked its MD5 hash against the value published at the download location to validate the integrity of the file. If you plan to deploy SO on physical hardware, you burned it to a DVD or flashed it to a USB drive. If you plan to try it on a VM, you have the .iso file on the system running the virtualization software. In either case, the hardware (physical or virtual) has at least two NICs (one for management and one for capturing traffic), at least 4GB RAM, and at least a 40GB hard drive. Let’s begin!
Installing a Stand-alone System
The general process for installing any type of SO system involves these steps:
Select a monitoring location.
Select hardware.
Boot the hardware with installation media.
Deploy the installation media on the hardware.
Configure networking.
Install and configure the appropriate SO settings.
We will follow this basic procedure in each of the examples. The steps will vary according to the function of the hardware, the installation media you chose, and the role of the SO software on the NSM platform.
Installing SO to a Hard Drive
To begin installing SO as a stand-alone system, boot the SO .iso file. You will see a boot menu with the default option to start SO as a live system, as shown in Figure 3-5. This means that the SO system will be running like a “live CD,” allowing you to try SO as a stand-alone system without needing to do any work whatsoever.

If you press enter to select the first option, or wait seven seconds, SO will boot to a graphical user interface (GUI), as shown in Figure 3-6, and the system will try to obtain an IP address via the Dynamic Host Configuration Protocol (DHCP). At this point, I suggest proceeding to installation.
To begin installation, choose the Install Secu... icon, which points to the Install Security Onion option that will install Xubuntu Linux on the server. At the first screen, choose your preferred language. I select English and click Continue. The next screen asks me to verify that I have enough free hard drive space to continue, and that the system is connected to the Internet, as shown in Figure 3-7. I can also choose the Download updates while installing or Install this third-party software option. I recommend selecting both options. If your system is not connected to the Internet, do not choose either option.


The next screen warns that installing SO will “delete any files on the disk.” This is acceptable, so I select Erase disk and install SecurityOnion, as shown in Figure 3-8.

Now it’s time to choose the drive where you will install SO. This varies from system to system. In my example, I have just one drive, so I accept the default and choose Continue. The next screen begins the installation process and asks for my location via a “Where are you?” question and map. Select any location at this point; once it’s installed, SO will set Universal Coordinated Time (UTC) as the time zone for the platform and override this choice. Choosing a keyboard layout comes next. Just select the best option for your system.
Next, you select a username, computer name, and password, as shown in Figure 3-9. You can also choose to encrypt your home folder, but I don’t bother, because SO’s most important data is saved in the /nsm and /var directories, which means that encrypting /home/<username> won’t make much difference. Don’t select Log In Automatically, or the system will be open to anyone after boot, without the need for a username and password.
Now the system should continue to install software to the hard drive. If you’re connected to the Internet, and you selected the appropriate option, it should also download updates and packages. When finished, the process will report “Installation Complete. Click Restart Now to reboot the computer.”
Once the system reboots, it will show a login prompt, as in Figure 3-10. Enter the username and password you selected earlier.


After logging in, you should see a screen just like the GUI presented after the live system booted, except now you have Xubuntu installed on your hard drive. You should update Xubuntu and applications before proceeding to the SO setup.
Note
If you’re not familiar with Linux, it’s important to understand that you can interact with the system via a GUI or by entering commands in a terminal application. A terminal is a way to instruct the operating system to execute commands and applications. Frequently, we will prepend the sudo command in order to elevate our privileges. Using sudo is the preferred way to act as the all-powerful “root” user on Linux distributions like Ubuntu or Xubuntu. When prompted for a password, enter the password with which you logged in. You don’t enter a root password.
Let’s update this Linux installation by running the following commands at a terminal:
$ sudo apt-get update && sudo apt-get dist-upgradeType your password when prompted and press enter.
Xubuntu will proceed to update. It will ask you if you want to install and update software, with something like “After this operation, XXXX MB of additional disk space will be used. Do you want to continue [Y/n]?” like this:
-- snip --
116 upgraded, 4 newly installed, 0 to remove and 0 not upgraded.
Need to get 56.8 MB/287 MB of archives.
After this operation, 203 MB of additional disk space will be used.
Do you want to continue [Y/n]?
Type Y and press enter to approve and continue. Xubuntu should proceed to update itself and its installed applications. You will most likely be asked to reboot the system when the installation is complete. Use the command sudo reboot to accomplish that task.
Configuring SO Software
The operating system and applications are up-to-date, so now we begin configuring the SO software itself. After rebooting, log in to the desktop and click the Setup icon to begin that process.
Enter the password you used to log in, and you will see a screen welcoming you to Security Onion Setup, as shown in Figure 3-11. Choose Yes, Continue!.

Now to configure network interfaces. This is an important step because the SO team has performed various tests to determine the optimum settings for collecting and interpreting network traffic, including disabling NIC offload features that can confuse some NSM software. Select Yes, configure /etc/network/interfaces! to continue, as shown in Figure 3-12.

Choosing the Management Interface
On the next screen, choose the network interface for the management interface. Select the NIC that you plan to access remotely, which is traditionally the first NIC in your system. I plan to administer my demo stand-alone system using eth0 and to sniff traffic with eth1, so I select eth0 and click OK, as shown in Figure 3-13. (Your selected interface will be highlighted in blue when selected, as shown below.)

Now decide if you want the management interface to receive an IP address via DHCP or whether to assign it a static IP address. You can choose either for testing purposes (DHCP is probably simpler), but in a production system, you should assign a static IP address unless you have a static mapping configured in DHCP. I choose to assign a static IP for the management interface, a netmask, a gateway, a DNS server, and a local domain name according to the specifics of my test network (not shown here).
Next select the interface for SO to use to collect and interpret traffic, as shown in Figure 3-14. SO can sniff more than one interface, but I recommend one SO system per monitored interface for beginners.

Network setup is almost complete. SO will summarize your settings, and then ask whether to make the changes, as shown in Figure 3-15. Select Yes, configure /etc/network/interfaces! to continue, as shown in Figure 3-12. If you’re happy with the settings, click Yes, make changes and reboot!.

Installing the NSM Software Components
When the system reboots, you should be back at the login screen. Enter your credentials, and we’ll install the various NSM software components for a stand-alone system. Chapter 4 shows how to install a distributed setup, with a server plus sensors.
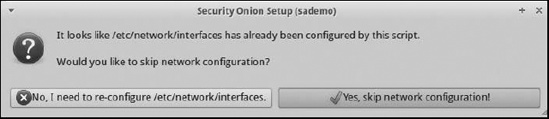
To begin, click the Setup icon, enter your password, and choose Yes, Continue! at the Welcome to Security Onion Setup! screen. Next, choose Yes, skip network configuration!, as shown in Figure 3-16.
To simplify setup for this first example, choose the Quick Setup option, as shown in Figure 3-17. This will have the server running SO as a stand-alone system with minimum configuration.

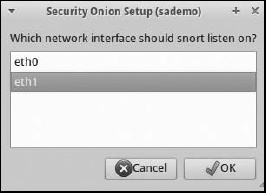
You will need to tell SO the interface for some of its components to monitor. As shown in Figure 3-18, I tell SO that I want Snort to sniff traffic on eth1. (As part of Quick Setup, SO chooses to use the Snort network IDS to generate alert data.)
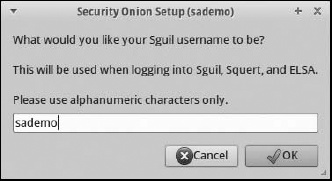
Now provide a username for accessing the NSM software component Sguil (covered in Chapter 8), as shown in Figure 3-19. SO will use this username for several other NSM tools.
At the next screen, enter an email address for SO to use for logging into the Snorby NSM console and authenticating users. (SO will not use this email address to send spam to you! In fact, the SO project does not track users in any way.) Snorby (also covered in Chapter 8) is a tool for presenting NSM data to analysts, and it uses a separate authentication mechanism based on email addresses.
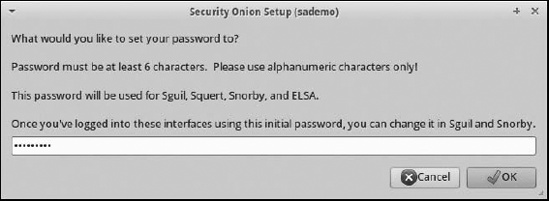
Now you’ll choose an alphanumeric password for use in authenticating to NSM software installed with SO, as shown in Figure 3-20. (You can change this password later through the Sguil and Snorby interfaces.)
After you create credentials for SO NSM applications, the configuration script asks if you want to install the Enterprise Log Search and Archive (ELSA) software, as shown in Figure 3-21. Choose Yes, enable ELSA! unless you are working with very constrained hardware. ELSA provides a search engine interface to NSM log data.

SO should now summarize the changes it is about to make. If you like the results, select Yes, proceed with the changes!, as shown in Figure 3-22.

Next, SO configures the system’s time zone to use UTC, and then sets up all the NSM applications packaged with it. When finished, it should report some helpful information about your system. You can check the status of the setup in the /var/log/nsm/sosetup.log file, as shown in Figure 3-23.
Finally, you’ll see information on IDS rule management, as shown in Figure 3-24.


Checking Your Installation
Once you’ve finished installing your stand-alone system, you should take some steps to make sure that it’s functioning as expected.
First, open a terminal and run the following command to see if all the NSM agents are live. Remember that you run a terminal by executing the Terminal application on the desktop.
$ sudo service nsm status
[sudo] password for sademo:
Status: securityonion
  * sguil server                                               [ OK ]
Status: HIDS
  * ossec_agent (sguil)                                        [ OK ]
Status: Bro
Name       Type        Host      Status   Pid   Peers  Started
bro        standalone  localhost running  5813  0      10 Feb 11:10:32
Status: sademo-eth1
  * netsniff-ng (full packet data)                             [ OK ]
  * pcap_agent (sguil)                                         [ OK ]
  * snort_agent-1 (sguil)                                      [ OK ]
  * snort-1 (alert data)                                       [ OK ]
  * barnyard2-1 (spooler, unified2 format)                     [ OK ]
  * prads (sessions/assets)                                    [ OK ]
  * sancp_agent (sguil)                                        [ OK ]
  * pads_agent (sguil)                                         [ OK ]
  * argus                                                      [ OK ]
  * http_agent (sguil)                                         [ OK ]
Now, in the same window, run the following command to generate activity that will trigger a Snort alert. I’m assuming that your sensor can see traffic to and from the stand-alone system’s management port. If not, run this command from a system monitored by the new sensor, or visit the URL with a web browser on a system monitored by the new sensor.
$ curl www.testmyids.com
uid=0(root) gid=0(root) groups=0(root)
To determine if at least part of your NSM setup is working, visit the Snorby NSM application using a web browser. Point your web browser to the IP address of your stand-alone sensor that you assigned earlier. You will receive an error saying the certificate for HTTPS is not trusted because it is not signed, as shown in Figure 3-25. Unless you suspect that an internal user is conducting a man-in-the-middle attack against you, it is safe to choose Proceed Anyway or the equivalent. (If you later choose to deploy a certificate trusted by the browser, you will not see these warnings.)
You will now see the SO welcome page, as shown in Figure 3-26, with links to SO applications accessible via the web servers running on the SO system. Click the link for Snorby to determine if it captured data triggered by visiting http://www.testmyids.com/.


Clicking the Snorby link should open a new tab or window to your SO IP address and port 444. Snorby should ask for the email address and password you chose during setup, as shown in Figure 3-27. Enter them and click Welcome, Sign In.

Depending on where you deployed your sensor and the amount of traffic active on the network, you will see different amounts of information on the initial dashboard. We’re interested in seeing two specific alerts at the right side of the screen: either ET Policy curl User-Agent or GPL ATTACK_RESPONSE id ch. If you see either or both (as shown in Figure 3-28), your sensor is seeing traffic and at least one NSM application (in this case, Snort) observed and reported it correctly.

Conclusion
In this chapter, we created a stand-alone SO platform. We booted the SO .iso file and installed the Xubuntu Linux distribution to a hard drive. Next, we updated the operating system and began the process of installing the SO software. We began by configuring the network interfaces, choosing one for system management and the other for data collection or sniffing. With the network interfaces prepared, we turned to configuring a variety of SO tools via a helpful wizard process. Once all the software was installed and configured, we viewed the Snorby console to ensure it could see at least some data derived from the network.
In Chapter 4, we’ll advance from the world of the stand-alone platform into one where distributed systems rule. Stand-alone platforms work well for isolated deployments, but some of the power of the NSM model is apparent only when analysts can interact with data from multiple vantage points. Stand-alone platforms can sometimes watch more than one network segment if those segments are physically nearby. When monitored segments are geographically dispersed, a distributed deployment works best to unify collection and presentation of NSM data. Chapter 4 will show how to make that a reality.