
Chapter 8. NSM Consoles

Chapter 6 and Chapter 7 discussed tools for packet analysis. This chapter covers NSM consoles, which are tools built specifically for NSM. Applications like Tcpdump, Tshark, Wireshark, Xplico, and NetworkMiner process live traffic or traffic saved in pcap format. When reading this chapter, you may recall features of those tools that share certain similarities with the software discussed here. Some of them generate session or extracted content data, for example, or present multiple forms of data in a single interface. The difference between the tools covered in Chapter 6 and Chapter 7 and those presented in this chapter is that the NSM consoles help analysts drive a decision-making process, rather than a troubleshooting or forensic process.
Furthermore, NSM consoles tend not to work on raw packets, whether in the form of live traffic or traffic saved in pcap format. All of the tools in Chapter 6 and Chapter 7 contained features that let analysts tell the software to sniff traffic from the wire or open a saved trace. NSM consoles, in contrast, offer a framework and interface to manipulate and interact with multiple NSM datatypes, but generally not via processing a saved trace. This is a limitation in some respects, because it restricts their use to live operational scenarios. This is not necessarily true of some commercial tools, but the focus of this book is open source software packaged with the free SO distribution: Sguil, Squert, Snorby, and ELSA.
An NSM-centric Look at Network Traffic
The tools we’ve explored so far generate one or more forms of NSM data. Here’s a brief recap of the NSM datatypes (introduced in Chapter 1):
- Full content data
Network traffic stored to disk in pcap format.
- Extracted content
Information carved from network traffic, such as files or web pages.
- Session data
A high-level summary of network conversations, focusing on who talked to whom, at what time, plus how much information was exchanged.
- Transaction data
A more granular form of session data, exposing details of protocols with request-reply characteristics like HTTP, FTP, and SMTP.
- Statistical data
Descriptive information that characterizes network activity, like counts of various aspects of conversations.
- Metadata
“Data about data,” or an integration of external information like geography or ownership, applied to network information.
- Alert data
Reflects whether traffic triggered some sort of notification. It’s a judgment made by a tool, typically an IDS, about some characteristic of network traffic.
That’s a lot of data to manage. NSM isn’t about collecting evidence for the sake of having it, though. CIRTs collect NSM data because it enables them to achieve a specific business objective. The outcome of an NSM-centric look at network traffic is a decision: Is the event in question benign, suspicious, or malicious? The answer to that question determines what a CIRT analyst does next. Mature CIRTs answer these questions to meet business goals, such as conducting detection and response in one hour or less.
Many forms of network data, and tools to inspect that data, help analysts meet business security goals. Tools built specifically for NSM, however, assist in three specific ways:
They make it easy for analysts to review multiple forms of NSM data, often within a single interface.
They enable analysts to “pivot,” or transition, from one form of NSM data to another.
They capture the outcome of the analyst’s decision-making process. NSM-specific tools make a workflow possible, usually coordinating the actions of multiple analysts to complete a shared objective.
Sguil, Squert, Snorby, and ELSA are four open source tools written by NSM practitioners, for NSM practitioners. These software authors realized that other tools for analyzing network-centric data were helpful but not sufficient for conducting NSM as a continuous business process. Each tool offers a way to integrate several types of NSM data, pivoting among the information, and, in most cases, classifying the outcome of an investigation.
The NSM consoles packaged with SO work with several overlapping sets of NSM data. Whereas the packet analysis tools discussed in Chapter 6 and Chapter 7 tend to be producers of NSM data, the consoles in this chapter are more like consumers of NSM data. Similar to the tools profiled in Chapter 6 and Chapter 7, the consoles in this chapter are available in SO by default, except for ELSA. (The setup wizard asks if you want to run ELSA when installing SO.) This chapter highlights the key features of each tool to help you decide which best suits the needs of your NSM operation.
Using Sguil
Sguil (http://www.sguil.net/) is an open source NSM, first written as a proprietary application, but then recoded and released as open source in early 2003.
Note
Bamm Visscher codes Sguil under the Qt Public License (QPL, http://sourceforge.net/projects/sguil/).
Sguil is one of the main applications packaged with SO. Its components collect, store, and present data that other SO tools use, and certain applications rely on Sguil’s authentication database. Even if you decide not to use the Sguil console to review NSM data, you’ll benefit from its collection and management of NSM data.
Running Sguil
Sguil is a client/server application written in Tcl/Tk. Its server coordinates with Sguil agents deployed on sensors to collect NSM data. The Sguil client is the analyst’s window into Sguil’s data. You can start the Sguil console via the Sguil icon on the SO desktop, or you can install the Sguil client on another computer.
The tools we’ve discussed so far work by analyzing live or saved network traffic; they’re meant for use in live operations or when conducting review on historical activity. In contrast, Sguil is a solely a live tool. You can’t use Sguil to “open” a saved network trace; you can interact with Sguil only as its various components and dependencies collect and generate traffic gathered from a live network interface. As an example, we’ll use the Sguil client to interact with a sample server and sensor.
Note
If you’ve already installed SO, you should be able to follow along with the example. However, the data you see will not match the data shown because you’ll be watching new, live data, although the analysis process is the same.
Before running Sguil, make sure that all of its underlying services are running on the sensor with the service command, as shown in Example 8-1. You should see OK in each field.
sudo service nsm status command$ sudo service nsm status
Status: securityonion
* sguil server [ OK ]
Status: HIDS
* ossec_agent (sguil) [ OK ]
Status: Bro
Name Type Host Status Pid Peers Started
bro standalone localhost running 2433 0 24 Feb 18:27:19
Status: sademo-eth1
* netsniff-ng (full packet data) [ OK ]
* pcap_agent (sguil) [ OK ]
* snort_agent-1 (sguil) [ OK ]
* snort-1 (alert data) [ OK ]
* barnyard2-1 (spooler, unified2 format) [ OK ]
* prads (sessions/assets) [ OK ]
* sancp_agent (sguil) [ OK ]
* pads_agent (sguil) [ OK ]
* argus [ OK ]
* http_agent (sguil) [ OK ]If one or more components are not running, you can try restarting all of the software using the following command:
$ sudo service nsm restartIf one or more components are still not running, you may need to rerun the SO setup script or consult the SO mailing list for additional assistance.
Once you’ve confirmed that all services are running, connect to the Sguil console by clicking the Sguil icon on the SO desktop. In this example, the Sguil client will connect to the Sguil server on localhost. (You could connect to the server from another computer running a Sguil client, but it’s easier to use the SO platform.)
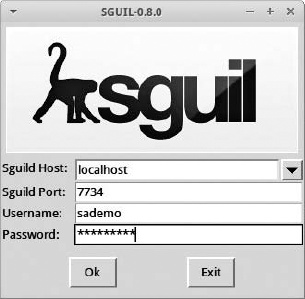
Connect to your instance of an SO server, and enter the username and password you selected for Sguil during the SO installation process, as shown in Figure 8-1, and then click OK.
The Sguil client asks you to select network(s) to monitor. Click Select All, and then click Start Sguil.
The Sguil console appears. Highlight any row in the top section, and then check the Reverse DNS, Show Packet Data, and Show Rule boxes. The Sguil console will display data like that shown in Figure 8-2.

If you see information similar to that in Figure 8-2, your Sguil installation is working as expected.
Sguil’s Six Key Functions
Sguil enables six key functions helpful to NSM analysts:
Sguil performs simple aggregation of similar alert data records.
Sguil makes certain types of metadata, and related data, readily available.
Sguil allows queries and review of alert data.
Sguil permits queries and review of session data.
Sguil provides a right-click menu that lets you pivot, or move from either of those two categories of data to full content data, rendered as text in a transcript, in a protocol analyzer like Wireshark, or in a network forensic tool like NM.
Sguil exposes features so analysts can count and classify events, thereby enabling escalation and other incident response decisions.
The following sections explain how to use these features.
Simple Aggregation
A powerful but possibly underappreciated Sguil feature is its ability to aggregate similar records into single lines of output in the console. Figure 8-2 shows this feature in action. The CNT column is Sguil’s mechanism to display record counts. The top row, for example, shows how Sguil aggregated four similar records into a single entry in the console.
This simple act of grouping similar records into single lines reduces the analyst’s workload. The review process can focus on unique records rather than repetitive entries that differ only by timestamp. Because Sguil is a live, or “real-time,” tool, it processes and aggregates entries as the console receives them. Entries in the CNT column may increase as new but repetitive events reach the sensor.
Metadata and Related Data
Sguil doesn’t expose a great deal of metadata, but it makes three important types easily accessible. In Figure 8-2, you can see two forms of metadata in the lower-left corner of the console. The entries labeled Src IP, Src Name, Dst IP, and Dst Name represent the IP addresses and hostnames (if available via DNS) for the source and destination IP addresses of any highlighted record. Under this IP and hostname information, Sguil displays WHOIS data for either the source or destination IP address. Analysts can choose which to display via a radio button.
Sguil shows one other form of metadata and one form of related data in the lower-right corner of the console. When showing alert data generated by an IDS like Snort or Suricata (discussed in the next section), Sguil displays the rule that triggered the generation of the alert data. Under the rule, Sguil shows the packet that triggered the creation of the alert data.
This metadata and related data give analysts more context about the systems involved in network traffic. They can also choose to disable the display of this information.
Now let’s take a closer look at the alert data to understand what it means in the context of the Sguil console.
Querying Alert Data in Sguil
When you start Sguil, alert data is the first form of NSM evidence you will see. Sguil calls alerts event data. The database supporting Sguil stores the alert data in an event table, so you’ll see references to that term, rather than alert.
Sguil incorporates four forms of alert data:
Network IDS engines like Snort and Suricata generate alert data when traffic they observe triggers one of their rules. These rules are indicators of compromises that may require human analysis to determine if they represent benign, suspicious, or malicious activity. Alert data from the Snort or Suricata IDSs bear entries in the Event Messages column that begin with text like ET (for Emerging Threats, an IDS rule source) or GPL (another rule source).
Host-based IDS engines like OSSEC (http://www.ossec.net/), if enabled, provide similar warnings based on analyzing information about individual computers. Using OSSEC requires installing an OSSEC software agent on servers. By default, SO runs OSSEC on its own operating system. Alerts from OSSEC have event messages beginning with [OSSEC]. (For more information on OSSEC, see the online manual at http://www.ossec.net/doc/.)
Sguil also integrates data in the event table from some sources that are not IDS engines. For example, Sguil collects network profiling data created by the Passive Real-time Asset Detection System (PRADS) tool (https://github.com/gamelinux/prads/). Alert data from PRADS begins with PADS. PADS is a reference to the Passive Asset Detection System, the precursor to PRADS.
Sguil stores HTTP transaction data generated by Bro. This data records Uniform Resource Locators (URLs) observed by Bro, such as www.testmyids.com. Sguil displays these messages by prepending them with the label URL. Because HTTP activity is so common on networks, URL data is not displayed by default, unlike data from Snort/Suricata, OSSEC, and PRADS.
Data from Snort/Suricata, OSSEC, and PRADS appear by default in Figure 8-2, in the top half of the Sguil console. If you want to query for HTTP URL data recorded by Bro, you must ask Sguil manually. As an example, we’ll create a query for HTTP data. Sguil refers to this as an event query.
To run an event query, choose Query ▸ Query Event Table from the Sguil menu. In the Query Builder window, modify the default text as shown in Example 8-2. Note the use of single quote characters (to the left of the enter key on the US keyboard).
WHERE event.timestamp > '2014-02-10 11:13:00' AND event
.timestamp < '2013-02-10 11:16:00' AND event.signature LIKE 'URL%'
Figure 8-3 shows this query in the Sguil console.

This query looks for events in the Sguil database with timestamps between 11:13:00 and 11:16:00 UTC on February 10, 2013, where the signature or message begins with the string URL. Figure 8-4 shows the results of this query on our demo system.

These URL events are drawn from the Bro application’s http.log file, which contains a summary of observed HTTP traffic. A Sguil agent read http.log and inserted the results into the MySQL database.
Notice that certain details—such as the timestamp, source and destination IP addresses and ports, and URL—are available as individual rows. Highlight any row and check the Display Detail box to see the rest of the information associated with this event. The text after the UID: element of the detailed display is a unique identifier created by Bro for this session. You could use this UID to query Bro logs later.
Querying Session Data in Sguil
The ability to query for NSM session data is another one of Sguil’s key functions. Sguil refers to session data as SANCP data. SANCP stands for Security Analyst Network Connection Profiler, which is a tool written by John Curry packaged with earlier versions of Sguil to generate session data. In SO, Doug Burks replaced SANCP with PRADS in late 2012.
In addition to generating session data, PRADS performs network device profiling and tracks the systems it sees. Despite the new code, Sguil’s database maintains a sancp table for storing session data. This form of NSM data keeps thorough records of every conversation seen by the sensor.
Unlike alert data, session data is always written to disk, regardless of whether any system considers it normal or troublesome. The same neutral approach also applies to full content data, extracted content data, transaction data, statistical data, and metadata.
Note
Collecting and generating data beyond IDS alerts is a key aspect of network security monitoring. The availability of other forms of data, stored regardless of any relationship to an IDS alert, is a core differentiator between NSM-centric operations and alert-centric operations. With NSM, the alert is only the beginning of the analysis process, not the end. If your network monitoring model relies on IDS alerts, or IDS alerts triggering packet capture, you’re not conducting NSM. Why not convert today?
Session data isn’t displayed by default in the Sguil console. Analysts can query for session data using a process similar to running an event query, as described in the previous section. The difference involves querying the sancp table instead of the event table. More common, however, is the process of pivoting from alert data to session data. With pivoting, you start with one form of data, identify an item of interest, and use that item as the jumping-off point for a new query.
To demonstrate how to query for session data using a pivot methodology, we’ll begin with the results of the URL-based alert data query. Suppose that we want to know more about activity involving the destination IP address for one of the URL records. Rather than run a new search from the Query menu, we’ll pivot on the highlighted message. Right-click the destination IP address of the highlighted event, and then select Advanced Query ▸ Query Sancp Table ▸ Query DstIP/1 Hour, as shown in Figure 8-5.

Sguil displays the Query Builder window with prepopulated syntax that looks for session records 30 minutes prior and 30 minutes following the highlighted record, as shown in Figure 8-6. The timestamp on the highlighted event is 11:14:57, so the query starts at 10:44:57 and ends at 11:44:57 on February 10, 2013.

As you can see in Figure 8-7, this query returns only one session data record. The PRADS application created this session record. A Sguil software agent running on the sensor read the PRADS output and loaded the session record into the MySQL database on the SO server. This is an example of how an NSM console like Sguil integrates data from multiple systems and platforms.

Select the Display Sancp Details option to see a summary of the TCP flags counted during this session. The TCP protocol uses flags like SYN, ACK, FIN, ACK, RST, URG, and PSH to coordinate the transfer of data during a session. PRADS keeps track of the total set of flags seen when two computers exchange data using TCP. Sguil can display those flags in the console to help analysts recognize patterns of communication. For example, the pattern ACK PSH SYN FIN shown in Figure 8-7 reflects all of the flags that would be used at some point during a normal TCP session.
The information in this record is similar to what we saw generated by Argus in Chapter 6, including timestamps, source and destination IP addresses and ports, protocol (6 here for TCP), and source and destination packet and byte counts. These elements are the core features of session data: who talked to whom, when, and how much data they exchanged.
Note
Just before this book went to press, the PRADS developers changed their code and the way they count bytes of data sent by source and destination computers in session records. PRADS, along with Bro and NM, count bytes in the IP header, the TCP or UDP header, and any application data when reporting bytes of data sent or received in a session. In contrast, Argus and Wireshark count bytes in the Ethernet header, the IP header, the TCP or UDP header, and any application data bytes. The decision to exclude bytes from the Ethernet header means PRADS, Bro, and NM will report fewer bytes compared to Argus and Wireshark results. These choices are arbitrary and harmless, but important to understand when comparing data from these different tools.
Pivoting to Full Content Data
Just as we pivoted from an event to session data, Sguil allows us to pivot from alert or session data to full content data. To see how this works, click the RealTime Events tab and highlight an interesting alert. This example uses an alert about an outdated version of Java. An IDS like Snort or Suricata generated an ET POLICY Vulnerable Java Version alert when the detection engine noticed traffic from a computer running an old version of Java. The IDS wrote the alert to disk, and then a Sguil agent read the data and inserted it into the MySQL database. Using Sguil, we can learn more about this event by right-clicking the Alert ID field and selecting Transcript, as shown in Figure 8-8.

Sguil generates a new window called a transcript, as shown in Figure 8-9 (similar to the window that appears after rebuilding a TCP session in Wireshark). We see a computer with IP address 192.168.2.108 connecting to a server in the oracle.com domain. This is HTTP traffic, as demonstrated by the GET request and the HTTP/1.1 reply. The ET POLICY rule for Vulnerable Java Version noticed that 192.168.2.108 is running an outdated version of Java, as reported by the User-Agent field and the UA-Java-Version (1.7.0_13).
This data is important for several reasons:
It’s a reconstruction of the full content data saved by Netsniff-ng. This data was not collected because the IDS detected suspicious or malicious activity and decided to trigger the capture of full content data. Rather, we simply used the
ET POLICY rule for Vulnerable Java Versionalert as a reason to pivot from alert data to full content data.It shows all of the content for this session—exactly what the source sent and how the destination replied. This data can be critical when trying to understand what is happening during an intrusion.
Although this data appeared in a Sguil Tcl/Tk window, it could just as easily have automatically gone to Wireshark, as shown in Figure 8-10, or NM. In fact, you can open Wireshark by right-clicking the Alert ID field and selecting either option.


Note
Every time Sguil retrieves full content data from the sensor, it saves a copy in the /nsm/server_data/<servername>/archive directory. The Sguil client also saves a copy for local use. For example, the pcap file required to build a transcript might be archived on the SO server at /nsm/server_data/securityonion/archive/2013-02-24/sademo-eth1/192.168.2.117:49207_184.51.126.91:80-6.raw. The format of the filename is SourceIP:SourcePort_DestinationIP:DestinationPort-Protocol.raw.
Sguil’s full content capabilities are powerful for several reasons. First, they’re easy to use. Analysts who are more familiar with manual retrieval of network traffic via the command line are usually thrilled to interact with Sguil on a right-click basis. Also, Sguil, through its Netsniff-ng component, is always capturing full content data to disk. Whether or not there’s an alert, Sguil will have the data. The only limitation is the amount of hard drive space reserved for capture. Wait too long, and the hard drive housekeeping scripts running on SO will erase older captures to make room for new captures. This is why Sguil’s ability to keep archived copies of requested transcripts on the server and client is so helpful: SO may delete the original full content data to make room for new files. As long as an analyst requested a transcript, the associated full content evidence is preserved in two locations.
Categorizing Alert Data
Sguil was designed as a real-time console for analysts sitting in a CIRT or a security operations center (SOC). Sguil is not an “alert browser” for paging through security information. Analysts should not treat Sguil like a log management platform that passively stores records. Instead, analysts should monitor the Sguil console and investigate alerts as they appear. They must decide whether an event is benign, suspicious, or malicious. After making this decision, the analyst can assign a label to the event conveying that information. This process of classification changes the status of the event from RT (for Real Time) to another code chosen by the user.
To support this workflow, Sguil allows you to categorize alert data. Select File ▸ Display Incident Categories to see the categories built into Sguil by default, as shown in Figure 8-11. Highlight any event in Sguil and click the corresponding function key (F1 for Category I, F2 for Category II, and so on) to classify an alert. For example, if you find evidence of an intruder achieving root-level access to a system, pressing F1 will classify the event as an Unauthorized Root/Admin Access incident. Crucially, the alert will disappear from the real-time display. The event is still preserved in the database, but from Sguil’s perspective, the event has been “handled.” To classify an event as being of no consequence, press F8 instead.

Note that you can classify only alert data—not session data. Analysts who use Sguil tend to assign their own meanings to the different function keys, so devise a plan that suits your needs.
Sguil users don’t let alert data pile up in the console. Instead, they work to clear the screen as efficiently as possible.
The case studies later in this book demonstrate how to apply this NSM operational model to hunt for intrusions using NSM data. For now, it’s enough to understand that Sguil provides CIRT members a way to perform six key functions: viewing aggregated alerts, accessing some metadata and related data, querying for alert data, querying for session data, pivoting to full content data, and classifying alert data.
Using Squert
Squert (http://www.squertproject.org/) is an open source web interface for NSM data. Paul Halliday wrote Squert to provide access to the Sguil databases using a web browser.
Note
Paul codes Squert under the GNU General Public License version 3 (http://github.com/int13h/squert/blob/master/COPYING/).
As you saw in the previous examples, the Sguil client focuses on presenting key elements of different datatypes as records in rows. Squert adds features like visualizations and supporting information to events in the Sguil database. Figure 8-12 shows the Events tab of the Squert page with the PING TEST alerts selected.

The Squert dashboard presents several data visualizations. For example, the events grouped by minute and hour graph shows spikes and valleys in counts of alerts created by the Snort or Suricata IDS engines, as shown in Figure 8-13.

Future versions of Squert should allow analysts to pivot from alert data to packet details and full content data.
The Squert project expands beyond the key datatypes captured and integrated by Sguil and its components, but the Snorby project takes that integration a step further.
Using Snorby
Snorby (http://www.snorby.org/) is a newer open source web interface for NSM data.
Note
Dustin Webber codes Snorby under a GNU General Public License version 3 (https://github.com/Snorby/snorby/blob/master/LICENSE).
SO users can access Snorby by pointing a web browser to port 444 TCP on the SO server. Log in using the email address and password selected during the SO installation process to see a summary dashboard of data from the Sguil database, as shown in Figure 8-14. As with Sguil, Snorby users can classify events using function keys.
Most users find the Snorby interface to be intuitive. For example, clicking the High Severity portion of the dashboard takes you to the list of high-severity alerts (as designated by the IDS engine). Clicking any record in the list displays additional data for the event in question, as shown in Figure 8-15.
Snorby also supports creating transcripts, thanks to Paul Halliday’s CapMe program (https://github.com/int13h/capme). To use it, select Packet Capture Options, and then select Custom. The Packet Capture Builder window will appear, as shown in Figure 8-16.


Click Fetch Packet to open a new window titled capME!, as shown in Figure 8-17. This window is prepopulated with the fields necessary to retrieve full content data associated with the particular event. All that remains is to enter a username and password to authenticate to the SO sensor that stores the full content data.

When you’re ready, click Submit, and CapMe will retrieve full content data from the appropriate sensor, return it to the server, and render it via the web browser, as shown in Figure 8-18.

In this example, we see HTTP traffic, with HEAD and GET requests, followed by an HTTP/1.1 status code. It looks as if 192.168.2.117 is retrieving an update from Microsoft.
Snorby can also offer data to analysts in nontraditional ways, such as via iPhone apps. For example, the Snorby iPhone app (https://itunes.apple.com/us/app/snorby/id570584212?mt=8/) offers an innovative way to review Snorby alerts on the go, as shown in Figure 8-19.
Note
In 2013 Dustin Webber published a cloud-based version of Snorby called Threat Stack (https://www.threatstack.com/), mentioned in the conclusion. He plans to continue to support the open source version of Snorby, but the cloud edition contains many compelling features.

Using ELSA
ELSA, the Enterprise Log Search and Archive (https://code.google.com/p/enterprise-log-search-and-archive/), provides a fully asynchronous web-based query interface that normalizes logs and makes searching billions of them for arbitrary strings as easy as searching the Web, as stated on the project’s website.
Note
Martin Holste codes ELSA under a GNU General Public License version 2 (http://enterprise-log-search-and-archive.googlecode.com/svn/trunk/elsa/LICENSE/).
ELSA relies on Syslog-ng (http://www.balabit.com/network-security/syslog-ng/) to collect remote log events, stores them in MySQL, and provides search capabilities using the search server Sphinx (http://sphinxsearch.com/). ELSA is closely tied to the Bro tool, and many analysts use it to interpret Bro logs.
Because ELSA has been integrated into SO, using it is as easy as pointing a web browser to the address and port listening on the SO server, and then authenticating using the username and password you set for the Sguil database. ELSA should listen on port 3154 TCP by default and must be accessed via HTTPS. After authentication, it offers the query window shown in Figure 8-20.

To try out a sample query, I set my From time to the beginning of the data available using the pop-up calendar, and then enter www.testmyids.com in the query box. I click Submit Query and see the results shown in Figure 8-21.

Notice the program(2) element in the Field Summary section. This indicates that ELSA identified two sources of data for these results.
Examining the records, we see the entries of program=bro_http and program=bro_dns. When there are many different sources of data, we can use this program element to narrow the results. For example, Figure 8-22 shows what happens when I enter 192.168.2.127 in the query box, and then click the program element.

You can see that the results are grouped by program, with bro_conn providing the most results (16,261) and bro_smtp the fewest (2). Clicking any Count field starts a new query for just those results. For example, click the snort link to see Snort alerts associated with 192.168.2.127, as shown in Figure 8-23. (ELSA pulls these Snort alerts from the MySQL database.)

Clicking bro_conn displays Bro’s connection logs, a form of session data similar to that of Argus and PRADS, but generated by Bro.
ELSA supports other integrated NSM data as well. For example, to generate a transcript in Snorby (as we did with CapMe in Figure 8-17), click the Info link next to any record, click the Plugin drop-down menu, and choose getPcap, as shown in Figure 8-24.

This option takes you to the CapMe authentication screen, and you can enter a username and password to retrieve a transcript for the event in question.
ELSA’s ability to manipulate log data makes for some interesting queries. For example, to query for all HTTP POST events that did not involve servers in the United States, you could submit the following:
+method:POST -country_code:US
Next, group the results by clicking the user_agent element of the Field Summary. A sample of the results from my lab network is shown in Example 8-3.
user_agent data5724 Mozilla/5.0 (Windows NT 6.1; WOW64; rv:18.0) Gecko/20100101 Firefox/18.0 2314 Mozilla/5.0 (Windows NT 6.1; WOW64; rv:19.0) Gecko/20100101 Firefox/19.0 897 Mozilla/5.0 (Windows NT 6.1; WOW64) AppleWebKit/537.17 (KHTML, like Gecko) Chrome/24.0.1312.57 Safari/537.17 788 -599 realms/1.0.2 CFNetwork/548.1.4 Darwin/11.0.0448 Dalvik/1.4.0 (Linux; U; Android 2.3.4; Kindle Fire Build/GINGERBREAD) 231 com.apple.Maps/1.0 iPhone OS/6.0.1
227 village/1.16.1 CFNetwork/548.1.4 Darwin/11.0.0129 Shockwave Flash85 Lost%20World/1.1.0 CFNetwork/548.1.4 Darwin/11.0.076 BejBlitz/600 CFNetwork/609 Darwin/13.0.068 JNPPirateSchool/1.0.6 CFNetwork/548.1.4 Darwin/11.0.049 Google Update/1.3.21.135;winhttp;cup48 PetCat/1.4 CFNetwork/548.1.4 Darwin/11.0.036 Mailroom/1.7.5.1 CFNetwork/609.1.4 Darwin/13.0.035 Paradise%20Cove/3.8 CFNetwork/548.1.4 Darwin/11.0.027 Mozilla/5.0 ZMTransaction/1.0 25 GoogleAnalytics/2.0b3 (iPad; U; CPU iPhone OS 5.1.1 like Mac OS X; en-us)24 TinyPetsies/1.5.3 CFNetwork/548.1.4 Darwin/11.0.017 Storm8/iPhone
As you can tell from the bolded code, my kids like to play their iPad and PC games on a segment monitored by this lab sensor! Each game lists its name as part of the user agent, e.g., realms at ![]() , which helps the identification process. Beware malicious code masquerading via fake user agents, however.
, which helps the identification process. Beware malicious code masquerading via fake user agents, however.
Since ELSA has been integrated into SO only recently, analysts are just beginning to appreciate its power.
Conclusion
This chapter surveyed the four main open source NSM consoles: Sguil, Squert, Snorby, and ELSA. These consoles generally do not generate new NSM data on their own. Rather, they provide an interface to NSM data supplied by other tools. The consoles help analysts review and query for relevant information, and then pivot to related data in an efficient manner.
Sguil is the original NSM console, and many consider it to be the reference NSM platform. Its six main features are the core capabilities analysts need when doing NSM operations. Sguil lacks some of the flexibility found in new applications, however. Tools like Squert, Snorby, and ELSA are web-accessible. Snorby even offers an app for the iOS platform. ELSA incorporates a much richer set of NSM data, although analysts continue to extend the capabilities of Sguil to accept data from non-network sources such as OSSEC.
By getting a sense of the interface and capabilities of each tool, as well as the primary forms of data they manipulate, you can begin to imagine the sorts of detection and response operations one can conduct with this rich data on hand. Choose the tool that best suits your operational needs. In the next chapter I will outline ways to put NSM to work in your environment by describing NSM operations.