
Chapter 6
Role of Refining on Climate Change
6.1 Introduction
Refining is crude oil is synonymous with value addition, which itself is synonymous with the plastic era that marks the beginning of the golden petroleum era. Today’s main energy fuels are a derivative of the crude oil, which is the cheapest and arguably most abundant source of energy for today’s industrialized society. Plastics, which are finer derivative of the crude oil, are polymers, and we are known to be living in the polymer (or plastic) age. With just over 100 years of synthetic plastic production, plastic today is ubiquitous. Plastics, fibers, elastomers, adhesives, coating, rubber, and nylon are all polymers. They are common in our modern life and the world is unimaginable without them.
Both crude oil and natural polymers have been used for thousands of years, and natural rubber, silk and other proteins, cellulose (found in wood and cotton), and starch are a few examples of the most useful natural materials. Yet, today the derivatives of the crude oil and plastics are considered to be the driver of global toxicity. As the New scientists focus on eliminating the entire crude oil and other fossil fuels, in this chapter we present the science behind refining and demonstrate the source of toxicity that rendered crude oil – the most abundant energy source on earth to the driver of global warming and climate change.
6.2 The Refining Process
Crude oil is a mixture of hydrocarbons. These hydrocarbon mixtures are separated into commercial products by numerous refining processes. They have very similar compositions as vegetable oils. As a result, many properties of the two sets of fluids are similar, including biodegradability, flashpoint, dead oil viscosity, density, bactericidal properties, etc. However, petroleum fluids are almost never used in their original form, even though it is known that petroleum fluids have been used in various cultures from ancient times. One exception is the use of crude oil as mosquito repellant in the former Soviet Union. It was a logical option because it has been well known that the oil of organic origin is a natural mosquito repellant (Maia and Moore, 2011). Even though it eradicated malaria from much of the Soviet Union, they joined in the production of DDT after the Nobel-Prize winning synthesis of this toxic chemical, but most likely for commercial reasons. After DDT was banned in 1972, the use of crude oil as a pesticide did not return into practice.
Today, petroleum fluids are transported to refineries prior to any usage. Oil refineries are enormous complex processes. Figure 6.1 shows major components involved in a refining process. The fundamental process of refining involves the breakdown of crude oil into its various components and the separation of them to sell as a value added product. Because each component loses its natural properties during the denaturing process, chemicals are added to restore original qualities. This is a typical chemical decomposition and re-synthesis process that has been in practice in practically all sectors of the modern age, ranging from the plastic industry to pharmaceutical industries.

Figure 6.1 The pathway followed by the refining process.
Figure 6.2 shows the major steps of a conventional refining process. The first step is transportation and storage. In the crude oil refining process, fractional distillation is the main process that separates oil and gas. For this process, the distillation tower is used, which operates at atmospheric pressure and leaves a residue of hydrocarbons with boiling points above 400C and more than 70 carbon atoms in their chains. Small molecules of hydrocarbons have low boiling points, while larger molecules have higher boiling points. The fractionating column is cooler at the top than at the bottom, so the vapors cool as they rise. Figure 6.3 shows the pictorial view of a fractional column. It also shows the ranges of hydrocarbons in each fraction. Each fraction is a mix of hydrocarbons and each fraction has its own range of boiling points and comes off at a different level in the tower. Petroleum refining has evolved continuously in response to changing consumer demands for better and different products, such as from aviation gasoline to jet fuel. Each requires various degrees of “refinement” to conform to specific needs of machineries that are designed according to certain “ideal” fluid behavior.

Figure 6.2 Major steps involved in a refining process.

Figure 6.3 Pictorial view of fractional column.
Petroleum refining has evolved continuously in response to changing consumer demands for better and different products, such as from aviation gasoline to jet fuel. Each requires various degrees of “refinement” to conform to specific needs of machineries that are designed according to certain “ideal” fluid behavior. A summary of a detailed process flow chart for oil refining steps is presented in Table 6.1. The table also describes the different treatment methods for each of the refining phases. The third column in the above table shows how the refining process can render natural petroleum fluids into toxic chemicals. If the heat source and catalysts used are products of unsustainable practices, their contact with petroleum fluids will result in unsustainable products. Unless this is recognized, further refinement of the process, e.g., optimization of catalysts, automation of heating elements, blending of various additives, and corrosion protection, will not solve the sustainability problem. Catalysts used in processes that remove sulfur are impregnated with cobalt, nickel, or molybdenum, each of which is a toxic element, with far more impact on the environment than the sulfur in crude oil.
Table 6.1 Details of oil refining process and various types of catalyst used.
| Process | Description | Catalyst/Heat/pressure used |
| Distillation Processes | It basically relies on the difference of the boiling point of various fluids. Density also has an important role to play in distillation. The lightest hydrocarbon at the top and the heaviest residue at the bottom are separated. | Heat |
| Coking and Thermal process | Coking unit converts heavy feedstocks into solid coke and lower boiling hydrocarbon products that are suitable to offer refinery units to convert to higher value transportation fuel. This is a severe thermal cracking process to form coke. Coke contains high boiling point hydrocarbons and some volatiles that are removed by calcining at a temperature of 1095–1260°C. Coke is allowed sufficient time to remain in high temperature heaters in insulated singe drums, hence, it is called delayed coking. | Heat |
| Thermal Cracking | The crude oil is subjected to Excessive heat pressure, and large molecules and pressure are broken into small ones to produce additional gasoline. The naphtha fraction is useful for making many petrochemicals. Heating naphtha in the absence of air makes the molecules split into shorter ones. |
Excessive heat and pressure |
| Catalytic Cracking | Catalytic cracking converts heavy oils into high gasoline, less heavy oils, and lighter gases. Paraffins are converted into C3 and C4 hydrocarbons. The benzene rings of aromatic hydrocarbons are broken. Rather than distilling more crude oil, an alternative is to crack crude oil fractions with longer hydrocarbons. Larger hydrocarbons split into shorter ones at low temperatures if a catalyst is used. This process is called catalytic cracking. The products include useful short chain hydrocarbons. | Nickels, zeolites, acid treated natural alumina silicates, amorphous and crystalline synthetic silica alumina catalyst. |
| Hydroprocessing | Hydroprocessing (325°C and 50 atm) includes both hydrocracking (350°C and 200 atm) and hydrotreating. Hydrotreating involves the addition of hydrogen atoms to molecules without actually breaking the molecule into smaller pieces and improves the quality ofvarious products (e.g., by removing sulfur, nitrogen, oxygen, metals, and waxes and by converting olefins to saturated compounds). Hydrocracking breaks longer molecules into smaller ones. This is a more severe operation using higher heat and longer contact time. Hydrocracking reactors contain fixed, multiple catalyst beds. | Platinum, tungsten, palladium, nickel, and crystalline mixture of silica alumina; cobalt and molybdenum oxide on alumina nickel oxide, nickel thiomolybdate tungsten, nickel sulfide, vanadium oxides, and nickel thiomolybdate are used for sulfur removal, and nickel molybdenum catalyst is used for nitrogen removal. |
| Alkylation | Alkylation or “polymerization” is the process of forming longer molecules from smaller ones. Another process is isomerization, in which straight chain molecules are made into higher octane branched molecules. The reaction requires an acid catalyst at low temperatures and low pressures. The acid composition is usually kept at about 50%, making the mixture very corrosive. | Sulfuric acid, or hydrofluoric acid, HF (1–40 °C, 1–10 atm). Platinum onAlCl3/Al2O3 catalyst is used as a new alkylation catalyst. |
| Catalytic Reforming | This uses heat, moderate pressure, and fixed bed catalysts to turn naphtha, short carbon chain molecule fraction, into high-octane gasoline components — mainly aromatics. | Catalyst used is a platinum (Pt) metal on an alumina (AL03) base. |
| Treating Non-hydrocarbons | Treating can involve chemical reactions and/or physical separation. Typical examples of treating are chemical sweetening, acid treating, clay contacting, caustic washing, hydrotreating, drying, solvent extraction, and solvent dewaxing. Sweetening compounds and acids desulfurizes crude oil before processing and treats products during and after processing. |
During the separation process, sulfur from crude oil is removed only in exchange for traces of these catalysts. As discussed by Khan and Islam (2016), trace elements are not negligible and must be accounted for in determining long-term impacts. These trace elements will accompany the refined oil and will end up in combustion chambers, eventually polluting the CO2 emitted from a combustion engine. The inability of current detection techniques to identify these trace elements will not ensure that the pollution of CO2 does not take place. We will see in follow up chapters that contaminated CO2 is not acceptable by plants or trees, which reject this strand of CO2. This process ends up contributing to the overall concentration of CO2 in the atmosphere, delaying natural consumption and utilization of CO2 in the ecosystem. If the removal of sulfur is the objective, the use of zeolite can solve this problem. It is well known that naturally occurring zeolite has the composition to act as a powerful agent that would adsorb unwanted matters with high levels of adsorption, ion exchange, and catalytic actions (Primo and Garcia, 2014). However, numerous forms of synthetic catalysts have been developed each claiming to be optimized for a specific application.
Conventionally, synthetic catalysts are used for enhancing the petroleum cracking process. Even when naturally occurring chemicals are used, they are acid-treated. With the acid being synthetically produced, the process becomes irreversibly contaminated. More recently, microwave treatment of natural materials is being proposed in order to enhance the reactivity of natural materials (Henda et al. 2006). With microwave heating not being a natural process, this treatment will also render the process unsustainable. However, such treatment is not necessary because natural materials, such as zeolite, clay, and others, do contain properties that would help the cracking process (Lupina and Aliev 1991). Acid enhancing, if at all needed, can be performed with organic acid or acid derived from natural sources.
Acid-function catalysts impregnated with platinum or other noble metals are used in isomerization and reforming. Research on this topic has focused on the use of refined heavy metal elements and synthetic materials (Baird, Jr. 1990). These materials are known carcinogens and have numerous long-term negative effects on the environment. In addition, the resulting products are aromatic oils, carcinogenic polycyclic aromatic compounds, or other hazardous materials, and they may also be pyrophoric. This becomes a difficult short-term problem. When such a problem is addressed, solutions that are no more sustainable are usually offered. For instance, in order to combat pyrophoricy, a patented technology uses aromatic hydrocarbons such as alkyl-substituted benzenes including toluene, xylene, and heavy aromatic naphtha. Heavy aromatic naphtha comprises xylene and higher aromatic homologs (Roling and Sintim 2000). The entire process spirals further down the path of unsustainability. Table 6.2 shows the various processes and products used during the refining process. Each of the above functions can also be performed with natural substitutes that are cheaper and benign to the environment. This list includes the following: zeolites, alumina, silica, various biocatalysts, and enzymes in their natural state. The use of bacteria to decompose large hydrocarbon molecules offers an attractive alternative because the process is entirely sustainable (as per the Khan and Islam (2007) criterion. Khan and Islam (2007a) also suggest the use of gravity segregation from distillate lighter components to heavier ones. The use of solar heating, in conjunction with heating from flares that are available in the oil field, will bring down the heating cost and make the process sustainable.
Table 6.2 Various processes and products in oil refining process.
Conversion processes — UNIFICATION |
|||||
| Alkylation | Combining | Catalytic | Unit olefins and isoparaffins | Tower isobutane/cracker olefin | Iso-octane (alkylate) |
| Grease compounding | Combining | Thermal | Combine soap and oils | Lube oil, fatty acid, alky metal | Lubricating grease |
| Polymerizing | Polymerize | Catalytic | Unite 2 or more olefins | Cracker olefins | High-octane naphtha, petrochemical stocks |
CONVERSION PROCESSES—ALTERATION OR REARRANGEMENT |
|||||
| Catalytic reforming | Alteration/dehydration | Catalytic | Upgrade low octane naphtha | Coker/hydro-cracker naphtha | High oct. Reformate/aromatic |
| Isomerization | Rearrange | Catalytic | Straight chain to branch | Butane, | Isobutane/pentane/hexane |
| pentane, hexane | |||||
TREATMENT PROCESSES |
|||||
| Amine treating | Treatment | Absorption | Remove acidic contaminants | Sour gas, HCs | Acid free gases & liquid HCs |
| w/CO, & H„.5 | |||||
| Desalting | I > ol-,,drat on | Absorption | Remove contaminants | Crude oil | Desalted crude oil |
| Furfural extraction | Solvent | Absorption | Upgrade mid distillate & lubes | Cycle oils & lube feedstocks | High quality diesel&lube oil |
| extraction | |||||
Conversion processes — UNIFICATION |
|||||
| Hyfro desulfarization | Treatment | Catalytic | Remove sulfur, contaminants | High-sulfur residual/gas oil | Desulfurized |
| olefins | |||||
| Hydrotreating | Hydrogenation | Catalytic | Remove impurities, saturate HC’s | Residuals, cracked HC’s | Cracker feed, distillate, lube |
| Phenol extraction | Solvent | Abspt/therm | Improve vise, index, color | Lube oil base stocks | High quality lube oils |
| extraction | |||||
| Solvent deasphalting | Treatment | Absorption | Remove asphalt | Vac. tower residual, propane | Heavy lube oil, asphalt |
| Solvent dewaxing | Treatment | Cool/filter | Remove wax from lube stocks | Vac. tower lube oils | Dewaxed lube basestock |
| Solvent extraction | Solvent extr. | Abspt/precip. | Separate unsat. oils | Gas oil, reformate, distillate | High-octane |
| gasoline | |||||
| Sweetening | Treatment | Catalytic | Remove H2S, convert mercaptan | Untreated distilate/gasoline | High-quality distilate/gasoline |
| Process name | Action | Method | Purpose | Feeds tock(s) | Product(s) |
FRACTIONATION PROCESSES |
|||||
| Atmospheric | Separation | Thermal | Separate fractions | Desalted crude | Gas, gas oil, |
| distillation | oil | distillate, | |||
| residual | |||||
Conversion processes — UNIFICATION |
|||||
| Vacuum distillation | Separation | Thermal | Separate w/o cracking | Atmospheric tower residual | Gas, gas oil, lube, residual |
CONVERSION PROCESSES - DECOMPOSITION |
|||||
| Catalytic cracking | Alteration | Catalytic | Upgrade gasoline | Gas oil coke, distillate | Gasoline, |
| petrochemical | |||||
| feedstock | |||||
| Coking | Polymerize | Thermal | Convert vacuum residuals | Gas oil coke, distillate | Gasoline, |
| petrochemical | |||||
| feedstock | |||||
| Hydrocracking | Hydrogenate | Catalytic | Convert to lighter | Gas oil, cracked oil residual | Lighter higher quality products |
| HCs | |||||
| Hydrogen steam reforming | Decompose | Catalytic/thermal | Produce | Desulfurized gas, O,, steam | Hydrogen, CO, |
| hydrogen | co2 | ||||
| Steam cracking | Decompose | Thermal | Crack large molecules | Atm tower, heavy fuel/distillate | Cracked naphtha, coke, residual |
| Visbreaking | Decompose | Thermal | Reduce viscosity | Atm tower residual | Distillate tar |
Table 6.3 (compiled from the Environmental Defense 2005) enumerate the primary emissions at each activity level. There are seven primary air release emissions and 23 primary hazardous/solid wastes.
Table 6.3 Emissions from refinery.
Materials transfer and storage |
|
| Source | Emissions |
| Air releases | Carbon monoxide, nitrogen oxides, particulate matter, sulfur dioxide, VOCs (polluted with catalysts and other toxic additives) |
| Hazardous/solid waste | Ammonia, anthracene, benzene, 1–3-butadiene, cumene, cychlohexane, ethylbenzene, ethylene, methanol, naphthalene, phenol, PAHs, propylene, toluene, 1,2,4-trimethylbenzene, xylene (polluted with catalysts and other toxic additives) |
Separating hydrocarbons |
|
| Source | Emissions |
| Air releases | Carbon monoxide, nitrogen oxides, particulate matter, sulfur dioxide |
| Hazardous/solid waste | Ammonia, anthracene, benzene, 1–3-butadiene, cumene, cychlohexane, ethylbenzene, ethylene, methanol, naphthalene, phenol, PAHs, propylene, toluene, 1,2,4-trimethylbenzene, xylene (polluted with catalysts and other toxic additives) |
The primary hazardous/solid wastes include the following: 1,2,4-trimethylbenzene, 1,3-butadiene, ammonia, anthracene, benzene, copper, cumene, cyclohexane, diethanolamine, ethylbenzene, ethylene, hydrofluoric acid, mercury, metals, methanol, naphthalene, nickel, PAHs, phenol, propylene, sulfuric acid aerosols or toluene, vanadium (fumes and dust), and xylene.
The most important resource in the refinery process is energy. The refining process uses a lot of energy. Typically, approximately 2% of the energy contained in crude oil is used for distillation. The efficiency of the heating process can be increased drastically by combining direct solar heating (with non-engineered thermal fluid) with direct fossil fuel burning. The advantage of this process is a gain in global efficiency as well as environmental benefit. It is estimated that the total energy requirement for petroleum refining can be reduced to less than 0.5% of the energy contained in crude oil by designing the heating systems with a zero-waste scheme, as outlined by Khan and Islam (2016).
A number of procedures are used to turn heavier components of crude oil into lighter and more useful hydrocarbons. These processes use catalysts or materials that help chemical reactions without being used up themselves. Table 6.4 shows different toxic catalysts and base metals. Refinery catalysts are generally toxic and must be replaced or regenerated after repeated use, turning used catalysts into a waste source. The refining process uses either sulfuric acid or hydrofluoric acid as catalysts to transform propylene, butylene, and/or isobutane into alkylation products, or alkylate. Vast quantities of sulfuric acid are required for the process. Hydrofluoric acid (HF), also known as hydrogen fluoride, is extremely toxic and can be lethal. Using catalysts with fewer toxic materials significantly reduces pollution. Eventually, organic acids and enzymes, instead of catalysts, must be considered. Thermal degradation and slow reaction rates are often considered to be biggest problems of using organic acid and catalysts. However, recent discoveries have shown that this perception is not justified. There are numerous organic products and enzymes that can withstand high temperatures, and many of them induce fast reactions. More importantly, as discussed in Chapter 5 in the context of biodiesel, the process can be modified in order to eliminate the use of toxic substances (see Table 6.5).
Table 6.4 Primary wasters from oil refinery.
| Cracking/coking | Alkylation and reforming | Sulfur removal |
| Air releases: carbon monoxide, nitrogen oxides, particulate matter, sulfur dioxide, VOCs | Air releases: carbon monoxide, nitrogen oxides, particulate matter, sulfur dioxide, VOCs | Air releases: carbon monoxide, nitrogen oxides, particulate matter, sulfur dioxide, VOCs |
| Hazardous/solid wastes, wastewater: ammonia, anthracene, benzene, 1, 3-butadiene, copper, cumene, cyclohexane, ethylbenzene, ethylene, methanol, naphthalene, nickel, phenol, PAHs, propylene, toluene, 1, 2, 4-trimethylbenzene, vanadium (fumes and dust), xylene | Hazardous/solid wastes: ammonia, benzene, phenol, propylene, sulfuric acid aerosols or hydrofluoric acid, toluene, xylene Wastewater | Hazardous/solid wastes: ammonia, diethanolamine, phenol, metals Wastewater |
The same principle applies to other materials, e.g., corrosion inhibitors, bactericides, etc. Often, toxic chemicals lead to very high corrosion vulnerability, and even more toxic corrosion inhibitors are required. The whole process spirals down to a very unstable process, which can be eliminated with the new approach (Al-Darbi et al. 2002).
6.3 Additives and Their Functions
Oil refining and natural gas processing are very expensive processes in terms of operation and management. These operations involve the use of several chemicals and catalysts that are very expensive. Moreover, these catalysts and chemicals pose a great threat to the natural environment including air and water quality. Air and water pollution ultimately have impacts on the health of humans, animals and plants. For instance, the use of catalysts, such as lead, during crude oil refining to produce gasoline has been a serious environmental problem. Burning gasoline emits toxic gases containing lead particles, and the oxidation of lead in the air forms lead oxide, which is a poisonous compound affecting the lives of every living thing. Heavy metals such as mercury and chromium and the use of these metals in oil refining are major causes of water pollution that eventually permeates to the entire ecosystem. Consider the consequences of some of these chemicals.
6.3.1 Platinum
It is well known that platinum salts can induce numerous irreversible changes in human bodies, such as DNA alterations (Jung and Lippard 2007). In fact, an entire branch of medical science evolves around exploiting this deadly property of platinum compounds in order to manufacture pharmaceutical drugs that are used to attack the DNA of cancer cells (Farrell 2004a, 2004b, 2004 c, 2005). It is also known that platinum compounds cause many forms of cancer. Once again, this property of platinum is used to develop pharmaceutical drugs that could possibly destroy cancer cells (Volckova et al. 2003). Also, it is well known that platinum compounds can cause liver damage (Stewart et al. 1985). Similar damage to bone marrow is also observed (Evans et al. 1984). Platinum is also related to hearing loss (Rybak 1981). Finally, potentiation of the toxicity of other dangerous chemicals in the human body, such as selenium, can lead to many other problems.
Table 6.5 Chemicals used in refining.
| Chemicals used in refining | Purpose |
| Ammonia | Control corrosion by HCL |
| Tetraethyl lead (TEL) and tetramethyl lead (TML) | Additives to increase the octane rating |
| Ethyl tertiary butyl ether (ETBE), methyl tertiary butyl ether (MTBE), tertiary amyl methyl ether (TAME) | To increase gasoline octane rating and reduce carbon monoxide |
| Sulfuric Acid and Hydrofluoric Acid | Alkylation processes, some treatment processes. |
| Ethylene glycol | Dewatering |
| Toluene, methyl ethyl ketone (MEK), methyl isobutyl ketone, methylene chloride, ethylene dichloride, sulfur dioxide | Dewaxing |
| Zeolite, aluminum hydrosilicate, treated bentonite clay, fuller’s earth, bauxite, and silica-alumina | Catalytic cracking |
| Nickel | Catalytic cracking |
| Granular phosphoric acid | Polymerization |
| Aluminum chloride, hydrogen chloride | Isomerization |
| Imidazolines and Surfactants Amino Ethyl Imidazoline Hydroxy-Ethyl Imidazoline Imidazoline/Amides Amine/Amide/DTA | Oil soluble corrosion inhibitors |
| Complex Amines Benzyl Pyridine | Water soluble corrosion inhibitors |
| Diamine Amine Morpholine | Neutralizers |
| Imidazolines | Emulsifiers |
| Sulfonates | |
| Alkylphenolformaldehyde, polypropeline glycol | Desalting and emulsifier |
| Cobalt Molybdate, platinum, chromium alumina | |
| AlClj-HCl, Copper pyrophosphate |
Table 6.6 Pollution prevention options for different activities in material transfer and storages.
| Cracking/coking | Alkylation and reforming | Sulfur removal | Cooling |
| Using catalysts with fewer toxic materials reduces the pollution from “spent” catalysts and catalyst | Using catalysts with fewer toxic materials reduces the pollution from “spent” catalysts and catalyst manufacturing. | Use “cleaner” crude oil,” containing less sulfur and fewer metals. Using oxygen rather than air in the Claus plant reduces the amount ofhydrogen sulfide and nitrogen compounds produced. | Ozone or bleach should replace chlorine to control biological growth in cooling systems Switching from water cooling to air cooling could reduce the use of cooling water by 85%. |
The above are immediate concerns to human health and safety. Consider the damage to the environment that might be incurred through vegetation and animals (Kalbitz et al. 2008). It is already known that platinum salts accumulate at the root of plants, from which it can easily enter the food chain, perpetually insulting the environment. In addition, microorganisms can play a role to broaden the impact of platinum. This aspect of ecological study has not been performed as of now.
In the mean time, platinum is touted as a tool for remedying air pollution. Since 1976 in the United States, Canada, and Japan, and later in other countries, the exhaust system of gasoline powered cars has been equipped with catalytic converters containing Pt and/or Pd and/or Rh. This has resulted in a very significant decrease in urban air pollution for various chemical species such as NOx, CO, and hydrocarbons. While this ‘success’ is celebrated, New Science cannot fathom what toll this ‘success’. There has, however, been concern that their ever-increasing use might lead to Platinum Group Metals (PGMs) becoming widely dispersed in the environment. From the analysis of Pt, Pd, and Rh in central Greenland recent snow and ancient ice using the ultrasensitive inductively coupled plasma sector field mass spectrometry technique, Barbante et al. (2001) showed that the concentrations of these metals in snow dated from the mid 1990 s are indeed –40–120 times higher than in ice dated from 7000 years ago. The fact that such an increase is observed far away from populated areas at a high-altitude location indicates there is now a large-scale contamination of the troposphere of the Northern Hemisphere for PGMs. Pt/Rh mass ratio in the most recent snow samples is close to the same ratio documented for catalytic converter exhausts in a recent study, which suggests that a large fraction of the recent increase for Pt and Rh might originate from automobile catalytic converters.
Table 6.7 Catalysts and materials used to produce catalysts base metals and compounds.
| Names of catalysts | Name of metals base |
| Activated alumina, Amine, Ammonia, Anhydrous hydrofl uoric acid Anti-foam agents – for example, oleyl alcohol or Vanol, Bauxite, Calcium chloride, Catalytic cracking catalyst, Catalytic reforming catalyst, Caustic soda, Cobalt molybdenum, Concentrated sulphuric acid, Demulsifiers – for example, Vishem 1688, Dewaxing compounds (catalytic) – for example, P4 Red, wax solvents Diethylene glycol, Glycol –Corrosion inhibitors), Hydrogen gas, Litharge, Na MBT (sodium 2-mercaptobenzothiazole) – glycol corrosion inhibitor (also see the taxable list for Oil Refining – Corrosion inhibitors), Na Cap – glycol corrosion inhibitor (also see the taxable list for Oil Refining – Corrosion inhibitors), Nalcolyte 8103, Natural catalysts – being compounds of aluminum, silicon, nickel, manganese, iron and other metals, Oleyl alcohol – anti-foam agent, Triethylene glycol, Wax solvents – dewaxing compounds | Aluminum (Al), Aluminum Alkyls, Bismuth (Bi), Chromium (Cr), Cobalt (Co), Copper (Cu), Hafnium (Hf), Iron (Fe), Lithium (Li), Magnesium (Mg), Manganese (Mn), Mercury (Hg), Molybdenum (Mo), Nickel (Ni), Raney Nickel, Phosphorus (P), Potassium (K), Rhenium (Re), Tin (Sn), Titanium (Ti), Tungsten (W), Vanadium (V), Zinc (Zn), Zirconium (Zr), and More. |
At the same time, other publications indicate that even the use of platinum in catalytic converters has created a massive problem. In as early as 2001, Barbante et al., discussed the long-term impact of platinum and other precious metals on the air pollution. They reported that the planet has been covered with a fine layer of osmium due largely to efforts to clean up car exhausts, according to a global survey of rainwater. Externally, these are not considered to be harmful, mainly because they fall under the realm of ‘intangibles’ the science of which is beyond the current expertise of New Science (Jones, 2009). These pollutants come from cars that have been fitted with catalytic converters to keep nitrogen oxides and carbon monoxide out of the air. This cuts down on smog and has huge health benefits. But catalytic converters created a demand for platinum, which has its own environmental impact. The smelting of platinum can release metals into the air, for example — particularly osmium tetroxide, the impact of which is likely to be more significant than other pollutants that are featured prominently. Typically, it is the tangible aspect that alerts scientists and regulatory agencies to issue new measures. However, we make the point that focusing on tangibles will not resolve the crisis as the most important aspect of pollution takes place in intangible forms1 and by the time scientists can detect these forms (e.g., with new detection tools), the problem has already gone out of control. One such example is offered by recent work of Chen et al. (2009).
Chen et al. (2009) reported that the osmium concentration in surface ocean water has risen unexpectedly. Osmium is one of the rarer elements in seawater, with a typical concentration of ≈10 × 10−15g g−1 (5.3 × 10⁻¹⁴ mol kg−1). The osmium isotope composition (187Os/188Os ratio) of deep oceans is 1.05, reflecting a balance between inputs from continental crust (≈1.3) and mantle/cosmic dust (≈0.13). Chen et al. (2009) showed that the 187Os/188Os ratios measured in rain and snow collected around the world range from 0.16 to 0.48, much lower than expected (>1), but similar to the isotope composition of ores (≈0.2) that are processed to extract platinum and other metals to be used primarily in automobile catalytic converters. Present-day surface seawater has a lower 187Os/188Os ratio (≈0.95) than deep waters, suggesting that human activities have altered the isotope composition of the world’s oceans and impacted the global geochemical cycle of osmium. The contamination of the surface ocean is particularly remarkable given that osmium has few industrial uses. The pollution may increase with growing demand for platinum-based catalysts. This outcome was not certainly expected from platinum use.
6.3.2 Cadmium
Cadmium is considered to be a non-essential and highly toxic element to a wide variety of living organisms, including man, and it is one of the widespread pollutants with a long biological half-life (Plunket 1987; Klaassen 2001; Rahman et al. 2004). A provisional, maximum, tolerable daily intake of cadmium from all sources is 1–1.2 g/kg body mass (Bortoleto et al. 2004) and is recommended by FAO-WHO jointly. This metal enters the environment mainly from industrial processes and phosphate fertilizers and is transferred to animals and humans through the food chain (Wagner 1993; Taylor 1997; Sattar et al. 2004). Cadmium is very hazardous because humans retain it strongly (Friberg et al., 1974), particularly in the liver (half-life of 5 to 10 years) and kidney (half-life of 10 to 40 years). The symptoms of cadmium toxicity produced by enzymatic inhibition include hypertension, respiratory disorders, damage of kidney and liver, osteoporosis, formation of kidney stones, and others (Vivoli et al. 1983; Dinesh et al., 2002; Davis, 2006). Environmental, occupational, or dietary exposure to Cd(II) may lead to renal toxicity, pancreatic cancer (Schwartz 2002), or enhanced tumor growth (Schwartz et al. 2000). The safety level of cadmium in drinking water in many countries is 0.01ppm, but many surface waters show higher cadmium levels. Cadmium can kill fish in one day at a concentration of 10 ppm in water, whereas it can kill fish in 10 days at a concentration of 2 ppm. Studies with cadmium have shown harmful effects on some fish at concentrations of 0.2ppm (Landes et al. 2004). Plants can accumulate cadmium up to a level as high as 5 to 30 mg/kg, whereas the normal range is 0.005 to 0.02 mg/kg (Cameron 1992). Taken up in excess by plants, Cd directly or indirectly inhibits physiological processes, such as respiration, photosynthesis, cell elongation, plant–water relationships, nitrogen metabolism, and mineral nutrition, all of which result in poor growth and low biomass. It was also reported that cadmium is more toxic than lead in plants (Pahlsson 1989; Sanita di Toppi and Gabbrielli 1999). In particular, Sanitå di Toppi and Gabbrielli (1999) summarized the state of the art of higher plant responses to cadmium. The principal mechanisms reviewed included phytochelatin-based sequestration and compartmentalization processes, as well as additional defense mechanisms, based on cell wall immobilization, plasma membrane exclusion, stress proteins, stress ethylene, peroxidases, metallothioneins, etc. An analysis of data taken from the international literature has been carried out, in order to highlight possible ‘qualitative’ and ‘quantitative’ differences in the response of wild-type (non-tolerant) plants to chronic and acute cadmium stress. The dose-response relationships indicate that plant response to low and high cadmium level exposures is a very complex phenomenon, in which cadmium evokes a number of parallel and/or consecutive events at molecular, physiological and morphological levels. They postulated that above all in response to acute cadmium stress, various mechanisms might operate both in an additive and in a potentiating way. Thus, they called for a holistic and integrated approach to study of the response of higher plants to cadmium. While cadmium detoxification is a complex phenomenon, authors found tolerance to cadmium in mine plants or in plant systems artificially grown under long-term selection pressure, exposed to high levels of cadmium to be a linear process, possibly involving only monogenic/oligogenic control. They concluded that, following a ‘pyramidal’ model, (adaptive) tolerance is supported by (constitutive) detoxification mechanisms, which in turn rely on (constitutive) homeostatic processes. The presence of Cd leads to long-term adaptation mode and found to affect long-term selection pressure, which may increase the frequency of one or a few tolerance gene(s). It is to be noted that the cadmium that was used by these researchers was that of refined kind, meaning they are not in their natural form, in which case it would cause little harm in low concentration and more importantly could be expelled from the organic system in case the concentration is too high for absorbance.
In engineering terms, this behaviour can be explained by metal-organic framework (MOF) materials, which are related to organic chemistry, inorganic chemistry, polymeric materials, physics, crystal engineering and topology, and other scientific fields. In the context of Climate change, MOF plays an important role in gas storage, gas purification, and as such as can offer an explanation why a small amount of cadmium can render a huge volume of CO2 unacceptable to the plants and trees, thus releasing them in the atmosphere as ‘tainted’. This tainted CO2 is the main cause of global increase in the CO2. It is known that carboxylic acid ligands can form multi-functional complexes with many kinds of metals. Zhang et al. (2016) synthesized nine new tetranuclear centrosymmetric linear complexes that are called tetranuclear complexes. Magnetic studies reveal that both DyIII-based complexes (3 and 8) exhibit single-molecule magnet (SMM) behavior under a zero dc field. Furthermore, complex 3 presents one relaxation process under a zero dc field, while application of an external dc field (1500 Oe) induces multi-relaxation signals of the ac magnetic susceptibility. This study showed strong link between Cd (of artificial origin) and distortion of the magnetic field, which can have fundamental impact on the way these molecules interact with carboxyl groups.
Zhao et al. (2018) used a new cadmium complex, [Cd2(dcpa)·2H2O]n·H2O (1), which was synthesized by hydrothermal reaction based on the multiple acid ligand 4-(2,5-dicarboxyphenoxy)phthalic acid (H4-dcpa). Single crystal X-ray diffraction analysis reveals that 1 is a three-dimensional structure with pores. The result of X-ray diffraction analysis revealed that the complex, with a formula of Cd2 C16H12O12, crystallizes in the triclinic system, space group P-1. The asymmetric unit consists of two Cd ions, one dcpa ligand and three water molecules (O3, O11, and O12) in the lattice. As depicted in Figure 6.4 (a), Cd1 is surrounded by five O atoms (O1, O2, O5B, O7C, and O9C) from a dcpa ligand and one O atom (O3) from water; Cd2 is surrounded by five O atoms (O4A, O5A, O8D, O10, and O10E) from a dcpa ligand and one O atom (O11) from water. The coordination geometry can be described as a distorted octahedron. The O-Cd-O angles are in the range of 53.06(14) to 159.75(17)°. The Cd–O bond lengths are in the range of 2.244(4)–2.474(4) Å; the bond lengths are within the normal range. The neighboring Cd ions were linked by the carboxylate groups along the a-axis to form a rod-shaped secondary building unit (SBU) (Figure 6.4 (b)). The adjacent SBUs were further linked by the dcpa ligand to form a three-dimensional network structure (Figure 6.4 (c)).

Figure 6.4 (a) Coordination environment of Cd in complex 1; Symmetry code: A: x, 1 + y, z; B: 1 – x, 1 – y, 2 – z; C: x, y, 1 + z; D: –1 + x, y, z; E: –x, 2 – y, 1 – z; (b) Rod-shaped secondary building unit of complex; (c) Three-dimensional network structure; Hydrogens are omitted for clarity.
The fluorescence test results show that the complex has excellent blue fluorescence. The adsorption of nitrogen and carbon dioxide gas test results show that the complex has adsorption effects on carbon dioxide. This is of significance vis-à-vis greenhouse gases. N2 and CO2 adsorption measurements (up to 1 bar) were performed on an Autosorb-3.0 (Quantachrome) volumetric analyzer (Figure 6.5).

Figure 6.5 Structure of H4 dcpa.
The solid-state fluorescence spectra of H4-dpca and 1 were recorded at room temperature on a FLS980 spectrophotometer under an excitation of 320 and 260 nm, respectively. Figure 6.6 (a) shows that H4dpca itself has a weak emission at around 468 nm. Complex 1 shows a strong emission peak at 350 nm; the complex formed has a large anti-stock’s shift of about 118 nm. This phenomenon is attributed to the intramolecular charge-transfer effect caused by Cd coordination. In other words, the blue shift of the complex should be attributed to formation of the dpca–Cd coordination complex that brings about the change of the electronics of dpca. The coordination interaction between Cd and dcpa will reduce the electron-withdrawing ability of the oxygen atoms, lower the electron density of dcpa, shift the frontier orbital level, and thus result in the blue shift of absorption as well as fluorescence emission. At the same time, the fluorescence intensity of the complex is eight times that of the ligand. The CIE chromaticity indicates that the position of the ligand H4dpca is (0.02, 0.23), but that of the complex is (0.15, 0.05), and from the CIE chromaticity diagram the great blue shift of the complex can be directly seen. The enhancement of luminescence in the complex are attributed to several factors. First, the conjugation effect of the new system was enhanced after the coordination reaction, which effectively increases the rigidity of the ligand and reduces the loss of energy by radiationless decay. At the very minimum, this means a change in the natural frequency of ligand. Secondly, organic ligands have a high UV absorption coefficient; after the complex was formed, energy absorbed by the dpca will efficiently transfer to the Cd ion and the results lead to a high fluorescence efficiency of the complex. Due to its porous structure and structural rigidity, a N2 adsorption experiment at 77 K and CO2 adsorption at 273 K in an ice-water bath were performed to evaluate the porosity of 1. The pore diameter of the complex is 3.814 nm as measured by Autosorb-3.0 (Quantachrome) volumetric analyzer, and the total accessible volume of the fully desolvated complex 1 is ca. 15.1% (863.2 Å3 per unit cell vol), calculated using the PLATON program. As shown in Figure 6.7 (a), the complex has a weak adsorption effect on nitrogen. The experimental results show that the isotherm presented a typical type I curve, which is characteristic of microporous materials. As is seen in Figure 6.7 (b), the CO2 adsorption experimental results show that the adsorption amounts of CO2 increase abruptly over the low-pressure range, up to 14 cm3/g (STP) at 0.2 atm and finally up to 18 cm3/g at 1 atm. It can be seen from the adsorption curve that the carbon dioxide and the complex have a strong interaction. Also, it can be seen from the desorption curve that desorption of carbon dioxide has some hysteresis. It means that the organic body will retain part of the chemical but will release enough to the CO2 that will remain ‘tainted’ and thus unabsorbable by the organic system.
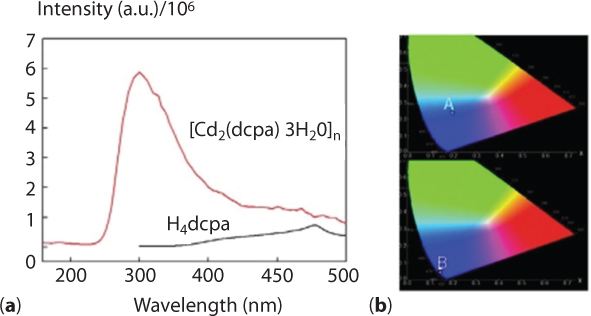
Figure 6.6 (a) Emission spectra H4 dpca and 1; (b) CIE chromaticity diagram of H4 dpca (A) and 1 (B) (From Zhao et al., 2018).
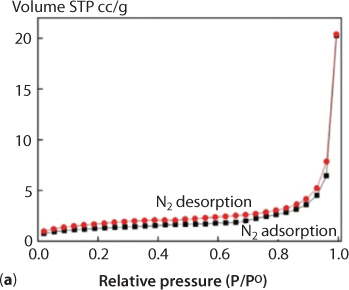
Figure 6.7 (a) The N2 adsorption/desorption isotherms of 1 at 273 K (Zhao et al., 2018).
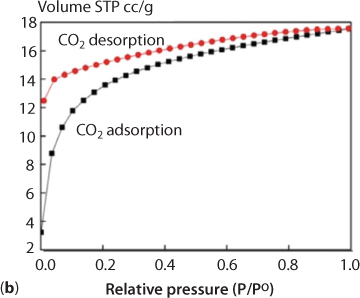
Figure 6.7 (b) CO2 adsorption isotherms of 1 at 273 K. (Zhao et al., 2018).
6.3.3 Lead
Lead (II) is a highly toxic element to humans and most other forms of life. Children, infants, and fetuses are at particularly high risk of neurotoxic and developmental effects of lead. Lead can cause accumulative poisoning, cancer, and brain damage, and it can cause mental retardation and semi-permanent brain damage in young children (Friberg et al. 1979; Sultana et al. 2000). At higher levels, lead can cause coma, convulsion, or even death. Even low levels of lead are harmful and associated with a decrease in intelligence, stature, and growth. Lead enters the body through drinking water or food and can accumulate in the bones. Lead has the ability to replace calcium in the bone to form sites for long-term release (King et al. 2006). The Royal Society of Canada (1986) reported that human exposure to lead has harmful effects on the kidney, the central nervous system, and the production of blood cells. In children, irritability, appetite loss, vomiting, abdominal pain, and constipation can occur (Yule and Lansdown 1981). Pregnant women are at high risk because lead can cross the placenta and damage the developing fetal nervous system; lead can also induce miscarriage (Wilson 1966). Animals ingest lead via crops and grasses grown in contaminated soil. Levels in plants usually range from 0.5 to 3 mg/kg, while lichens have been shown to contain up to 2,400 mg/kg of lead (Cameron 1992). Lead ingestion by women of childbearing age may impact both the woman’s health (Lustberg and Silbergeld, 2002) and that of her fetus, for ingested lead is stored in the bone and released during gestation (Angle et al. 1984; Gomaa et al. 2002).
Conventional analysis does not reveal how lead can affect the nature of carbon dioxide or pollute the air. However, it is known that metal electrodes such as Cu, Pb and Zn have been extensively employed in the electrochemical reduction of CO2. Depending on the metal used as cathode the final reaction products can vary considerably. This wide range of end products extends from hydrocarbons (methane, propane, ethylene, etc.) to oxygenated molecules, the most important of which are methanol, ethanol, and formic and oxalic acids. The reaction product distribution is very sensitive to various parameters such as applied potential, buffer strength and local pH, local CO2 concentration, CO2 pressure and the surface crystal structure of the electrode. The metals which have been found to most effectively catalyse CO2 reduction are those with a small number of electrons in the sp orbital and/or full d-orbitals. Examples of these include In, Pb, Cu and Pd. They all reduce CO2 into carbon monoxide. Any of these reactions can poison the CO2 in the atmosphere.
Carbon dioxide can be reduced to a wide range of end products. Each of these paths from CO2 to a particular product can be described as one of many competing ‘overall’ reactions. The extent to which each progresses will depend on the metal catalyst, the electrolyte and the cathode potential. Overall reactions are, however, a series of intermediate steps with competing reactions at each of these steps. Depending on the nature of the metal catalyst (natural state or artificial state), it is possible therefore that an overall reaction with a very positive open circuit potential, may not occur to a significant extent within a particular system. This will be the case if one of the intermediate steps does not occur to a significant extent, there being a more favoured alternative reaction at that point. Chaplin and Wragg (2003) conducted electroreduction of carbon dioxide in aqueous and alkaline medium having hydrogenocarbonate ions as the predominant species in solution (pH = 8.6 after bubbling CO2 in a 0.1 M NaOH solution). Taking into account the bands of species present in various spectra obtained with in situ IR reflectance spectroscopy, they proposed a reaction mechanism of selective hydrogenation of HCO3− to HCOO−. The disappearance of the band ascribed to CO2 when applying a cathodic electrode potential gives evidence that CO2 is not absorbed nor is it the electroreducible species on the lead electrode surface. Accordingly, formate was the exclusive organic species identified from HCO3− reduction during chronoam-perometry/FTIRS experiments at –1.6 V vs. SCE in aqueous medium. This study was significant because it related cathode properties in terms of the electron configuration of the metal catalysts present within the cathode, the adsorption/desorption properties of which can be predicted from these electron configurations. This allows predictions to be made as to which metal groups are likely to produce the longest lasting impact on the environment.
There has long been an interest in the electroreduction of CO2 in order to make carbon based compounds, and there have been parallels drawn between this and photosynthesis, albeit being the unnatural version of it. In their review of the topic, Jitaru et al. (1997) refer to papers which review over 100 years of work on the subject. The review concludes that CO2 represents an infinite source of carbon that can be generated into methanol, ethanol, aldehydes, methane, ethylene, formic and oxalic acids. An alternative option is to develop a process that will produce a useful ratio of CO to H2 (i.e., Syngas). The growing promise of electrochemical methods is leading to many papers and patents. Much work is also ongoing on photocatalytic reduction. Carbon dioxide can be reduced to a wide range of end products. Each of these paths from CO2 to a particular product can be described as one of many competing ‘overall’ reactions. The extent to which each progresses will depend on the metal catalyst, the electrolyte and the cathode potential. Each overall reaction has its own open circuit potential and, for any given system, its own ‘overpotential against current density’ profile. Overall reactions are, however, a series of intermediate steps with competing reactions at each of these steps. It is possible therefore that an overall reaction with a very positive open circuit potential, may not occur to a significant extent within a particular system. This will be the case if one of the intermediate steps does not occur to a significant extent, there being a more favoured alternative reaction at that point. Some of the common reduction products are shown in Table 6.8.
Table 6.8 Equilibrium potentials for various co2 electroreduction reactions (from jitaru et al., 1997).
| E/V | |
| 2CO2+2H++2e− → H2C2O4 | –0.475 |
| CO2+2H++2e− → HCOOH | –0.199 |
| CO2 + 2H+ + 2e− → CO + H2O | –0.109 |
| CO2 + 4H+ + 4e− → HCHO + H2O | –0.071 |
| CO2 + 6H+ + 6e− → CH3OH + H2O | +0.030 |
| CO2 + 8H+ + 8e− → CH4 + 2H2O | +0.169 |
The competing intermediate reactions and resulting products can be most easily shown in a branching form. At each point, competing reactions create different branches. Eventually, end products can be grouped together according to what intermediate species they have in common. In Figure 6.8, each competing reaction is given a reference letter. Many of the reaction paths are described in differing ways by different workers, for example, path –B is frequently described as being a reaction between CO2ad and either Had or H2Oad.
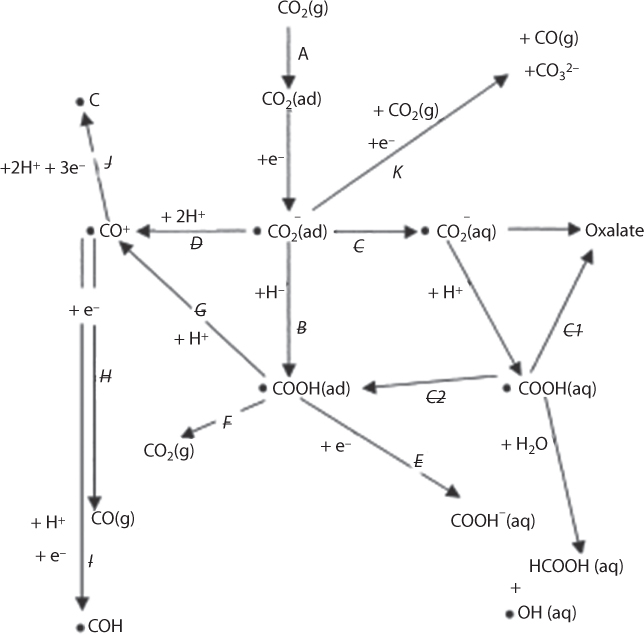
Figure 6.8 CO2 reduction routes commonly proposed for an acid system (From Chaplin and Wragg, 2003).
Innocent et al. (2010) formulated the reduction mechanism of the synthesis of formate from hydrogenocarbonate on lead electrode in alkaline solution. Taking into account the bands observed in spectra the various analyses focused on a selectivity of the reaction towards formate. The following hydrogenocarbonate reduction formulation was assumed.
The first step is the reduction of the solvent, as shown by Chaplin and Wragg (2003):
(6.1)
Then the adsorption of hydrogenocarbonate at the lead sites could be written:
(6.2)

Hydrogenation then occurs by the interaction between two adsorbed species:
(6.3)

(6.4)

This assumed mechanism is almost analogous to that reported by Jitaru et al. (2003) for the “sp” group metal cathodes that we discussed. Additional evidences were provided herein, with the adsorbed species obtained by in situ FTIR spectroscopy. Actually, potential-dependent shifts of HCO3−ads (30 cm−1/V) and HCOO−ads (26 cm−1/V) were found in Figure 6.9, Figure 6.10, which denotes weak adsorptions on lead electrode in comparison with those obtained with COL on Pt (45 cm−1/V).
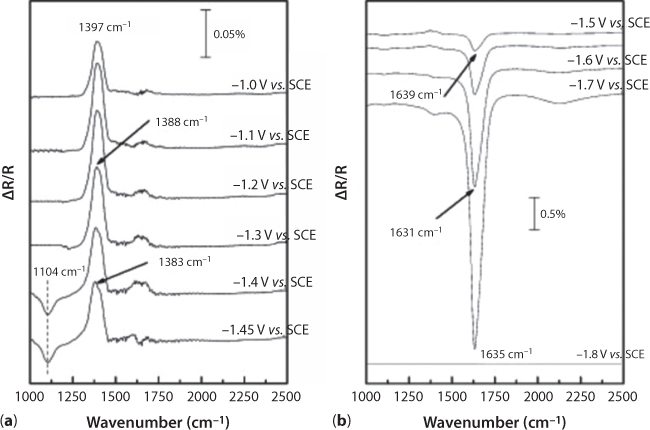
Figure 6.9 SPAIR spectra on a Pb electrode after bubbling CO2 in 0.1 M NaOH until pH = 8.6; ΔR/R = (RE2 – RE1)/RE1, where the “reference” spectrum, RE1, was taken at E = –1.8 V vs.SCE. (a) Electrode potential from –1.0 V to –1.45 V vs. SCE. (b) Electrode potential from –1.5 V to –1.8 V vs. SCE (From Chaplin and Wragg, 2003).
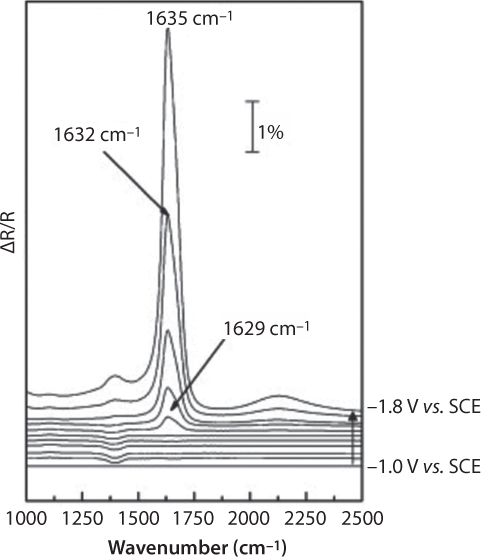
Figure 6.10 SPAIR spectra on a Pb electrode after bubbling CO2 in 0.1 M NaOH until pH = 8.6; ∆R/R = (RE2 – RE1)/RE1, where the “reference” spectrum, RE1, was taken at E = –1.0 V vs.SCE (From Chaplin and Wragg, 2003).
6.4 Science of Nanoscale
Unlike commonly held belief, the use of nanoparticles has a long history. Nanoparticles were used by artisans as far back as the 9th century in Mesopotamia for generating a glittering effect on the surface of pots. This was denoted as “luster art,” which refers to a metallic film applied to the transparent surface of a glazing, consisting of Cu or Ag nanoparticles. In this way, beautiful iridescent reflections of different colours (in particular gold and ruby-red) are obtained (Padeletti, and Fermo, 2003). During the Islamic golden era (8th-13th centuries), this technology was taken to another high as non-gold decoration materials are sought after in Islamic culture (Khan and Islam, 2016). Michael Faraday was the first one among New scientists to study the size-dependent optical properties of gold and silver colloids or nanoparticles (Wilcoxon, 2009). However, only recently renewed interest in nanoparticles has emerged, mainly because of the possibility of revolutionizing novel materials production (Zaman et al, 2012; Islam and Mokhatab, 2018; Morris, 2011). In the modern era, and in the last decade in particular, insights and discoveries in the field of nanostructures are booming (Morris, 2011).
The combination of reduced size and special properties make nanoscience intriguing. Nearly 3 decades of worldwide revolutionary developments in nanoscience, combining physics, chemistry, material science, theory and even biosciences, have brought us to another level of understanding. The public interest and popularization of nano-technology has made the importance of this science synonymous with the Information Age. With it has come the ‘science fiction’ version of New Science. New Science has morphed into quantum science, with the promise to fabricate, characterize, and manipulate any natural tendencies of nature into artificial structures, whose features are controlled at the nanometer level. Such properties can be, for instance, strength, electrical and thermal conductivity, optical response, elasticity, or wear resistance. Research is also evolving toward materials that are designed to perform more complex and efficient tasks. Examples include materials that bring about a higher rate of decomposition of pollutants, a selective and sensitive response toward a given biomolecule, an improved conversion of light into current, or more efficient energy storage. For such and more complex tasks to be realized, novel materials have to be based on several components whose spatial organization is engineered at the molecular level. The problem is, nano-technology has encouraged development of technologies that are excellent in producing results that conform to the market demand rather than addressing the problem of original unsustainability of a technique. For instance, the microelectronics industry is fabricating integrated circuits and storage media whose basic units are approaching the size of few tens of nanometers. For computers, “smaller” means higher computational power at lower cost and with higher portability. Unfortunately, the advent of new methods for the controlled production of nanoscale materials has provided new tools that can be adapted for this purpose, all maximizing speed of producing results for the smallest amount of investment costs. New terms such as nanotubes, nanowires, and quantum dots are now common jargon of scientific publications. These objects are among the smallest man-made units that display physical and chemical properties which make them promising candidates as fundamental building blocks for novel transistors. The advantages envisaged here are higher device versatility, faster switching speed, lower power dissipation, and the possibility of packing many more transistors on a single chip. However, this race toward higher performance assumes that original versions are actually accurate and sustainable. In reality, the opposite is the truth, as outlined by Islam et al. (2016). This trend in nanotechnology has virtually guaranteed new technologies are more unsustainable than the older ones. As intervention takes place in locations involving smaller ‘particles’, the departure from natural order takes place at a more fundamental level. This is very similar to what has happened in the agricultural section that has seen the use of toxic pesticide with even more harmful genetic modification schemes, as discussed in Chapter 5.
Similarly, the pharmaceutical and biomedical industries are rushing to synthesize large supramolecular assemblies and artificial devices that mimicking the superficial aspects of the complex mechanisms of nature or that can be potentially used for more efficient diagnoses and better cures for diseases. Examples in this direction are nano-capsules such as liposomes, embodying drugs that can be selectively released in living organs, or bioconjugate assemblies of biomolecules and magnetic (or fluorescent) nanoparticles that may provide faster and more selective analysis of biotissues. The entire exercise hovers around developing more and more unnatural means to study nature. Of course, whenever a contradiction arises, it is countered with dogmatic fervor and yet another new term is coined to explain away paradoxical ‘science’ (Islam et al., 2015).
ISO’s working definition of Nanotechnology is: the application of scientific knowledge to the control and use of matter at the nanoscale, where size related phenomena and processes may occur (ISO, n.d.). The type of properties that could not be perceived in the past, such as, ultralightweight, superstrong, rust-proof materials, could be developed based on nanoscale technology. Laboratory measurements have made it clear that one can take a multiwall carbon nanotube and get what amounts to 100-gigapascal tensile strength, which is 20 times stronger than the strongest carbon fiber made today. The intrigue in this technology is, unlike common perception, there needs to be no genetic-engineering like manipulation involved. Carbon nanotubes are essentially continuous Buckyballs, allotropes of carbon with a cylindrical nanostructure. Nanotubes can be single- or multiple-walled, and can be constructed with a length-to-diameter ratio of up to 132 million-to-1, significantly larger than any other material. It is well known that the carbon-to-carbon bond is the strongest of all possible elemental bonds, with nanotubes exhibiting tensile strengths 100 times that of steel. In addition to their extraordinary strength, nanotubes have novel electrical and thermal conductive properties that give them potential value in a range of applications but that are extremely difficult to characterize with new science. This difficulty stems from the fact that the atomic theory has been hopeless in addressing these problems because none of the conventional theory applies in nanoscale.
Nanotechnology deals with the small construction at the atomic and molecular levels about the length occupied by five to ten atoms stacked together or equivalently, 1/50000th the diameter of human hair. At least one characteristic length of the constructional and functional unit of nanostructure should be in nanometer range. At this dimension, amazing manifestation of the nano-materials –such as, 10 times lighter but 250 times stronger than steel – creates the potential for a new horizon in different areas of science and technology. The petroleum industry is not an exception. This industry too needs technological breakthrough to meet the tremendous increase in demand.
At present, the fascination for understanding nano-scale phenomenon is entirely driven by economics. The economic and societal promise of nanotechnology has led to involvement and investments by governments and companies around the world. The type of involvement US government had in terms of internet technology that has onset the Information age is repeated in nanotechnology. As early as 2000, the United States became the first nation to establish a formal, national initiative to advance nanoscale science, engineering, and technology—the National Nanotechnology Initiative. This initiative has generated significant domestic and international investment opportunities in nanoscale research. In 2014, Lux Research, an emerging technologies consulting firm, estimated total (public and private) global nanotechnology funding for 2012 to be approximately $18.5 billion (Report 1). Previously, Lux Research had estimated that in 2010 corporate R&D had surpassed publicly funded R&D for the first time (Report 2).
Another company, Cientifica, a privately held nanotechnology business analysis and consulting firm, estimated global public investments in nanotechnology in 2010 to be approximately $10 billion per year, with cumulative global public investments through 2011 reaching approximately $67.5 billion. In 2011, Cientifica also concluded that the United States had fallen behind both Russia and China in nanotechnology R&D funding on a purchasing power parity (PPP) basis (which takes into account the price of goods and services in each nation), but still led the world in real dollar terms (adjusted on a currency exchange rate basis) (Cientifica, 2011). Global investments in nanotechnology have begun to yield economic benefits as products incorporating nanotechnology enter the marketplace. Nano-enabled products are estimated to have produced $731 billion in revenues in 2012 (Lux, 2014). These offer great potentials for future applications of nanotechnology. The current market includes nanotechnology products—such as faster computer processors, higher density memory devices, lighter-weight auto parts, more energy-efficient computer and television displays, stain-resistant clothing, antibiotic bandages, cosmetics, and clear sunscreen—are evolutionary in nature, offering incremental improvements in characteristics such as performance, aesthetics, cost, size, and weight.
Figure 6.11 shows how various organizations predicted revenues from nanotechnology activities. Some pessimistic sides of these predictions vastly ignore the applications in the oil and gas industry. Magnetic Sensing, although known throughout history, has taken a new meaning under the auspices of nanotechnology revolution. Today, such particles can be manufactured. These nanoparticles that can be manipulated using magnetic field gradients. Such particles commonly consist of magnetic elements such as iron, nickel and cobalt and their chemical compounds. They might involve particle size ranging from 0.5 nm to 500 nm. While nanoparticles are smaller than 1 micrometer in diameter (typically 5–500 nanometers), the larger microbeads are 0.5–500 micrometer in diameter. The magnetic nanoparticles are attractive for many applications, ranging chemical engineering to medicine. Specific applications are in developing catalysts (Tadic et al., 2014; Lu et al., 2004), biomedicine (Gupta and Gupta, 2005), magnetically activated photonic crystals (He et al., 2014), microfluidics (Kavre et al., 2014), magnetic resonance imaging (MRI) (Mornet et al., 2006), magnetic particle imaging (Gleich and Weizenecker, 2005), data storage (Frey et al., 2009), environmental remediation Hoel et al., 2004; Azain Abdul Kadhar et al., 2014), nanofluids (Philip et al., 2006), optical filters (Philip et al., 2003), defect sensor (Mahendran, 2012), and cation sensors (Philip et al., 2013). The physical and chemical properties of magnetic nanoparticles can be greatly affected by slight changes in synthesis method and chemical structure. Only recently, techniques are emerging that would allow one to invoke changes without altering natural properties of matter (Kalia and Averous, 2011). Islam and Mokhatab (2018) recently identified major research thrusts in nanotechnology as follows:
- Characterization of nanomaterials
- Pathway analysis of natural and engineered nanomaterials
- Synthesis and manipulation of nanomaterials and the long-term impact on the environment
- Modeling of nanoscale phenomena
- Novel methods of microscopy and spectroscopy
- Natural nanoparticles as nanosensors
- Novel methods for describing forces prevalent in nanoscale
- Comprehensive modeling of subatomic particles
- Novel nanosensors j. Nanomagnetics
- Nanobiotechnology and health impact
- Coprehensive theories of nano-optics, nano-photonics
- Nanoscaled modeling and simulation
- Scaling up of nanoscale phenomena
- EOR and Improved Waterflood with nanofluid
- New generation of 4D mappin
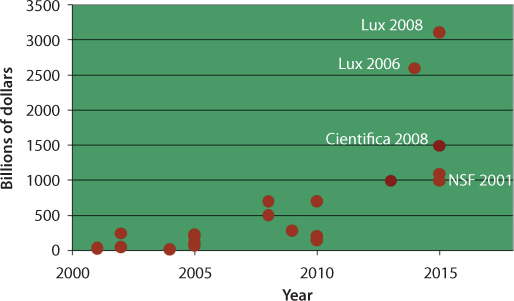
Figure 6.11 Estimates of revenues from nanotechnology applications in USA (updated from Tiague, 2007).
The previous line of research has been strictly on the path of developing engineered materials. It has been almost forgotten what the purpose of the research actally was. Picture 6.1 shows how far this obsession with artificial has gone. This picture shows how nanomaterials are being ‘branded’.
If the premise that unnatural cannot be sustained (Khan and Islam, 2012), one must have concern for the long-term impact of the engineered chemicals. This concern has been in the forefront of US strategy. For instance, Mihelson (2013) writes:
However, upon further review of this particular set of “top 10” priorities, the third entry on the list might seem somewhat out of place. Titled “Small Comfort”—and illustrated with a circular image encompassing a series of hexagonal shapes that, perhaps, are meant to indicate the structure of atoms and molecules—the ensuing description notes that “long touted as the next ‘big thing,’ nanotechnology is already moving from research to market…. But safety concerns continue to dog the emerging field” to the extent that “the next president must decide if the country needs to revise its nano safety strategy to strengthen protections for the public” (Michelson, 2013).
Whereas natural water-borne nanoparticles are ubiquitous, their very small size, ranging from 1 to 100 nanometers means they are both highly mobile and chemically reactive. Nanoparticles are central in buffering environmental systems, serving the dual role of limiting potentially toxic metal concentrations, while at the same time providing a supply of metals at levels that enables biochemical reactions to take place. Recent analysis of Islam et al. (2015) indicates that natural nanomaterials are both sustainable and necessary for the ecosystem, whereas engineered materials are bound to show negative impact on the environment.
6.4.1 Connection Between Subatomic and Bulk Properties
One of the biggest problems in describing material properties is the fact that the theories are based on atomic theory whereas validated with bulk properties, while bulk properties are observable and measurable, atomic and subatomic properties are not (Khan and Islam, 2016). In fact, it is clear today that at no space solid, rigid, uniform, and spherical particles that was once thought to be atom do not exist. Instead, subatomic particles are more akin to clouds – a phenomenon that has been described by Islam with his ‘galaxy model’ (Islam, 2014). This galaxy model is capable of explaining both nano- and bulk-scale properties. It is important to have a correct description of fundamental building ‘blocks’ because if they are described improperly, the description of the macro-system will be meaningless irrespective of what parameters are introduced in order to match bulk properties with governing equations.

Picture 6.1 Laboratory name is branded on nanomaterials with focused ion beam.
Take, for instance, an example of an atom. If this atom is considered to be a collection of single nucleus and electrons, with nucleus being a collection of rigid particles and electrons are much smaller rigid particles, there is no room left to consider some 69 smaller particles that we know exist. This description is not any improvement over the original atomic theory that considered the entire atom to be a solid spherical particle.
However, New Science takes the pragmatic approach and forces analytical solutions based on hydrogen atom (Atkins, 1986; Karplus and Porter, 1970). It is assumed that one electron orbits around one proton with the following properties remain constant:
- size of the proton (comes from the assumption that it’s a rigid, uniform sphere.
- uniform spinning rate and angle
- uniform orbital path
The above assumptions collapse, of course, as soon as there is more than one electron, in which case nuclear-electron force has to be adjusted for accommodating electron-electron forces. This complexity is addressed by invoking approximations, because of the presence of a non-linear terms make it impossible to determine an analytical solution. In order to justify such assumptions, the notion of atomic orbital (AO), with an associated discrete energy level is introduced. No justification for such discrete nature of energy level is given. In addition, various angular moments are ascribed, once again without justification. Different types of orbital shapes are introduced, such as, spherical (s-orbital), club-like (p-orbital) or a more complicated (d-, f -orbitals) shape. The eight valence electrons of a neon atom, for example, occupy one s- and three p-orbitals around the nucleus, one spin up and one spin down per orbit (Karplus and Porter, 1970), where the energy level of the s-orbital is lower than that of the p-orbitals. The reason there is no explanation is provided is that quantum mechanics is invoked. The rules of quantum mechanics dictate that the energy levels are discrete. In layman’s terms, this illogical assertion means there is this dogma that A can be A and B at the same time. As pointed out by Islam et al. (2015; 2016) and Khan and Islam (2016), this is simply the polished and disguised version of Dogma.
The next level of dogma ‘science’ moves to a bigger structure, that is the molecule that obtained from the combination of several atoms. It is thus asserted that electrons orbit collectively around more than one nucleus. In a molecule, electrons that are responsible for the covalent bonds between individual atoms can no longer be ascribed to one individual atom, but they are “shared”. For instance, in methane (CH4), each of the four sp3 atomic orbitals of the central carbon atom is linearly combined with the s orbital of a hydrogen atom to form a bonding (σ) and an anti-bonding (σ) orbital, respectively. Since these orbitals are “shared” between the atoms, they are called molecular orbitals (MO, see Figure 6.12). The straw man argument that the lowest energy (bonding) orbitals are occupied, therefore the stability of methane is assured is made (Karplus and Porter, 1970). Based on this aphenomenal model, which is a refined version of the original Atomic theory, is then used to derive the electronic structure of more complex systems such as large molecules or atomic clusters. While combining atoms to form a molecule, discrete energy levels of the atomic orbitals are added to obtain similarly discrete levels of molecular orbitals (Atkins, 1986). When the size of a polyatomic system becomes progressively larger, the calculation of its electronic structure in terms of combinations of atomic orbitals becomes unfeasible (Harrison, 1989) and another level of absurdity is introduced. Simplifications arise if the system under study is deemed to be periodic, thus reaching the level of an infinite series. This assumption is invoked for, for instance, crystals. In this model, perfect translational symmetry of the crystal structure is assumed, and contributions from the surface of the crystal are neglected by assuming an infinite solid (periodic boundary conditions). Electrons are described as a superposition of plane waves extended throughout the solid. With these fantastically unnatural traits, the new model emerges as being able to eliminate the assumption of discrete energy and the description of Figure 6.12 emerges. In reality, this model is not any less absurd than the original discrete model, albeit with the newly added complexity giving it a cosmetic of a real model that captures reality.

Figure 6.12 Electronic energy levels depending on the number of bound atoms. By binding more and more atoms together, the discrete energy levels of the atomic orbitals merge into energy bands (here shown for a semiconducting material). Therefore semiconducting nanocrystals (quantum dots) can be regarded as a hybrid between small molecules and bulk material.
Of course, the assumption of ‘infinity’ does not apply to smaller crystals of nanometer dimensions (called nanocrystals). Therefore, for nanocrystals, a new set of absurd definitions needed to be introduced. Following assumptions are added:
- energy levels of a nanocrystal are discrete;
- their density is much larger than similar atomic clusters;
- their spacing is smaller than for the corresponding levels of one atom or a small atomic cluster.
These logical absurdities are called quantum dots. These dots mark the connection between bulk and nano-scale properties. Highest occupied atomic levels of the atomic (or ionic) species interact with each other to form the valence band of the nanocrystal. Similarly, lowest unoccupied levels combine to form the conduction band of the nanocrystal. The energy gap between the valence and conduction bands results in the band gap of the nanocrystal. As an example, consider a metallic quantum dot. Its level spacing at the Fermi level is roughly proportional to EF = N, where N is the number of electrons in the quantum dot. In very small crystals of nanometer dimensions, so called nanocrystals, the assumptions of translational symmetry and infinite size of the crystal are no longer valid, and thus these systems cannot be described with the same model used for a bulk solid. We can imagine indeed that the electronic structure of a nanocrystal should be something intermediate between the discrete levels of an atomic system and the band structure of a bulk solid. This can be evidenced from Figure 6.12, the energy levels of a nanocrystal are discrete, their density is much larger, and their spacing is smaller than for the corresponding levels of one atom or a small atomic cluster. Because of their discrete energy levels, such structures are called also quantum dots. The concept of energy bands and band gap can still be used. Highest occupied atomic levels of the atomic (or ionic) species interact with each other to form the valence band of the nanocrystal. Similarly, lowest unoccupied levels combine to form the conduction band of the nanocrystal. The energy gap between the valence and conduction bands results in the band gap of the nanocrystal. As an example, consider a metallic quantum dot. Its level spacing at the Fermi level is roughly proportional to EF = N, where N is the number of electrons in the quantum dot. Given that EF is a few eV and that N is close to 1 per atom, the band gap of a metallic quantum dot becomes observable only at very low temperatures. Conversely, in the case of semiconductor quantum dots, the band gap is larger and its effects can be observed at room temperature. The size-tunable fluorescence emission of CdSe quantum dots in the visible region of the spectrum is for instance a very explanatory illustration of the presence of a size-dependent band gap. At the outset, there is no harm in characterizing material in this fashion other than the fact that it is not logical. However, the real harm is in disconnecting metal components from the rest of the environment. In addition, such characterization of both mass and energy disconnects the mass from the energy component and makes no distinction between natural chemical and artificial ones. Crystals in nature, however, are processed very differently from the artificial processing that we are used to.
Before this atomic model is confidently extended to a bulk system, three-dimensional scaling is performed and to do so the concept of ‘free’ electron is introduced. A “free” electron means that it is delocalized and thus not bound to individual atoms. In scientific term, it means electrons are assigned the ability to exist in multiple positions in space simultaneously. It does not stop there; furthermore assumptions are invoked. For instance, it is assumed that the interactions between the electrons, as well as the interactions between the electrons and the crystal potential, can be neglected. This amounts to neglecting mass of a snow flake while calculating the impact of an avalanche or nature (natural or artificial) of a photon while determining the role of light in an organic system. Yet, this model system, called “free-electron gas” has become foundation of the study of material properties (Ashcroft and Mermin, 1976).
Unsurprisingly, scientists then marvel at how well this model captures many physical aspects of a real system, which is expected because all measuring tools are also based on the same principle (Islam, 2019). It means, scientists are busy falsely measuring properties of real materials to justify theories that are based on false premises. Even then, whenever divergence occurs between measured and theoretic observations, it is explained away based on another set of false assumptions. When it becomes unbearable to maintain such theories, new parameters and yet another set of dogmatic assertions are invoked. In this particular application, it is deemed sufficient to replace the free-electron mass m by an “effective” mass m*, which implicitly contains the corrections for the interactions, although the ‘correction’ remains entirely arbitrary and the original ‘free-electron’ picture becomes the new norm. With this premise, velocity of electron, its mass and energy are connected through the following equation
(6.5)
where, velocity, v is considered to be strictly orthogonal with components vx, vy, vz in three dimensions.
According to Pauli’s exclusion principle, each electron must be in a unique quantum state. This stunning principle assigns unique properties to otherwise homogenous, spherical, rigid, particles – called electron, without explaining why such uniform bodies will have unique properties. It is also asserted that electrons can have two spin orientations (ms = 1/2 and ms = - 1/2). It then follows that two electrons with opposite spins can have the same velocity, v. This case is analogous to the old Bohr model of atoms, in which each orbital can be occupied by two electrons at maximum. In essence, the new description is nothing different from the long-discredited Atomic model. In connecting the transition between energy and mass, solid-state physics introduces another layer of obscurity. The velocity term, v is replaced by wave vector, k (expressed as kx, ky, and kz) in order to describe a particle’s state. Its absolute value is called the wave number (akin to speed).
The wavevector is stated to be directly proportional to the linear momentum, p and thus also to the velocity, v of the electron:
(6.6)
In the above equation, which asserts a linear relationship between p and k obscure any role of real radiation by invoking the scaling constant, h, the Planck constant. In essence, Planck’s constant relates the energy in one ‘quantum’ of electromagnetic radiation to the frequency of that radiation. In the International System of units (SI), the constant is equal to approximately 6.626176 × 10⁻³⁴ joule-seconds. All of a sudden, the entire transition from mass to energy is fabricated as this ‘quantum’ subsequently called photon or any other unit of energy, typically characterized as devoid of mass, yet having a definite pattern in electromagnetic wave. This absurd notion forms the basis of today’s Quantum Physics.
The science is further obscured by the introduction of the De Broglie relation (Ashcroft and Mermin, 1976) that relates wave length to Planck’s constant through the following relationship.
(6.7)
In this equation, wave number is related to wave length, λ. This assumption (known as matter-wave duality) implies that matter behaves like waves, the latter being a feature of energy that has no mass attached to it. In essence, it disconnects mass from energy, implying that energy can emerge from nothing. After all this molestation of mass energy transition comes the manipulation of the boundary condition. It is assumed that periodic boundary conditions exist for every particle. This is the opaque version of the real boundary condition that is being imposed, the real meaning the infinite boundary condition that was the one that gave analytical solutions in the past. The scientific meaning of imposition of such an absurd boundary condition is to assert that an electron does not ‘feel’ the border, therefore it ‘behaves’ as though it is in a bulk. Now that this depiction of bulk material has nothing to do with reality, scientists solve the resulting equations with a great deal of zeal and draw a 3-D picture of electrons and resulting energy (Figure 6.13). The debate now becomes that of cosmetics of this visualization and how to make the predictions close to real observations – observations that are made with the tools that have the same depiction imbedded in it.

Figure 6.13 Electrons in a three-dimensional bulk solid (From Ashcroft and Mermin, 1976).
In this figure, (a) shows how a solid entity can be modeled as an infinite crystal along all three dimensions x; y; z. The picture (b) shows how periodic boundary conditions yield standing waves solutions for free electrons. Each of the dots shown in the figure represents a possible electronic state kx; ky; kz. Each state in k-space can be only occupied by two electrons. In Figure (c) the dispersion relation for free electrons in a three-dimensional solid is shown. The energy of free electrons varies with the square of the wavenumber, and its dependence on k is described by a parabola. For a bulk solid the allowed states are quasi-continuously distributed and the distance between two adjacent states (here shown as points) in k-space is very small. In figure (d), Density of states of D3d for free electrons in a three-dimensional system are shown. The allowed energies are quasi-continuous and their density varies with the square root of the energy E1/2.
Figure 6.14 shows how the theoretical curve based on the above formulation ends up predicting experimental values within the margin of error. As stated earlier, the entire exercise of developing equations that have nothing to do with the actual material properties and everything to do with formulating an equation that will yield desired results have indeed borne fruit.
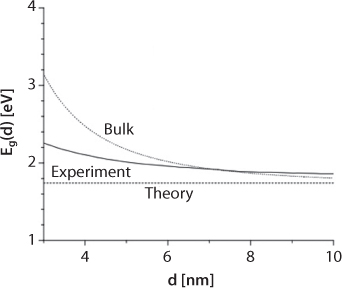
Figure 6.14 Size dependence of the energy gap for colloidal CdSe quantum dots with diameter d. (From Trindade et al., 2001).
6.4.2 The Correct Formulation
The term nanoparticle describes a subset of the colloidal range between 1 and 100 nm (Hochella 2002). The distinction is justified partly on their very high specific surface area (Lead & Wilkinson 2006) and partly on their potentially different behavior at this small scale, due to the spatial constraint of electronic properties (in an analogous manner to engineered nanoparticles: Madden et al. 2006). As particles transition to smaller and smaller sizes, they become effectively all surface with minimal internal volume, giving rise to their enhanced reactivity. Figure 6.15 includes results from Islam and Mokhatab (2018) that corrects the conventional graph to account for the continuity in subatomic level. This figure shows the difficulties in both describing phenomena and handling of such materials.

Figure 6.15 Generalized trend for size-dependent reactivity change of a material as the particle transitions from macroscopic (bulk-like) to subatomic. Reactivity can increase or decrease depending on the material and the chemical reaction involved (modified from Islam and Mokhatab, 2018).
Engineered materials behave similarly but with unpredictable results of reactivity. For instance, natural materials will form biomaterials and become an integral part of the life cycle, whereas engineered materials will form toxins to the living objects. This forms the core of the question that should be asked in any future research.
The unique feature of this technology is that the behaviour of the matter is very different from what is well-known, commonly accepted and generally understood. Laws related to physics are different than on macro-scale. Even though it is commonly perceived that the laws of quantum mechanics are applicable, recent research findings show that nanomaterials are beyond the scope of quantum mechanics, from both a scientific (Islam, 2014; Islam and Mokhatab, 2018) and philosophical perspective (Martin, 1981). At the nanoscale conventional forces like, gravity, or inertia do not play much role; instead, other forces, not apparent in macroscale, such as, van der Waal’s forces, electrostatic, magnetism, etc., are more important. The problem is none of these forces are amenable to measurements and even their mere existence remains tentative. It is, however, understood that alteration of nano-properties can make metals harder, ceramics softer, alloys malleable as per design could be engineered to become harder or softer and mixtures with specifically designed properties could be achieved (Wang et al., 2015).
New devices based on nanotechnology will be different from the conventional one as the governing laws and other properties are different. The main problem with nano devices is whether this kind of machines will operate at any hostile environment or not, as the shearing-off or melting of a single layer of atoms may alter the characteristics of the nanomachine. While this has been known for over a decade (Krim, 2005), little is done as to how to describe the real problem, or which theory would explain it. For static devices, the results are much promising than the devices with moving parts. For example, nano-electronics will open a new horizon for smaller but faster computing that will go beyond the theoretical limits of current technology. New forms of memory and storage device with increased capacity and reliability will be achieved using single electron/molecular design. However, for moving nano machines as friction plays a vital role it may pose a big hurdle to overcome. However, manifestation of ‘superlubricity’ or very low friction (Socoliuc et al, 2004, Dienwiebel et al, 2004) in some nanostructure shades some light too. Liu et al. (2012) identified the process, in which shearing a microscale lithographically defined graphite mesa led to the sheared section retract spontaneously to minimize interface energy. They showed that the frictional forces involved are due to superlubricity, where ultralow friction occurs between incommensurate surfaces. The effect is remarkable because it occurs reproducibly under ambient conditions and over a contact area of up to 10 × 10 μm2, more than seven orders of magnitude larger than previous scanning-probe-based studies of superlubricity in graphite. It shows frictions and lubrication at atomic and meso-scale are ill-understood with today’s science.
A new generation of sensors and imaging technology as a result of nanotechnology will help to deploy those at different places that are now inaccessible and/or infeasible with the current technology due to size and performance. Nanoscience is based on the fact that properties of materials change as a function of the physical dimension of that material, and nanotechnology takes advantage of this by applying selected property modifications of this nature to some beneficial endeavour. Small et al. (2005) showed how nanotechnology is and will affect geosciences. In a similar fashion we can predict the impact on petroleum industry.
The magnetic, electrical, mechanical and chemical properties may be surprisingly different than the host material, apart from the physics of the material. Our macroscopic common-sense may not apply to the nano-scale phenomenon. For example, water can pass through the hydrophobic carbon nano tubes (Sansom et al, 2001, Hummer et al, 2001). Many fluids behave abnormally when confined in a space of nanometre dimensions. For example, simple organic liquids become solid-like when squeezed between two smooth surfaces into a film that is less than about five molecular layers thick. In contrast, if water is squeezed between two mica surfaces, only small changes in viscosity occur. The nature of the confining surfaces also has an effect. Depending on the nanotube dimension, nano-ice may be formed as well. Not to mention, nanophase behaviour depends on the preparation process apart from the particle size (Roy et al, 2006).
Yin et al (2006) showed that adding nano-materials changes the rheology of the fluid. The dimension affects the behaviour significantly. For example, the electrorheology (ER, change in viscosity due to applied electric field) effect of the raw material of TiO2 nanoparticles is very weak, while the ER fluid containing titanate nano-whiskers shows high yield stress. So, it is possible to change some of the material properties using nano particles or creating a new kind of catalyst, suspension etc. It is also true that nanomaterials are ubiquitous and any colloidal liquid would show viscosity variation in nanoscale. This is demonstrated in Figure 6.16 that shows how viscosity in nano scale increases drastically as the sample size is reduced. This variation is beyond the effect of high pressure that is insensitive to the size of particles (Forst et al., 2000). With that, small addition of nanoparticles would alter the rheology of the liquid drastically. Such process unlocks great potentials for heavy oil upgrading or even downhole refining of petroleum products. Figure 6.17 shows how viscosity of heavy oil is affected with different types of nanomaterials. The same facts can be used to understand how rock/fluid interaction would take place (Chiu et al., 2013).
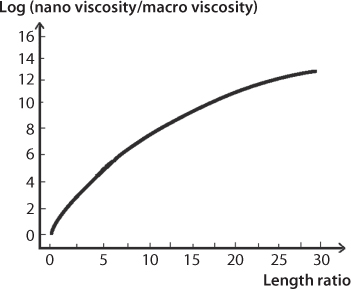
Figure 6.16 Variation in nano viscosity as a function of length ratio (probe size/particle size) (From Chiu et al., 2013).

Figure 6.17 Effect of particles type on sample viscosity at a fixed temperature (25 C) and particles size: top line, micron – sized iron;, bottom-line, micron – sized copper; midline- micron – sized iron oxide (III) (figure from Shokrlu, 2013).
Recent developments in subatomic physics highlight the presence of optimum in terms of characteristic speed. Figure 6.18 shows characteristic speed as a function of particle size. This is in harmony with universal order, in which the graph is continuous in both sides of the size spectrum. Both sides approach the speed of light (Brown et al., 2015).

Figure 6.18 Orbital speed vs size (not to scale) (from Islam 2014).
In Figure 6.18, a dust speck represents reversal of speed vs. size trend. For so-called subatomic particles, speed increases as the size decreases. Higgs boson is assigned a smaller value than quark but larger value than photon. This is done deliberately in order to float the notion that fundamental particle and finality in determining such particle is a spurious concept and the actual size of it is arbitrary. Note that these characteristic speeds are all a function of time. This also follows that reactivity is greater as size is decreased. Any chemical reaction is similar to any other irreversible mass/energy transfer, in which there is a quantum change. Such change is a characteristic feature of phase transfer, chemical reaction, or when a life begins (from non-organic to organic) or ceases for an individual (from organic to non-organic). In this process, life and death are triggers or bifurcation points as associated time functions change drastically. It should be noted that such transition is subjective and death of one entity only means death for that particular object.
The time function, f(t) defines the pathway of any entity within the universal order. In Figure 6.18, dust specks represent the most objects closest to stable and steady state. The pathway followed by dust specks is the one that is organic and beneficial to the ecosystem. In nano scale reactivity increases and therefore the divergence between natural and artificial particles gains momentum. This divergence is similar to organic and non-organic or living or dead object. Figure 6.19 shows how the direction of a natural particle and its ‘orbit’ is opposite to that of artificial particle. Unless long-term analysis is done, it is not possible to observe the difference between these two types. Such observation is necessary in order to determine the true impact of a new material. To-date, research topics are more concerned about the short-term impacts that are little more than safety analysis. In this research, Khan and Islam’s (2007) criterion will be used to determine applicability of various nanomaterials and nanofluids and the long-term impacts thereof.

Figure 6.19 Natural artificial both act the same way, except for the time function.
History supports the notion that harmfulness of artificial was well-known or previous civilizations did not attempt to produce artificial products. Figure 6.20 shows how important it is to distinguish between artificial process and natural process. As pointed out by Islam et al. (2010), every artitifical chemical has created irreversible damage to the environment whereas every natural chemical led to global sustainability (Khan and Islam, 2016).
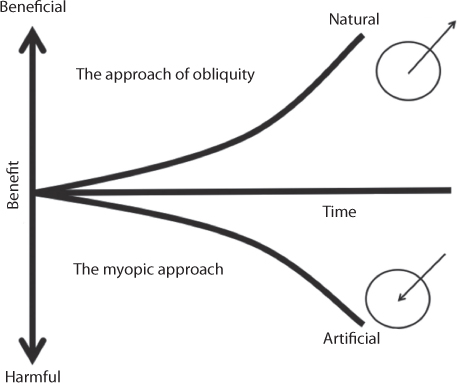
Figure 6.20 Historically, natural objects were synonymous with sustainability (from Khan and Islam, 2012).
The superflux of artificial started with Democritus’ model that was first accepted by Aristotle and later glamourized by scholars affiliated with the Roman Catholic church. While New Science claims that it has broken out of dogmatic cognition, in reality, every theory in New Science emerges from aphenomenal premises, much like Atomism or dogma (Islam et al., 2012).
A correct material property model should include all rheological properties as function of particle size that include memory effects (Hossain et al., 2007) in order to capture the time function in its entirety. Experimental results with artificial nanomaterials suggest that a wide range of variation is expected. The key is to make best use of the variability. Figure 6.21 shows how friction coefficient can vary with viscosity. It becomes more complex when viscosity is a function of time. Viscosity itself highlights the level of interactions with the environment. For instance, for the same viscosity, natural material will improve the environmental health while artificial material will degrade it.
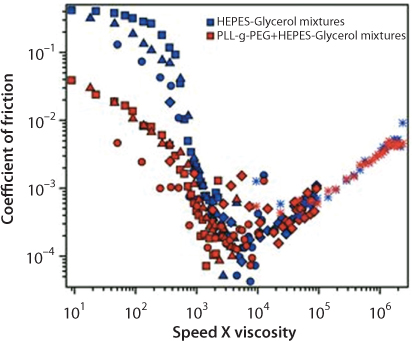
Figure 6.21 Lubricity of various artificial fluids as a function of viscosity (From Islam and Mokhatab, 2018).
The pores in mud-rocks are in nanoscale. For petroleum reservoirs, the pore size distribution contains most, if not all, nanoscale pores. Therefore, the flow of the reservoir fluids is surely somehow affected by the nano-structure, as the fluid flow behaviour through nanopores are surprisingly different than that of through macro scale. For example, Majumder et al (2005) showed that fluid flow through carbon nanotubes (CNTs) is four to five orders of magnitude faster than predicted by conventional fluid flow theory. Therefore, to fully understand the reservoir mechanism we need to know the behaviour of reservoir rock-fluid properties in nano-scale too. This knowledge will help to recover more from the reservoirs. Even, at least modification to the existing theories, if not new theories, is required to incorporate knowledge acquired from nanoscience. Hochelle (2002) pointed out the remarkable impact of particle size on particle behaviour and tried to explain it in terms of property-size dependence on electronic structure of matter.
The interest of using nanoparticles in membrane structures mainly focuses on their assumed beneficial effect on fluxes and fouling resistance. Kim and Van der Bruggen (2010) reviewed potential applications of nanoparticles-enhanced membranes in general. They conclude that the use of nanoparticles in the development of low-fouling membranes allows for a high degree of control over membrane characteristics as well as the ability to produce ceramic membranes in the nanofiltration membrane range. A wide range of nanoparticle types are used, such as TiO2 (Sotto et al., 2011; Soroko and Livingston, 2009; Li et al., 2009; Yang et al., 2007). Nanomaterials such as ZnO (Balta et al., 2012), Al2O3 (Yan et al., 2009; Yu et al., 2012), Au (Vanherck et al., 2011), zero-valent iron (ZVI) (Xu and Bhattacharyya, 2005), Pd (Tanaka et al., 2006) have been looked at. It would be interesting to use some of these materials in their natural state – the state that offers unconditional sustainability and environmental integrity. These membranes can be used for water treatment, oil-water separation and gas-gas separation. The gas-gas separation can be enhanced by impregnating with nanoliquids. According to Pendergast and Hoek (2011), the most promising functionalities in water treatment applications include zeolitic and catalytic nanoparticle-coated ceramic membranes, hybrid inorganic-organic nanocomposite membranes, and bioinspired membranes such as hybrid protein-polymer biomimetic membranes, aligned nanotube membranes, and isoporous block copolymer membranes.
Surface diffusion is a ubiquitous phenomenon playing a highly important role both in natural and technological processes (Naumovets, 2005). Current refining processes use lots of toxic materials that create environmental havoc. Nanostructure may provide better insight of filtering. That, in turn, will provide us a way to use filters (natural or nano-engineered) in refining without or minimal use of toxic material. This knowledge will benefit other industrial process as well.
New kind of catalysts will open new horizon too. For example, although gold does not behave as a catalyst in bulk form, nanoparticles of gold or other transition metals may be used as a substitute for platinum, where platinum is one of the most used catalyst in hydrocarbon reaction (Guczi, 2005). More recently, Shiju and Guliants (2009) reviewed progresses made in catalysts that use nanostructures. Noble metal nanoparticles such as Pt, Pd, Rh, Au and their alloys with other metals have been extensively employed to catalyze a wide range of dehydrogenation, hydrogenation, and selective oxidation reactions of organic molecules. Novel approaches are still required to synthesize and characterize stable gold and other metal nanoparticles with tightly controlled sizes to further advance the knowledge of their unique size-dependent catalytic behavior. The bulk mixed metal oxides of vanadium, molybdenum, and other transition metals, such as the M1 phase for propane ammoxidation to acrylonitrile, have shown great promise as highly active and selective oxidation catalysts. However, fundamental understanding of surface molecular structure–reactivity relationships of these systems remains highly limited.
6.5 Zeolite as a Refining Catalyst
Even before the detailed composition of naturally occurring zeolite is known, the natural state of such a powerful agent should confirm that its usage is not harmful to the environment. Similar properties have been identified in limestone as well as in vegetable oils, which can be used as a solvent for removing sulfur compounds. The use of zeolite or similar naturally occurring separation materials would be benign to the environment and would also eliminate the additional cost of cobalt, nickel, and molybdenum processing, bringing in double dividend to the petroleum processing industry.
Zeolites can be defined as crystalline, porous aluminosilicates in which the primary building blocks are TO4 tetrahedra having a Si4+ or Al3+ cation (T atoms) at the center and four oxygen atoms at the corners (Primo and Garcia, 2014). Each corner is shared by two TO4 units forming a tridimensional framework defining cavities, channels and empty spaces generally denoted as “micropores”. This porosity defined by the rigid crystal lattice is open to the exterior of the solid crystallite allowing the mass transfer from the exterior to the interior of the zeolite particle and the intracrystalline diffusion of molecules smaller than the micropore dimensions. Zeolite has long been known for its very high internal surface area that contributes to water absorption. The microstructure of zeolite is such that it acts like a molecular sieve, providing the site for perfect ion exchange (Breck, 1973). Zeolites have a porous structure that can accommodate a wide variety of cations, such as Na+, K+, Ca2+, Mg2+ and others. These positive ions are rather loosely held and can readily be exchanged for others in a contact solution. The advantage of this structure is these chemicals can be released easily thereby activating their role as a catalyst. As these cations are natural, they do not pose any negative impact on the refining process. Some of the more common mineral zeolites are analcime (NaAlSi2O6·H2O), chabazite ((Ca,K2,Na2)2[Al2Si4O2·12H2O), clinoptilolite ((Na,K,Ca)2-3Al3(Al,Si)2Si13O36·12H2O), heulandite ((Ca,Na)2-3Al3(Al,Si)2Si13O36·12H2), natrolite (Na2Al2Si3O10·2H2O), phillipsite ((Ca,Na2,K2)3Al6Si10O32·12H2O), and stil-bite (NaCa4(Si27Al9)O72·28(H2O)). An example of the mineral formula of a zeolite is: Na2Al2Si3O10·2H2O, the formula for natrolite. These cation-exchanged zeolites possess different acidity – a quality that dictates its effectiveness and applicability as a catalyst. The key parameter that controls many properties of the zeolites having a large influence on their catalytic activity is their aluminum content – as measured by the number of aluminum atom for each silica atom.
Zeolites can be classified depending on the pore size as small, medium and large pore size zeolites when the openings of the micropores are constituted by rings of eight, ten or twelve oxygen atoms. Figure 6.22 summarizes the chemical composition of a zeolite and the properties that derive from it. Due to the different charge of Al3+ and Si4+, the TO4 tetrahedra can have a net negative charge (AlO4) or can be neutral (SiO4). The consequence of the presence of Al3+ in framework positions is the appearance of an equivalent number of negative charges in the framework that require the presence of charge-balancing cations to ensure the electroneutrality of the solid. These charge-balancing cations occupy the micropore space and because they are not grafted into the framework and are bonded to the lattice by Coulombic forces, they can be totally or partially exchanged by different cations. In fact, one of the main applications of zeolites is in detergent formulations as water softener to remove Ca2+ ions from hard waters by ion exchange with Na+. These compensating cations can exist naturally or can be introduced during the synthesis of zeolites and can be either inorganic or organic.

Figure 6.22 Chemical composition of zeolites and possibilities for its control. Key parameters are the nature of charge-balancing cations and the Si/Al ratio.
One particular case that is of considerable importance for the use of zeolites as catalysts in refining is the case in which the charge compensating cation is formally a proton. In this case, zeolites are called “solid acids” and due to the microporosity these internal protons can act as Brönsted centers in heterogeneous catalysis. Although Si4+ and Al3+ ions have very similar ionic radius and fit nicely in the center of TO4 tetrahedra, the presence of Al3+ introduces a relative lattice instability due to the somewhat larger ionic radius of Al3+ with respect to Si4+, the charge unbalance and low coordination number around Al3+. Thus, there is a tendency of Al3+ to migrate outside the lattice forming octahedrally coordinated Al species that are generally denoted as extra framework aluminium (EFAL). High Al3+ content makes the zeolites very prone to develop EFAL, generating Lewis acid sites. The Brönsted acidity of a zeolite is also influenced by the presence of Lewis acidity. This synergy between EFAL and Brönsted acid sites resulting in an increase of the acid strength is similar to that found in liquid acids in which the combination of Brönsted and Lewis acids can render superacids with remarkably enhanced strength.
Besides the composition, the acidity of the zeolites also depends on their structure. It has been found that for similar chemical composition, the strength of acid sites in medium pore size zeolites is higher than that found in large pore size zeolites (Corma et al., 1994; Huang et al., 2009).
Acidity is an extremely important property in catalysis by zeolites for refining since many of the processes are proteolytic C–C bond cleavages or involve the generation of carbocations. The most widely accepted mechanism for hydrocarbon cracking involves protonation of single C–C or C–H bonds of alkanes and the generation of carbocations that subsequently undergo b-scission forming a smaller carbocation and an alkene. One point that has been controversial and of wide interest is to determine whether or not the acid sites of zeolites can be considered as superacidic and what is the maximum acid strength that can be achieved in zeolites. However, the most important point in this regard is the fact that if the zeolite is naturally occurring, it will make the subsequent reactions sustainable and if it is synthetic, the opposite would take place.
As stated earlier, zeolite microstructure acts as a sieve. One of the main problems in porous solids in which the reaction takes place predominantly inside the pores is intracrystalline diffusion. The pores defined by the framework are open to the external surface allowing the mass transfer from the exterior toward the interior of the particle, provided that the size of the molecule is smaller than the dimensions of the pores. Zeolites are microporous materials (pore size of 2 nm). Zeolites can be classified according to the pore size. In “small pore” zeolites, having apertures defined by eight oxygen atoms, only small gas molecules can access the interior. In the case of “medium pore” zeolites (10-membered ring apertures), benzene, toluene and para-substituted aromatics can enter through the pores. The range of molecules that can diffuse in “large pore” zeolites having 12 membered rings is much larger, since the dimensions of these pores are typically around 0.7 nm. Besides pore dimension, the geometry of the pore system is crucial to determine the intracrystalline diffusion coefficient of molecules. Diffusion in monodirectional zeolites, which is typically a synthetic product, having parallel channels, such as mordenite, is generally more difficult than in bi- and tri-directional zeolites. In the case of monodirectional pores, molecules diffusing in the channel have to move one after the other following the same direction and can be easily blocked by a single molecule. In contrast, diffusion in open tridirectional zeolites, such as faujasites X and Y, is easier, since the cavities can be accessed through four independent windows. Furthermore, monodirectional zeolites are prone to becoming deactivated by a small percentage of poisons blocking the entrance of the channels, while bi- and tri-directional zeolites can tolerate a larger percentage of poisons before undergoing deactivation.
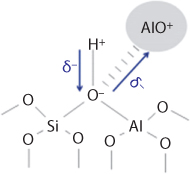
Figure 6.23 Synergy between Lewis acid sites (AlO+) and Brönsted OH site leading to an increase in acid strength.
In this process natural zeolites have a distinct superiority over synthetic ones. In external features, both natural and synthetic zeolitic crystalline aluminosilicates are useful as catalysts and adsorbents. These aluminosilicates have distinct crystal structures which are demonstrated by X-ray diffraction. The crystal structure defines cavities and pores which are characteristic of the different species. The adsorptive and catalytic properties of each crystalline aluminosilicate are determined in part by the dimensions of its pores and cavities. Thus, the utility of a particular zeolite in a particular application depends at least partly on its crystal structure. Because of their unique molecular sieving characteristics, as well as their catalytic properties, crystalline aluminosilicates are especially useful in such applications as gas drying and separation and hydrocarbon conversion. Although many different crystalline aluminosilicates and silicates have been disclosed, there is a continuing need for “new” zeolites and silicates with desirable properties for gas separation and drying, hydrocarbon and chemical conversions, and other applications. The tendency in the industry has been to produce synthetic form, custom designed for particular applications. Crystalline aluminosilicates are usually prepared from aqueous reaction mixtures containing alkali or alkaline earth metal oxides, silica, and alumina. On the other hand, “nitrogenous zeolites” have been prepared from reaction mixtures containing an organic templating agent, usually a nitrogen-containing organic cation. By varying the synthesis conditions and the composition of the reaction mixture, different zeolites can be formed using the same templating agent. Use of N,N,N-trimethyl cyclopentylammonium iodide in the preparation of Zeolite SSZ-15 molecular sieve is invented through a series of patents. These patents rely on very toxic processes that retain the external features of Zeolites while replacing naturally occurring chemicals with artificially produced ones. Often other chemicals are blended in so that the resulting zeolite can have specialized qualities. For instance, the use of aluminum oxide, gallium oxide, iron oxide, boron oxide, silicon, germanium and mixtures thereof has gained widespread applications in the manufacturing industry.
Concerning reactivity, the pore size can be responsible for the control of the product distribution. The term “shape selectivity” has been coined to denote those cases using zeolites or other microporous solids as catalysts in which the reason why a product is predominantly formed is exclusively the molecular shape and dimensions. For naturally occurring zeolite, this is not an option and one cannot custom design to fit a particular application. As can be seen from Figure 6.24, when carrying out the reaction inside the medium pore zeolite ZSM-5 in which the pore dimension only allows diffusion of p-xylene, m- or p-xylene formed in the crossings of the channel system cannot diffuse out of the crystals and become entrapped until they rearrange to the p-xylene that is the only one that can go out of the pores.

Figure 6.24 Schematic of the shape selectivity for the formation of p-xylene in toluene disproportionation.
6.5.1 Gasoline Pool
The automotive industry has been using the light naphtha fraction of the crude oil marketing it as gasoline (“light straight run” gasoline). The quality of the gasoline is quantitatively measured by the octane number, the higher the octane number, the higher the ability of the gasoline to stand high pressure and temperature. In this scale the performance of n-heptane and 2,4,4- trimethylpentane has been arbitrarily assigned 0 and 100. In general, the octane number of a pure hydrocarbon increases with the degree of branching, presence of cycles or for aromatic compounds. As the demand for gasoline increased as well as the need for octane numbers higher than those characteristic of light straight run gasoline (about 70), it was necessary to blend various streams of the refinery in a pool to meet the requirements of gasoline production and quality. Figure 6.25 presents the composition of a representative gasoline pool indicating the origin of the individual components.
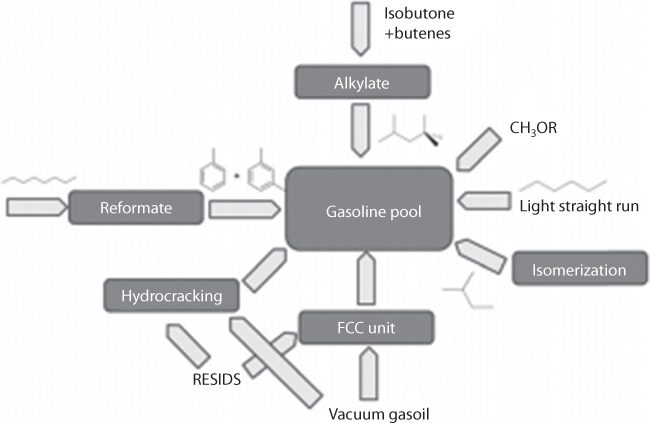
Figure 6.25 Streams contributing to gasoline pools.
6.5.2 Linear Paraffin Isomerization
One of the components of the gasoline pool is the naphtha fraction. Light straight run naphtha is constituted, mainly, by linear alkanes accompanied by a small percentage of aromatics, and has typically an octane number about 74 or below, insufficient to be added directly to the gasoline pool. This light straight run naphtha should be, therefore, submitted to isomerization, a process that is based on the use of acid zeolites as catalysts. The octane number of linear alkanes decreases as the number of carbons increases, and therefore, these long-chain linear compounds present in this fraction (mainly C7 and C8) should be preferentially isomerized in the process. At a given temperature the equilibrium distribution among isomers limits the extent in which linear paraffins are converted into branched isomers. The general tendency is that isomerization is disfavored as the temperature increases in the range from 0 to 600 C. Therefore, from the thermodynamic point of view, it is convenient to work at the lowest possible temperature. Thus, the role of the catalyst is to increase the reaction rate allowing the reaction to reach equilibrium at the lowest possible temperature. Isomerization of linear alkanes requires acidity combined with dehydrogenation/hydrogenation capability. In this particular application, both the natural state of zeolite as well as the form of energy related to the heating will dictate if the products will be environmentally benign or not.
6.5.3 Isobutane–Butene Alkylation
About 12% of the blend in the gasoline pool may come from butene alkylation. The acid catalyzed mechanism for isobutene–butene alkylation is shown in Figure 6.26.
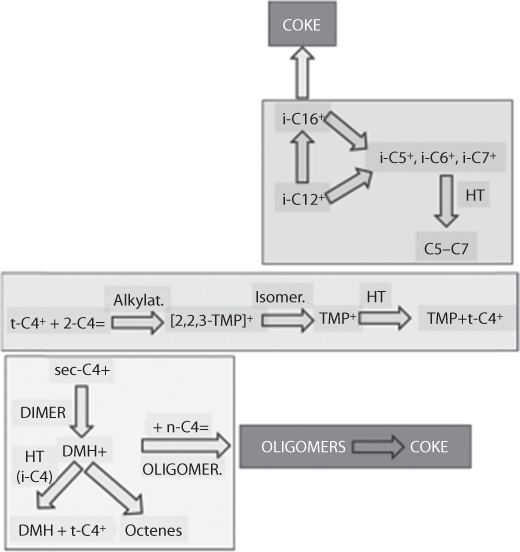
Figure 6.26 Simplified mechanism for isobutene–butene alkylation and competing unwanted processes. t-C4+: tert-butyl cation; 2-C4Q: isobutene; TMP: trimethylpentanes; sec-C4+: sec-butyl cation; DMH: dimethylhexanes; HT: hydride transfer.
This stream has a high octane number, ideally 100, and is much valued since it does not contribute to the gasoline sulfur content, because isobutane and butene are free from this contaminant. Classical alkylation processes are based on the use of homogeneous liquid acids and particularly HF and H2SO4. From the catalytic point of view, the two main relevant properties of the liquid acids are their decay and isobutane solubility in the acid phase. Isobutane solubility is much higher in HF than in H2SO4. This allows reaching a higher concentration of isoalkane favoring hydrogen transfer steps to carbenium ions, reducing the carbocation lifetime and minimizing secondary reactions. These advantages exhibited by HF allow shorter contact times and operation at higher temperatures where the reaction rate is higher. In contrast, although the acid strength of H2SO4 is much higher, this acid presents also high viscosity and density unfavorable for the mixing with hydrocarbons, complicating significantly reactor design to ensure sufficient contact between the two phases. An additional problem with the use of H2SO4 is that the amount of acid lost in the products is much higher, requiring larger catalyst make up. Make up and regeneration are about 30% of the total operation cost in the case of H2SO4, while they represent only 5% for HF. The main problem of HF is, however, its large negative environmental impact that requires strict safety measures due to the high risk of accidental leakages and the fact that HF aerosol can stand as highly corrosive, persistent clouds over long periods of time. For this reason, there is no clear advantage in the use of HF as opposed to H2SO4 as an alkylation catalyst. One alternative to the use of liquid acids is the use of solid acids. Amorphous silica–alumina has been used as solid catalyst, but zeolites have the advantage of a higher activity, higher durability and lower deactivation. The activity of zeolites depends on the Si/Al ratio and on the crystal structure.
6.5.4 Fluid Catalytic Cracking (FCC)
FCC provides a surplus of high octane number gasoline by converting vacuum distillates, particularly vacuum gasoil, into gasoline. From the chemical point of view, several molecular transformations are concurrently taking place during FCC, including shortening of linear long alkanes, isomerization of linear into branched alkanes and dehydrogenation of cyclic olefins into aromatic naphthenes. Figure 6.27 shows the schematic of the process involved.
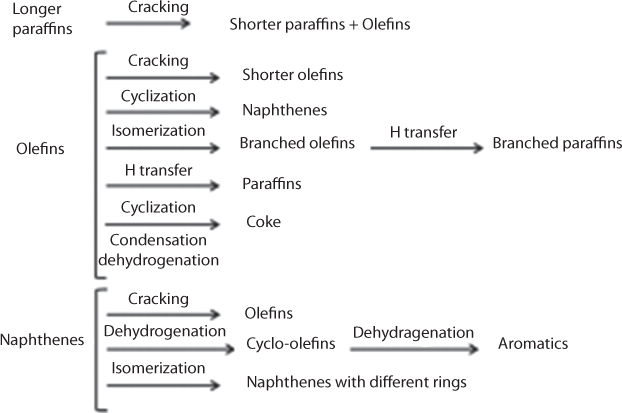
Figure 6.27 Elementary processes taking place in FCC.
Figure 6.28 shows the major reactions that take place during FCC (from Islam et al., 2010).
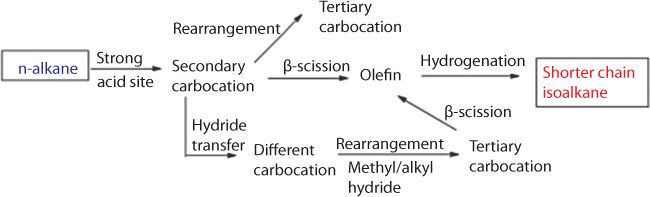
Figure 6.28 Elementary steps assumed to take place in catalytic cracking on zeolites.
The FCC catalyst contains an active component (10 to 50 wt%) dispersed on a solid matrix (between 50% and 90% of the total) providing physical and mechanical resistance and embedding the active component, and some additives that increase the tolerance of the catalyst against deactivation by poisoning (Figure 6.29).
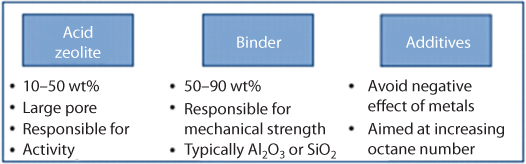
Figure 6.29 Components present in general formulations of a FCC catalyst.
The active phase is generally a large pore zeolite, often accompanied with rare earth metals. In general, an increase in the percentage of rare earth metals leads in an increase in feed conversion accompanied by an undesirable decrease in the octane number of the resulting gasoline. Also, framework dealumination results in an increase in the activity of the zeolite, particularly considering that zeolite Y has high Al content. Steam treatment is a convenient procedure to reduce framework Al, and that also increases mesoporosity of the crystallites due to the partial damage of the zeolite particles leading to the creation of mesopores above 6 nm, highly beneficial for the activity and stability of the zeolite by favoring intracrystalline diffusion of substrates and products reducing poisoning derived from long contact times of substrates and products with the acid sites.
In addition, the composition (Si/Al ratio) is an important parameter that controls the activity and selectivity, which in general increase as the average crystal size decreases. Figure 6.30 summarizes the parameters that control the activity of zeolites as cracking catalysts.
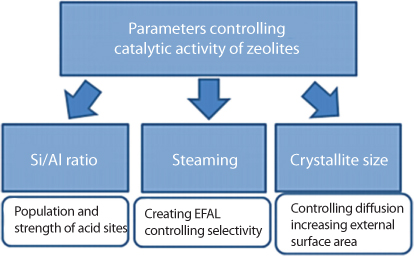
Figure 6.30 Main parameters that influence the catalytic activity of zeolites in FCC formulations.
One problem of FCC catalysts is the tolerance to the presence of metals and particularly Ni and V. These and other metals can be present in high molecular weight organic compounds present in the FCC feed. Deposition of Ni on the catalyst favors the generation of coke on the catalyst due to its dehydrogenating capability. To minimize the influence of Ni, FCC catalysts contain additives, such as Sb that acts as a poison of Ni by forming Ni–Sb alloys, inactive to promote dehydrogenation. These catalysts can render the entire fluid stream toxic, thereby making the resulting oxides unacceptable by the ecosystem. Also, the effect of Ni can be neutralized by alumina present abundantly in the catalyst matrix by forming Ni aluminates that have much lower dehydrogenation activity. V also has some activity for hydrogen evolution and coke formation during the FCC process. However, the main problem caused by V is the formation of strong acids during regeneration of FCC catalyst that produce deterioration of the zeolite crystal structure reducing its service life. To minimize this effect of V, the use of more robust zeolites, generally those having low Na and Al content, as well as the presence of vanadium trapping compounds in the additives, generally basic solids such as CaO, Al2O3 or MgO, is recommended. However, this should not lead to the use of synthetic zeolite.
The fraction of additives of FCC catalysts may also contain some components to effect NOx decomposition. Nitrogen is present in the FCC feed and about 50% of the N in the FCC feed becomes deposited on the catalyst as coke. During FCC catalyst regeneration by combustion of coke, part of the nitrogen evolves as N2, but the other part forms NOx that have to be decomposed to avoid their emission to the atmosphere.
Another problem of the FCC stream is that this fraction contributes to a large extent to the total sulfur content present in gasoline and diesel. About 90% of the total sulfur content of the gasoline is due to the FCC contribution, coming mainly from the heaviest fractions. Typical sulfur-containing compounds in FCC gasoline are mercaptans, dialkylsulfides, thiophenes, alkylthiophenes and benzothiophene, while heavier aromatic sulfur components particularly dibenzothiophene and its alkyl derivatives are present in diesel. Legal regulations are constantly reducing the sulfur content of fuels and achievement of such low S contents currently requires the combination of several technologies. The overall strategy to control the sulfur content in fuels includes the selection of crude oil and adequate fractionation of FCC gasoline to reduce the sulfur in the feed, but also post-treatment of FCC gasoline and diesel.
Among FCC desulfuration post-treatments, one of the emerging technologies is the selective liquid-phase oxidation of thiophene and aromatic S compounds under mild conditions, using tert-butyl hydroperoxide or H2O2 as the oxidizing reagent. In this way, the sulfur atom becomes oxidized to sulfoxide or sulfone, increasing considerably water solubility and boiling point of the sulfur compounds, allowing their easier separation from the fuel, as shown in Figure 6.31. This catalytic oxidative desulfuration could lead to fuels with sulfur content below 10 ppm that will be the legal specification in the very near future. One promising catalyst for oxidative desulfuration is Beta zeolite containing Ti atoms, which can exist in natural state in certain zeolites.
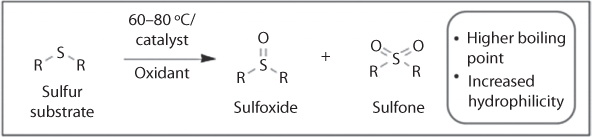
Figure 6.31 Desulfuration based on catalytic oxidation of sulfur compounds present in heavy gasoil fractions.
6.5.5 Reforming
One of the most important processes in refining is the reforming of the heavy naphtha fraction into mixtures in which aromatic compounds and particularly benzene, toluene and xylenes are the predominant compounds. Chemically, the reforming corresponds to the chemical transformation of saturated acyclic and cyclic hydrocarbons into aromatic compounds by dehydrogenation without reducing substantially the number of carbons of the products with respect to the substrates. Figure 6.32 presents the elementary transformations that take place in reforming.

Figure 6.32 Elementary reactions occurring simultaneously in the reforming of naphtha.
These transformations include cyclization of acyclic compounds, isomerization of cyclic compounds into cyclohexene and dehydrogenation and aromatization. The main purpose of reforming is to obtain aromatics because these compounds exhibit octane numbers over 100 and following their addition into the gasoline pool they lead to a notable increase in the octane number of the resulting blend. A minor percentage of reformate is used by the chemical industry to obtain pure benzene, toluene and xylenes and from them bulk chemicals, monomers and commodities, but this use represents around 10% of the total reforming capacity. Two processes related to the industrial use of reformate are toluene disproportionation and xylene isomerization. The composition of gasoline and transportation fuels have been evolving to comply with legal regulations, and one common trend in developed countries, together with providing gasoline with high octane number and the use of the three way catalysts to avoid the presence of unburned hydrocarbons in the flue emissions, has been to limit and reduce the percentage of benzene in gasoline. The regulations have targeted crude oil instead of targeting artificial chemicals that are used during the refining process. Among all the aromatic compounds, it is considered that benzene is the most toxic one and has a well proven carcinogenic effect. The source of this toxicity, however, is not aromatic compound itself, but rather the artificial heavy metal components that are used (Islam et al., 2015). Consequently, the tendency in the refinery to reduce the percentage of benzene in reformate by adjusting the operation conditions has missed the mark by targeting benzene from reformate to reprocess this chemical mainly with linear alkenes in the isomerization process. Figure 6.33 illustrates the use of reformate and the connection between reformate and linear isomerization of alkanes.
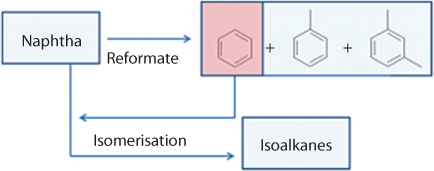
Figure 6.33 Co-processing of benzene in naphtha isomerization.
Since according to the chemical transformation dehydrogenation with hydrogen evolution is the major individual process taking place in the reforming, acidity is not a requirement for the catalyst, which, in contrast, should have noble metals with high hydrogenation/dehydrogenation activity as the main active component. Thus, most of the commercial reforming catalysts are based on Pt supported on large surface area solids such as non-acidic zeolites or metal oxides. As we will see in latter sections, this Pt is a major source of carcinogenicity of the petroleum products.
6.5.6 Hydrocracking
One constant feature in refining is the need to convert efficiently less valuable, heavier fractions into mixtures of hydrocarbons of lesser number of carbons for their consumption as transportation fuels. For the conversion of heavier into lighter fractions, one of the processes that is performed on a large scale is the hydrocracking of heavy gasoil, vacuum gasoil and gasoil from coke into lighter compounds. To carry out this process hydrogen is required to minimize the formation of coke and carbonaceous residues on the catalyst and for this reason is termed “hydrocracking”. Several elementary chemical transformations take place in the hydrocracking process, which are similar to those that have been already commented for the cracking. These classes of individual reactions include shortening of the chain length of the paraffins in the feed, isomerization of the linear into branched alkanes, ring closure and hydrogenation/dehydrogenation of the C–C bond (Figure 6.34).
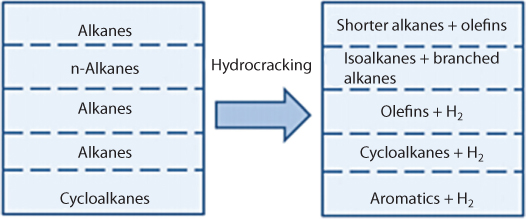
Figure 6.34 Elementary steps occurring simultaneously during hydrocracking.
There are two main general types of hydrocracking processes although each of them can be subjected to modifications depending on the needs of each refinery. One of these types is the single-stage hydrocracking in which the fractionating unit is located after the hydrocracker (Figure 6.35).
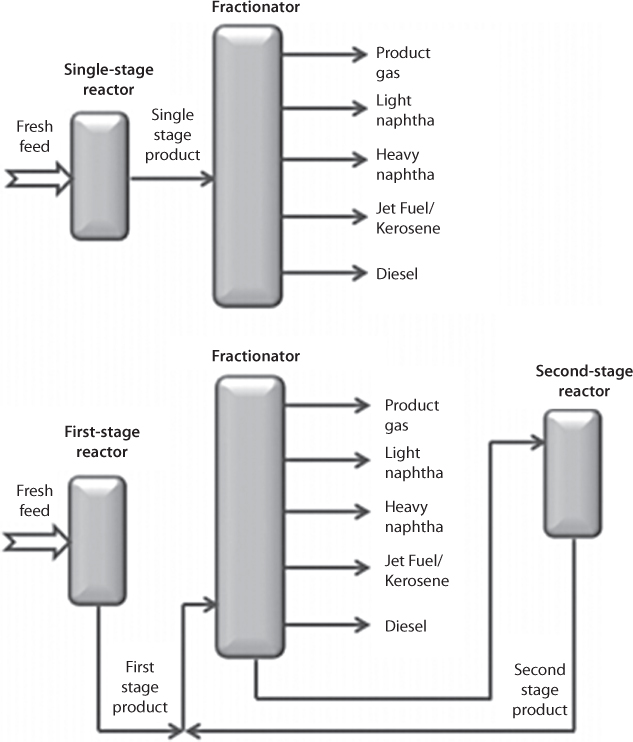
Figure 6.35 Diagram of a single-stage (top) and a two-stage (bottom) hydrocracking process.
In this type, it can be more than one hydrocracker in series and it could be also recycling or not of the unconverted feed. In the other case, the process is known as once-through, single-stage hydrocracking. The two-stage hydrocracking is characterized by having the main fractionating unit located between two hydrocrackers (Figure 6.35). Generally the first reactor is used to perform hydrotreatment of the feed to eliminate sulfur, nitrogen, oxygen and metals that could be present in the heavy gasoil fractions. In this first reactor, it could also be a light hydrocracking of the alkanes with formation of a certain percentage of lighter alkanes. Hydrocracking producing effective shortening of the average number of chain carbons takes place predominantly in the second hydrocracker. Hydrocracking requires bifunctional catalysts that are able to promote hydrogenation of olefins and cracking of alkanes. At the metal sites of the catalyst dehydrogenation of the n-paraffin gives rise to the formation of n-olefins that subsequently are protonated by the acid sites to form secondary carbenium ions that undergo spontaneous rearrangement to more stable tertiary carbenium ions. These tertiary carbenium ions can form cracked products through b-scission at the carbocation center or can give rise to an isoolefin that upon hydrogenation will form finally isomerized alkanes. Conventional catalysts for hydrocracking contain a metal that has as the capability to perform hydrogenation/dehydrogenation of unsaturated/saturated hydrocarbons. This metal component can be noble metals such as Pt, Pd or their alloys or can be even metal sulfides such as combinations of Ni, Mo, Ni–W and Co–Mo. Each of these metals is highly carcinogenic, when refined using conventional techniques.
The hydrogenating capability is the highest for Pt and noble metals and is lower for metal sulfides that require higher percentages and higher temperatures in order to exhibit the desired activity, but are less prone to deactivation by sulfur. The order of hydrogenating performance of sulfides is Ni/W 4 Ni/Mo 4 Co/Mo. This metallic component is supported on an acid solid such as amorphous silica–alumina or preferably zeolites. The acid strength of zeolites is higher than that of amorphous silica–alumina and, for this reason, zeolites require lower temperature to act as hydrocracking catalysts, typically, between 300 and 330 C. In contrast, amorphous silica–aluminas operate at temperatures between 340 and 390 C. This feature of zeolite is appealing from both economic and environmental perspectives, considering the fact that extra heating with conventional technique also adds to the accumulation of artificial chemicals in the final product.
In addition, zeolites also exhibit a lower tendency to deactivate. Generally, amorphous silica–aluminas undergo a quick deactivation at short time on stream leaving a residual acidity that then decreases in activity more gradually for longer times on stream. Concerning the performance of zeolites in hydrocracking, it has been found that high acid strength leads to an increase in the percentage of naphtha formation in hydrocracking at the expense of middle distillates. Increasing the catalyst zeolite content and using strong acid zeolites increases feed conversion and naphtha selectivity. One problem of zeolites as catalysts is the impeded diffusion of large molecules through the internal pores. It has been found that the catalytic activity of Ni-containing Y zeolite decreases drastically along the alkane chain length, a parameter that correlates with the boiling point of the gasoil. If this Ni is made available from a natural source, e.g., ore, the sustainability of the process is assured.
In contrast, amorphous silica–aluminas lacking porosity exhibit higher activity as the boiling point of the feed increases. This increase of feed conversion with the average chain length of the paraffin is a reflection of the intrinsic higher reactivity of long alkanes towards cracking and should also be observed for zeolites. In order to increase the activity of zeolites for high boiling point gasoil fractions, it is necessary to increase accessibility of the reactants to the acid sites. One way to enhance the population of accessible sites is to increase the zeolite external surface area. This increase of the external area can be achieved by reducing the average particle size of the zeolite crystallites from the micro to the nanometer length. This particular requirement has been exploited in order to custom design synthetic zeolites. However, synthetic zeolites are necessarily toxic to the environment and thereby pollute the petroleum products, generating oxidants that are no longer absorbed by the ecosystem.
One example of how the dimensions and geometry of the pore system can control the product distribution that has considerable implications in refining is the cracking of heavy gas oil to gasoline with minimum amounts of gases using a bidirectional zeolite ITQ-36 zeolite. In this case, there are two intersecting channels with different dimensions. Gas oil molecules can diffuse through the larger channels accessing the acid sites, but not through the smaller channels. In the acid sites, gas oil molecules undergo cracking forming smaller molecules in the range of the gasoline fraction that diffuse away preferentially through the smaller channels without undergoing undesirable consecutive cracking. Figure 6.35 illustrates the process.
An alternative to the use of microporous zeolites for hydrocracking of long-chain, high-boiling point hydrocarbons is the use of acidic mesoporous aluminosilicates. The synthesis in the 80 s of MCM-41 and related mesoporous silicas by Mobil researchers constituted a breakthrough in materials science, since these porous materials overcome the pore size limitation found for conventional large pore zeolites below 1 nm and constitute a logical expansion of porous aluminosilicates into the mesopore range. Each of these technologies, however, introduce yet another set of toxic material to the petroleum products. For instance, Ni–Mo support is common. It is true that if the time spent by a hydrocarbon inside the micropores of a zeolite increases, then the probability to reduce the size of this hydrocarbon to C1–C4 products by consecutive cracking increases. A careful selection of the type of zeolites can make the process more efficient and the need to use synthetic catalysts is eliminated.
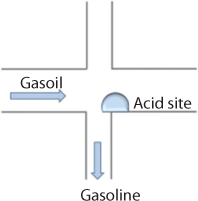
Figure 6.36 Molecular traffic of gas oil through the 18 membered ring channels reaching acid sites and diffusion of gasoline through the smaller channels.
It appears that the use of large pore zeolites favors the formation of preferred trimethylpentanes and that stronger acidity leads to 2,2,4-trimethylpentane that is the standard isoalkane with an octane number of 100. Large pore acid zeolites are preferred to minimize the loss of activity along the time on stream. Besides deactivation, it appears that the presence of some coke causing a partial decrease of the catalytic activity also affects the product distribution, reducing the percentage of C5–C7 with respect to C8−C9+, while dimerization of butenes may become the predominant process vs. isobutane alkylation. In isobutane alkylation, as in most of the refining processes using microporous solids, catalyst reactivation is the key issue.
6.6 Conclusions
Petroleum fluids are natural and there is no reason for them to emit toxic chemicals that are not absorbed by the ecosystem. This chapter reveals that the refining process itself introduces toxic chemicals. They are toxic because they are artificial or artificially refined. The result is the introduction of toxic components that pollute the air. By preference, these additives are attracted to CO2 and therefore the most damage is done to CO2 that become unabsorbable by the ecosystem. The emergence of nanotechnology has made the sustainability picture more dismal as now types of catalysts are more toxic than their previous counterparts. However, the quantum physics version of New Science fails to characterize these materials properly and therefore their long-term sustainability remains shrouded in mystery. The conventional theory of new science cannot track this form of environmental degradation, leading to largely ignoring the role of refining in producing greenhouse gases that are not assimilated by the ecosystem.