
Chapter 4. Predicting Team Velocity
Software teams are a bit like cars in that you can measure their performance in terms of efficiency. Cars measure efficiency in terms of fuel economy, how far a car can travel per unit of gasoline. Teams, on the other hand, measure their efficiency in terms of how much work they can complete over a certain period of time. This measure is commonly known as velocity and is typically expressed in terms of story points. Simply put, velocity is the average number of story points a team completes per sprint, as defined by the team’s done criteria. (Read more about done criteria in Chapter 7, “How Do You Know You’re Done?”).
I say that teams are a bit like cars because they are mostly unlike cars. Teams do not come packaged with a manufacturer’s estimate of velocity. Teams, therefore, must predict, with some degree of confidence, what their future velocities might be. And, while people can easily compare two cars’ fuel efficiencies, they cannot (and should not) compare the efficiency of two teams based on their relative velocities. That’s because while miles per gallon (or kilometers per liter) is an objective, standardized measure, velocity depends on each team’s own subjective estimates. So while one team can sometimes use another team’s velocity as a starting point for what its future velocity might be, you cannot say that one team in a company is somehow more efficient because it has a higher velocity than another team. The teams might just estimate differently.
As you have likely experienced, predicting velocity is a difficult task, especially for teams that are new to each other and new to an agile framework. The following story describes how one Scrum team dealt with this complex issue.
The Story
Wendi was the ScrumMaster for a new team. The team was excited to start its first Scrum project but was stymied by how to give management even a ballpark figure for how much work it could accomplish and by when.
Wendi asked the team for suggestions. One team member, Paul, who was visibly frustrated, started the discussion, “How are we supposed to give them velocity estimates before we’ve even started our first sprint? What are we supposed to do? Just point at a random spot on the product backlog and say here’s how far we’ll get? That seems irresponsible. Making wild guesstimates is what has gotten us into so much trouble in the past. Scrum was supposed to be different.”
“I agree, Paul, but can you imagine what would happen if we tell them we have no idea? That we’ll just let them know when we figure it out?” asked his teammate Freddie. “The reality is, if we don’t give them some kind of number, they will do it for us—‘Here’s your goal. Hit it.’ We’ve all been down that road before.”
“I wish we had some historical data,” mused Ignacio. “I talked to a friend of mine who is running a Scrum project. His team looked at its past velocities on other projects and used those numbers as a starting point for a new project. I thought about using his data to help predict our velocity, but dismissed the idea because even though our team is somewhat similar to his, we’re also very different. Our team is new, we’ve never used Scrum before, and our project has some complicating factors. I don’t know how to account for all the variances.”
They all looked at Wendi.
Paul asked, “So what are we going to do?”
Wendi went up to the whiteboard and wrote down the three ideas that had been proposed and rejected.
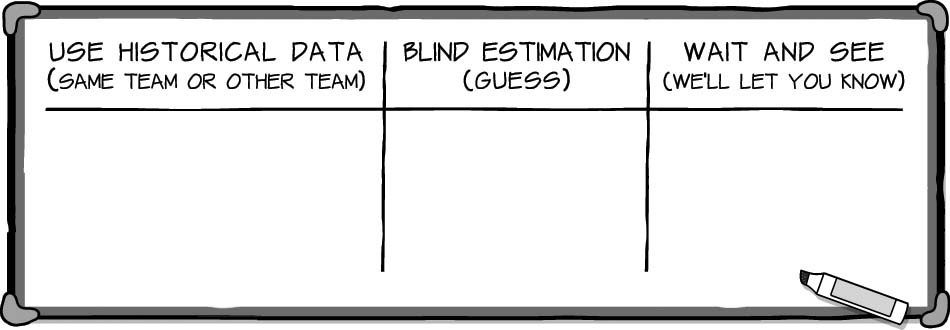
“I know, Freddie, that your suggestion to tell them ‘we’ll let you know when we figure it out’ was more tongue in cheek than anything. But I’d like us to consider it as a viable option,” Wendi explained. “So that leaves us with three options. All are problematic, but it looks like we’ve got to choose one of them. So, let’s spend some time looking at them,” suggested Wendi. “Maybe if we brainstorm some positives and negatives, we can figure out what the best solution will be. Let’s start with historical data. Call out some positives and negatives.”
As the team brainstormed answers, Wendi filled in the chart she had begun on the whiteboard.
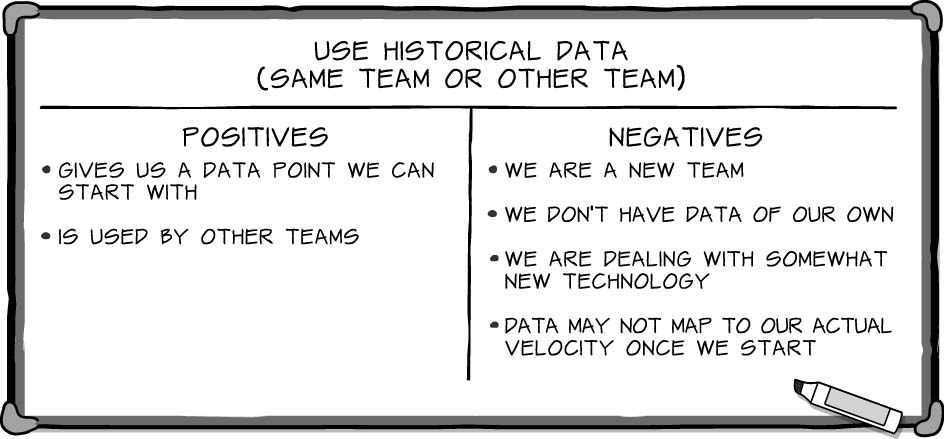
“Good,” said Wendi. “Let’s discuss this a bit before we move on to the next section.”
“I’ll go first,” said Ignacio. “We are a new team, so we don’t have data of our own. Ideally, we’d pull data from a similar team in the company, but I don’t know of any.”
“Yep,” agreed Paul. “I can’t think of any teams that we can use as an example either. Most aren’t doing Scrum at all. Those that are using Scrum are either just getting started like us or their projects are too different from ours.”
“We could look at my friend’s team,” suggested Ignacio. “But with him being at a different company, it feels like a stretch.”
Freddie nodded. “I just don’t think this one will work for us. If we had been working together for a long time, and could use our own historical data, I think it’d be okay, but to grab some random team’s numbers and use them as our estimate really scares me.”
Everyone nodded in agreement.
“I think we all agree that historical data has far more negatives than positives. Let’s move onto the next one, blind estimation,” said Wendi, reaching for her marker.
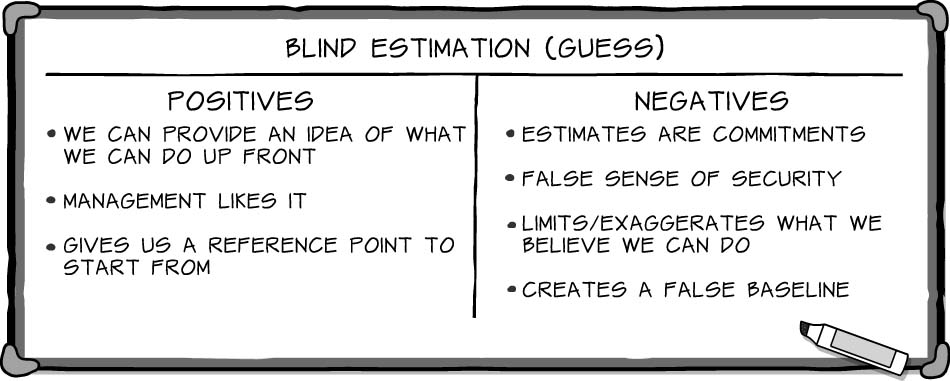
The team quickly came up with the pros and cons of blind estimation.
“This is a good list,” said Wendi. “Let’s talk about a couple of these. Who came up with the phrase ‘estimates are commitments’?” asked Wendi.
“I did,” said Paul. “My concern is that once we estimate our velocity, we’ll be held accountable to it throughout the project. What if our initial estimate is too optimistic? We need to build in a safety cushion. Take our estimate and subtract five, or something.”
The team nodded in agreement.
“Let me make sure I understand. You’re saying that if our initial velocity estimate is too high, we will burn out trying to hit that higher number each sprint?” asked Wendi.
“Exactly!” said Paul.
“I hear you, Paul,” Freddie interjected. “But it’s no better if our estimate is too low. They’ll say, ‘With all that talent on your team, you’re saying you can only do this much work per sprint? What will you do with the rest of your time?’ People will panic before we even get started; management might even say we need to add more people to get the velocity up. Then, we’ll have to start over.”
“It wouldn’t be the first time,” agreed Ignacio.
“If I hear you correctly, Freddie, you’re concerned that management will either tell us to do more—to have a higher velocity—or that they’ll add people to the project because they will assume that we must need more people to get the job done, right?” asked Wendi.
“Yes,” said the whole team.
“Fair enough,” said Wendi. “Even if we don’t go with this option, I’ll make a note to talk to management about velocity in general because this might be a concern no matter how we arrive at an estimate. I want to make sure that they understand exactly what a velocity estimate means and what it doesn’t mean.”
Wendi wrote an action item, Wendi to educate management about velocity, on the side of the whiteboard.
“Okay,” Wendi continued. “Let’s look at another of the points. What does ‘creates a false baseline’ mean?”
“I wrote that one,” said Freddie. “If we start with a wild guess as our baseline, and then do better than we expect, people will talk about how much we must have improved. If we do worse than the so-called baseline, people will wonder why. We can tell them it’s a guess all we want, but once there is a real number written down somewhere, we’re compared against it.”
“I know exactly what you mean. I’ll make a point to include that tendency in my talk with management,” Wendi said.
“Even with education, though, when it comes down to it, it’s a wild guess, a stab in the dark,” exclaimed Paul. “If we’re going to be agile, I want us to follow the principles. Plucking a number out of the air and promising to deliver it might make everyone feel better, but not for long. It’s an empty promise and will create a bad environment to try to make Scrum work.”
“I hear you, Paul,” said Ignacio. “But the fact is, that might be what we have to do, at least this time. On our next project, we’ll have some historical data of our own to work with.”
The rest of the team nodded in reluctant agreement.
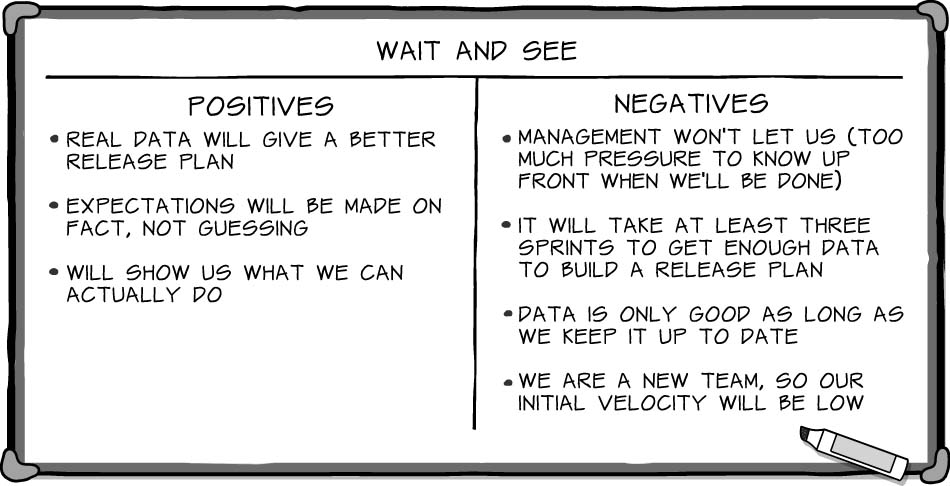
“Well, I do know some ways to make blind estimation a little less of a shot in the dark,” said Wendi. “But before we give up and start guessing, let’s take a look at my personal favorite, ‘wait and see.’ By that I mean we politely but firmly refuse to give management an estimate now. Instead, we promise a much more accurate number after we’ve run three sprints and have some real data. I can tell you my ideas on the positives.”
Wendi wrote three positives on the board. “So, you guys tell me why it won’t work.”
The team quickly pointed out the flaws.
“Thoughts?” asked Wendi.
“I’d love to go with ‘wait and see,’” said Ignacio, “but I don’t think it’s realistic. There is no way management will let us wait three sprints to give them an estimate.”
“And,” Freddie added, “even though having real data would allow us to have an accurate and reliable release plan, we’re a new team. It will take some time for us to get up to speed. I’m nervous about what our actual velocity will be during the first few sprints. What if it’s really low?”
“It is a risk,” said Wendi. “But I think it’s our best option if we want to succeed. We just have the one tiny obstacle of getting management buy-in,” said Wendi, smiling at how clearly facetious her last statement was.
“We’ll never get this by them!” Paul exclaimed. “They will require us to provide data up front. There has to be another option.”
“If someone has something better than the three we’ve already discussed, I’d love to hear it,” said Wendi, looking around the room.
The team was quiet.
Wendi continued, “We’ve walked through our options. The truth is, we just don’t have enough information at this time to be able, with any confidence, to determine our likely velocity. We could give management a number, but it would be a wild guess. Let’s try something as bold as we are. Let’s show them the options, walk them through the pros and cons, and explain that we want to start this project like we intend to complete this project: transparently and honestly.
The team looked at her with hesitation.
“But,” Wendi went on. “And this a big but. We will promise them that we’ll post our observed velocity, and as soon as we have enough historical data of our own—three sprints worth, let’s say—we’ll give them an estimated velocity range so that they can make a release plan.”
Wendi went on to explain in detail how the wait-and-see approach would work. The team agreed to give it a try. The team was even able to convince a very reluctant group of managers to wait for real data.
Beginning with sprint one, the team posted its tracking charts in public places and updated them at each daily scrum. At the end of three sprints, the team gave management an estimated velocity range and explained what that meant in terms of likely functionality. The product owner planned a release based on the pessimistic and optimistic ranges provided by the team.
Though the team ultimately delivered toward the low end of its predicted velocity range, its estimates proved accurate. As a result, no one was surprised by the released product. The product owner had all the must-have features he expected. The customers had all the features they had been promised (and had not been teased with any of the features that were questionable for the initial release). In the end, everyone agreed that combining real data with patience, education, and transparency had been the best solution.
The Model
Wendi and the team struggled with how to give their product owner an idea of how much they could accomplish each sprint. After a brief brainstorm, they came up with three solutions: historical data, blind estimation, and wait and see. Wendi’s team ultimately elected to wait and see. Why did they eliminate historical data and blind estimation?
The Problem with Historical Data
Historical data is a viable option when your team has worked together before. In this chapter’s story, Wendi’s team dismissed this option because its members were new to working together, so the only historical data available to them would have been data from another team, likely one at a different company. While it’s possible to derive a number based on another team’s performance, it’s not an option I would recommend because of all the different variables involved:
![]() The newness of the team and its composition
The newness of the team and its composition
![]() The political environment
The political environment
![]() Project size and complexity
Project size and complexity
![]() The product owner and customer
The product owner and customer
The first variable to consider is the relative newness of the team. The newness of a team will affect its velocity as compared to an existing team, if only because a new team takes time to gel. Team members must learn each other’s strengths and weaknesses and determine how best to work together. Further, a new team may not be ideally composed. It might still be clinging to some traditional approaches, such as having two separate teams—one made up only of developers and one dedicated to testing. This mono-functional team approach will not see the big performance improvements out of the gate that a truly cross-functional team will.
The next variable that can affect velocity is the political environment. Over time, companies restructure or change direction. What may have been the company goal a year ago may be obsolete now. Key managers may have shifted roles, changing the dynamics of the environment. Sometimes political changes are obvious; other times, the changes are pervasive but much more subtle. Teams using historical data must allow for these nuances, which can be very difficult to do.
The third variable to consider is project size and complexity. Teams, new or well established, that take on a project that has different technology or a change in complexity cannot rely on historical data. When Jeff Sutherland was CTO at Patientkeeper, he often told me that his teams could snuff out the competition because they were able to respond to change quickly. One of the reasons they were able to do this was that the work was similar and the teams remained consistent; they were not switching from a legacy C++ application to a Java web platform. They weren’t slowed down by a learning curve.
The last variable has to do with the product owner and customer. While these may not seem like likely variables to consider, they can be huge factors. Say the team remains the same but the product owner is new. The velocity that the team saw in the past is sure to change because not all product owners are created equal. The relationship between the team and the product owner, much like the one among new team members, needs to develop over time. By the same token, working with a new customer requires adjustments that could affect velocity as well.
If you find yourself in the situation where you are considering using historical data, take these factors into account and be careful. Using other teams’ velocities as a data point is fine. Using it as your team’s predicted velocity, however, is fraught with peril. Proceed at your own risk.
Shedding Light on Blind Estimation
If you are forced to provide some sort of velocity estimate before you’ve done any work together, blind estimation is probably your best bet. Rather than just actually guessing blindly at a number, however, you can do some background work to shed as much light on your guess as you possibly can before predicting your velocity.
The steps in this “not-quite-blind” estimation technique are as follows:
1. Estimate the product backlog.
2. Decompose a reference story.
3. Determine a point-to-hours approximation.
4. Identify the team capacity.
5. Estimate the team velocity.
6. Communicate the velocity as a range.
Before I discuss these steps in more detail, let me add a few disclaimers.
![]() First, please don’t think I’m advocating this as a general practice. I only suggest it for those situations when you absolutely have to take a guess.
First, please don’t think I’m advocating this as a general practice. I only suggest it for those situations when you absolutely have to take a guess.
![]() Second, once you have real numbers to help you make a more educated guess, throw away the estimates that you derived in this exercise. They’re artificial, a crutch to help you get started. And, worst of all, they’re based on a big agile no-no, mapping story points to hours.
Second, once you have real numbers to help you make a more educated guess, throw away the estimates that you derived in this exercise. They’re artificial, a crutch to help you get started. And, worst of all, they’re based on a big agile no-no, mapping story points to hours.
![]() Third, every number you provide in a blind estimate should be replaced with real data as soon as you’ve had time to do a sprint or two. And every point-to-hours approximation you make to arrive at that number should be discarded, no exceptions.
Third, every number you provide in a blind estimate should be replaced with real data as soon as you’ve had time to do a sprint or two. And every point-to-hours approximation you make to arrive at that number should be discarded, no exceptions.
Estimate the Product Backlog
The first step in this admittedly less-than-ideal technique is to estimate the product backlog. If the product backlog has already been estimated in points, skip to the next step. If not, you need to provide point estimates for the product backlog items. To do this, browse the product backlog with the team. You are looking for a two-point reference story. (I use a two-point story as a reference so that if the team comes across a story that is smaller, it has room to assign it a smaller point value.) Once the two-point reference story has been identified, work with the team to compare that story with every other story in the product backlog, assigning point values until each story in the backlog has a point value associated with it. I like to use Planning Poker [GRENNING] for this, but you can use any method you choose as long as the entire backlog is estimated in points when you are done. (For help with estimating particularly large, raw product backlogs, see Chapter 29, “Prioritizing and Estimating Large Backlogs—The Big Wall.”)
Decompose the Reference Story
Once the product backlog is estimated in points, it’s time to identify a rough hour-to-point mapping. To do this, you must first decompose a reference story. With the team, choose a two-point story (this may or may not be the same story as you used in step one). For that story, identify the tasks necessary to complete it. I use Osborn’s brainstorming technique, as identified in Chapter 7, to identify the tasks. This is a highly interactive process and is most effective if everyone participates.
Once the team has identified the tasks for the reference story, it needs to estimate how many hours those tasks will take to complete. You can use Planning Poker to arrive at these estimates; just have the numbers on the cards represent hours instead of points. Because I advocate that teams limit estimates of any task to no more than 13 hours (if a task will take longer than 13 hours, break it into multiple tasks), remove all the higher cards for your deck—you might even consider removing the 13. Further, stick to the numbers on the cards. If you are using the Fibonacci sequence, that means you will have six values to choose from: 1, 2, 3, 5, 8, 13. What if a person estimates the task at four hours? The person must choose—three or five. This is done to maintain a level of accuracy that is good enough without being too precise.
Points-to-Hours Approximation
Suppose that when the hours for each task are added together, the total for the reference story is 14 hours. The next step is to extrapolate: All two-point stories in the product backlog will take the team roughly 14 hours to complete. Of course, in actuality the team might complete this, or any other two-point story, in 2 hours, 8 hours, or 16 hours. It’s a rough estimate—and for the purposes of blind estimation, that’s okay. From this, you can determine a points-to-hours approximation.
14 hours/2 points = 7 hours per point
Let me emphasize one more time: You don’t know nearly enough about your team, your project, or the realities of the development to have a number this specific in mind. Use the points-to-hours approximation to help build your initial estimate, and then throw it away as soon as you have real data.
Team Capacity
Next, you need to determine the team’s capacity. To calculate capacity, decide how many hours per sprint the team (not individuals) will contribute to the project. To get this number, you have to collect data at the individual level; however, remember to report back what the team commitment is, not what the individual commitments are.
Have each team member write the number of hours he or she has available per week to contribute to the project. Remember, this number should not be 40. Everyone has unrelated project activities that often interfere with dedicated project time. This overhead ultimately takes away from the time each person has available to do actual task-related work. Ask people to communicate their availability as two numbers: best case (high) and worst case (low).
Add the worst-case estimates together and multiply by the number of weeks in a sprint. This is your low-range team capacity. Add the best-case estimates together and multiply that by the number of weeks in a sprint. This is your high-range team capacity. Table 4-1 presents an example.
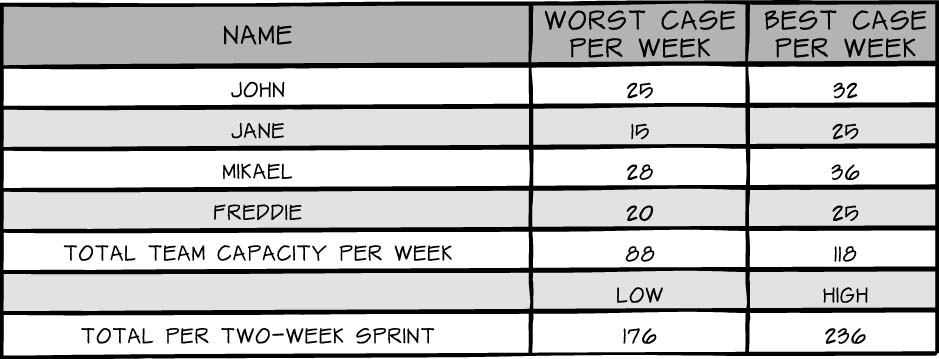
In this table, I took the sum of the low-range weekly capacity and multiplied it by the number of weeks in a sprint (2) to get a total of 176 hours. I then took the sum of the team members’ high-range capacities per week and multiplied it by sprint length in weeks (2) to get a total of 236 available hours. It is likely that the actual team capacity will not be either the absolute high or the absolute low; the team should feel confident, though, that its capacity will fall somewhere in between the two extremes.
Estimate Team Velocity
The following has been determined for this example:
![]() The product backlog has 200 points.
The product backlog has 200 points.
![]() A two-point story is estimated to take roughly 14 hours, or 7 hours per point.
A two-point story is estimated to take roughly 14 hours, or 7 hours per point.
![]() The team believes it can deliver between 176 and 236 hours of work per sprint.
The team believes it can deliver between 176 and 236 hours of work per sprint.
You now have enough data to estimate the velocity for the team. Determine a low velocity and a high velocity by dividing the low- and high-capacity ranges for the team by the estimated hours per point and rounding down, as shown in Table 4-2.

In this example, the estimated velocity could be communicated as being between 25 and 33 points per sprint. To learn how to use that information to devise an initial release plan, see Chapter 11, “Release Planning.”
Increasing Confidence in the Technique
Extrapolating a number of hours per point from one reference story is very rough and very quick. If you’d like, you can refine your estimate further by estimating a few different reference stories of the same point value. Suppose you estimate five two-point reference stories:
1. Your initial story: 14 hours
2. Story 2: 22 hours
3. Story 3: 30 hours
4. Story 4: 25 hours
5. Story 5: 20 hours
From this, you can see that the initial reference story of 14 hours might be a bit low. A more accurate estimate seems to be approximately 22 hours, with 14 and 30 hours being outliers. Adding more reference points may help increase your confidence in your blind estimates, but it does take significantly more work and relies on a relatively well-estimated product backlog. It might also give you a false sense of security in your velocity estimate.
Remember that no matter how many data points you use, at the time in which you are estimating these stories, your team has yet to do any work. You really don’t know for certain at this point how long it will take you to accomplish any task. Whether you choose to extrapolate from one data point or more, remind your team and your stakeholders that the estimated range is very rough and will certainly change as the team begins to get a better picture of how much work they can accomplish per sprint.
Wait and See (Use Real Data)
Wendi and the team ultimately decided to wait and see what their average velocity is for the first few sprints before providing an initial estimate. The team planned to run three sprints, capturing the observed velocity data at the end of each one. I prefer this option because the team is making its calculations based on real data, data that does not exist until the project is running.
Even if you have to communicate an estimate using historical data or blind estimation, you should still collect your own data and revise your estimate based on that data as soon as you can. In fact, you should track your velocity and refine your estimates throughout the life of your project, no matter which initial method you choose. (For details on how to maintain a release plan, see Chapter 11).
The benefit of waiting and seeing, of using real data, is that the team is using its own data on its current project. Basing an estimate on reality enables a release plan to reflect fact, not fiction. The main hurdle to this approach is that management is going to want a number before you are ready to give them one. To overcome this obstacle, communicate the benefits of waiting to the management team and lay out a plan as to when the team will provide numbers and why real data is worth waiting for.
When using real data, you should follow these steps:
1. Collect and chart your actual velocity for at least three sprints.
2. Calculate average velocity, but communicate a range.
3. Map your velocity range to the product backlog.
4. Update your velocity and likely velocity range after each sprint.
Collect and Chart Real Data
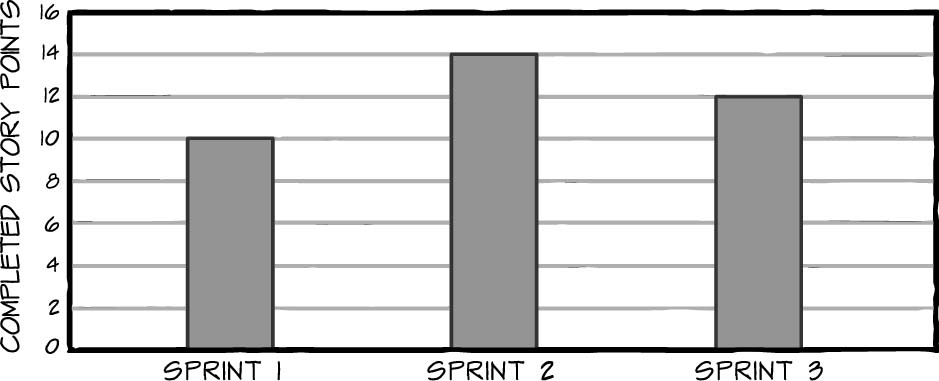
The first step is to collect your team’s data. Track your velocity for three sprints, mapping the data on a public chart posted in the team area. At the end of three sprints, your chart will look something like the one in Figure 4-1.
Calculate Average Velocity but Communicate a Range
Once you have three sprints worth of data, calculate your average velocity. Do not, however, communicate this average. Why? First, because yours is a new team, this initial data might not be stable enough to use for an extended period of time. Second, you want to avoid misunderstandings that arise from fixating on a set number. For example, as I was writing this chapter, my wife asked me what time I would be done and ready for dinner. I told her, in about 30 minutes. What I meant when I said about was somewhere between 20 and 40 minutes. What she heard was 30 minutes—not 29, not 31—30. She fixated on a number and held me to it.
When the 30-minute mark came, therefore, she said, “Okay, it’s been 30 minutes. You should be done—come and eat or the food will be cold.” My response, which was less than stellar, was, “But I’m not done. I said about 30 minutes; I need another 10 minutes.” This frustrated her beyond belief. I was 95 percent confident that I would be done in 20 to 40 minutes, but I did not communicate it that way; I communicated 30. My wife heard this as a commitment. I meant it as an approximation.
If I had given my wife a range, “I am 95 percent sure I’ll be done in 20 to 40 minutes, she would have known to have dinner ready in 40 minutes (my worst-case estimate) but would have had some hope that I would be there to help set the table and open the wine if I finished earlier. By saying 30 straight up, I communicated a high degree of confidence in a number that was merely the middle of a likely range.
You don’t want frustrated management and disappointed customers. If you give them a set velocity, they are likely to make plans around that one number. If you give them a range, on the other hand, they are more likely to plan for a best-case and worst-case scenario. If you tell them you have a range but are not very confident in it yet, they are likely to make those plans a little more flexible. It’s all about communication. Avoiding misunderstandings goes a long way toward having a satisfied customer.
So, even though you’ll capture your average velocity, you will not communicate your average velocity. Instead, talk in terms of a likely velocity range and your confidence in that range. Imagine that the numbers in the chart in Figure 4-1 reflect your actual velocity during your team’s first three sprints. Your average velocity would be 12 ((10 + 14 + 12)/3). Your likely velocity range, however, would be 10 to 14 (low velocity to high velocity). And because you are a new team that is still forming and storming, your degree of confidence that future velocities will fall in this range might be 75 percent. (For more on stages of team development, see Chapter 20, “Adding New Team Members.”)
It is important to remember that the degree of confidence is subjective and qualitative. While there are ways to measure subjective confidence, I don’t recommend that you try to measure it in any absolute sense. I find the effort too high compared to the small amount of value gained.
To determine the team’s degree of confidence, have each team member write down his or her confidence rating on a piece of paper—when everyone has a number written down, flip over all the written pages at once. You can skip this if your team is comfortable doing this verbally and just have everyone answer at the same time. The point is to prevent people from being influenced by others’ answers. Next, review the numbers that the team members chose. If the numbers are similar, you’ve found your team’s confidence rating. If, on the other hand, you have a large range of confidence numbers, you need to have more discussions. Ask if there are specific reasons why someone is less confident than others (e.g., I think we’ll go faster in future sprints because it will take some time to understand the technology; I think we might slow down for a few sprints because we’re going to learn how to work in pairs). Encourage the team to talk it out. Then, vote again. Do this until all of the individual confidence ratings converge.
Truncated Data Collection
Too often teams who initially get permission to collect data for three sprints before communicating a range are coerced into providing data after only one or two sprints together so that the product owner can communicate the release plan to management, customers, and stakeholders. The limited amount of data makes it difficult to communicate a realistic range.
If you find yourself in this situation, consider two approaches. The first is to use Mike Cohn’s multipliers. This table of multipliers gives teams a way to communicate a probable velocity range until they have enough meaningful data to calculate their own. In Agile Estimation and Planning, Cohn explains how to use multipliers to estimate future velocity based on observed team velocity, as seen in Table 4-3. You can see that Cohn recommends that if you have completed only one iteration, you should multiply your velocity by the high and low multipliers to arrive at a range you can communicate [COHN].
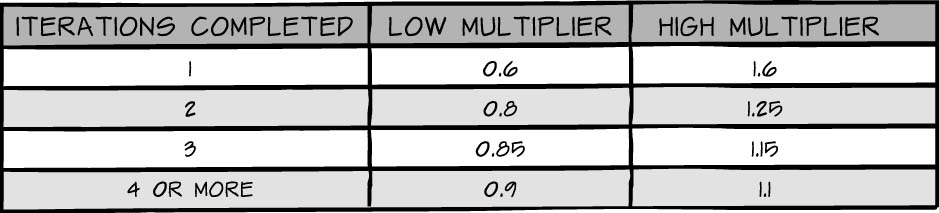
In my early projects I started with Cohn’s values, as listed in Table 4-3. They were extremely helpful. As I encountered different teams with different backgrounds working on different technologies, however, I found that I started modifying Cohn’s matrix into something that was not driven by the number of iterations a team has under its belt. Why? Well, I didn’t always have experienced teams, and often after the fourth sprint, we’d find that we still needed the same multiplier that we used in sprint one. In other words, I found that the number of iterations necessary to reach a stable velocity was different for experienced teams than for newly formed teams, and I wanted a matrix that would reflect that reality. This modified model is illustrated in Table 4-4.
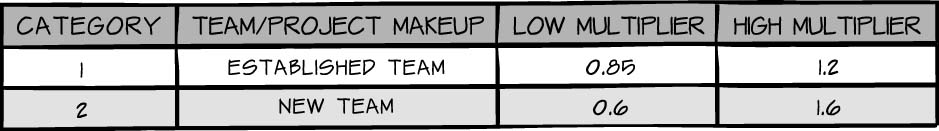
To see how the modified matrix works, suppose Team SuperBunny is a newly formed team for a project and its team members are working together for the first time. The team runs its first sprint and, like the team in Figure 4-1, achieves a velocity of 10. If after that sprint, the team is pressed to communicate a range, it should use the low and high multipliers for Category 2, new team.
As I progressed with this modified matrix, I realized another factor that continually surfaced: the technology or project type the teams were working on. I started asking myself, “Is the project technology completely new to the people (unknown technology), or is it something that the majority or all of the team has experience with (known technology)?” This question is important to consider because unknown technologies create a level of uncertainty and risk that would not otherwise be present for a team that is just doing “the same old type of work.”
Because of this, the next filter I pass a team and a project through expands on my original modified velocity matrix in Table 4-4 and includes project/technology familiarity, illustrated in Table 4-5. Of course, how familiar a team is with a technology is subjective, but it is an important factor when a team is in the early stages of a project and working to communicate its velocity.
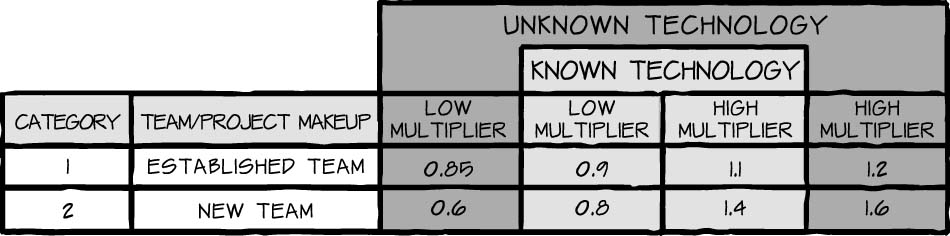
The volatility of the team’s velocity varies according to its makeup and project type. I find that more stable teams can stop using this table after one or two months (two to four sprints depending on sprint length). Newer teams have a harder time and should continue to factor in high and low multipliers for about three months (three to six sprints depending on sprint length). Once three months have passed, teams should not use this table and should instead rely solely on their realized velocity ranges.
Keys to Success
Determining your team’s velocity does not have to be a challenge. The three techniques listed in this chapter can help you get started and keep your velocity on track.
I am often asked which approach I recommend. Each approach has a time and a place and its own merits and issues. Table 4-6 summarizes my recommendations.
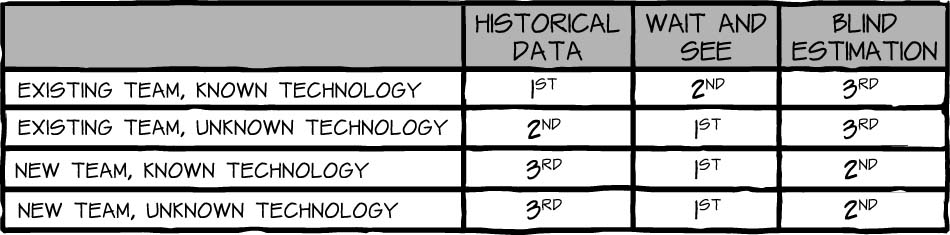
Waiting for the observed velocity produces the best result, as it is based on actual team data. It can, however, make management or customers (especially those new to Scrum) feel uncomfortable, as there will be no initial release plan generated by the team. This may negatively affect the trust the team has with its stakeholders, resulting in increased pressure for the team to deliver. Compound this with an initial velocity that is not what management or the customers were expecting, and the team will find itself in a hole that it must dig itself out of before it even starts. To make waiting a viable option, the ScrumMaster must work especially closely with the product owner to help manage expectations and communicate progress. Some suggestions for ways to keep stakeholders in the loop are to invite them to the sprint review meetings, to allow them to watch the daily scrum, and, if needed, to host small, informal midsprint reviews for people concerned about how much progress is being made.
Using historical data can be an excellent option with an existing team working in an environment similar to those it has encountered in the past. As the list of varying environmental conditions increases, however, the viability of this option decreases. Factors such as changes to team composition and technology or a new customer or product owner will impact a team’s ability to rely on historical data elements.
Blindly estimating the team’s velocity using reference stories will, at least at first, give the team, customers, and management the comfort they are looking for. Doing so, however, sets a trap. Too often the team’s initial release plan, which was based solely on its calculated velocity, is turned into a commitment. The ScrumMaster must work with the product owner and customer to correctly manage their expectations. The ScrumMaster must be sure that everyone involved understands that the velocity calculation the team derived is a calculated guess intended solely to help build a release plan. All stakeholders must understand that once observed data is in place, the calculated estimates will disappear and be replaced with real data.
Whatever technique you use to arrive at your velocity, remember that this number is the epitome of a ball-park estimate. As soon as you have run a sprint, any estimates derived from historical data or blind estimation should be thrown out and replaced with a predictive range based on whatever velocity was attained in your first sprint. As the project progresses, your confidence in your velocity range will increase. Continue to throw out previous estimates and replace them with new ones as you gather more data. Most importantly, communicate with and be transparent to your customers and stakeholders so that they too understand how much confidence they should place in your initial, interim, and later estimates. In all cases, remember to use ranges and to express your answer with a degree of confidence that will help people understand how much trust to put into each estimate.
References
[COHN] Cohn, Mike. 2006. Agile Estimating and Planning. Upper Saddle River, NJ: Prentice Hall.
[GRENNING] Grenning, James. http://renaissancesoftware.net/files/articles/PlanningPoker-v1.1.pdf (accessed on 11 June 2009).