
Chapter 25. Optimizing and Measuring Value
Do more. Do more. Do more. Teams hear it in their sleep. But there comes a point when, no matter how hard they push, teams just can’t increase velocity under the current conditions. The reality is that other things—company meetings, documentation, email, product backlog grooming, planning, you name it—are competing for the team’s time.
Unfortunately, customers and stakeholders don’t see all the behind-the-scenes work the team is doing. They see only their own stories and themes being developed. And they understandably want as many stories for their money as they can get.
What is missing is transparency. Most Scrum teams use the burndown to provide visibility into their current sprints, which is a good visual indicator of progress—mostly. It turns out, though, that if you really want to understand how the team spends its time, you need more than that. By providing transparency and visibility into the work types the team is addressing, product owners and businesses can optimize for value.
The Story
Sabela was working as a ScrumMaster with a product owner named Reisa. Reisa did a great job working with the stakeholders to prioritize the backlog. She was readily available and had the answers the team needed. She was a good product owner. About four months into the project, though, Reisa started asking Sabela and the team if they could improve their velocity a little bit. The team was stunned. Sabela told Reisa that, for months, the team had been tweaking things and felt it was at its max output. Not convinced, Reisa continued to question the team on a regular basis, asking if there was any way they could get more work done in the two-week sprints.
The team wanted to please its customer, so during its ninth and tenth sprints, the team tried to squeak out a higher velocity without sacrificing team values and engineering practices—and it worked. The velocity output for the sprint jumped to just above the average for sprint nine, but during sprint ten, it returned to the average it had been in the first eight sprints. Unfortunately, after a month of “pushing it,” the team’s average velocity was not affected in any significant way. At the end of sprint ten, the team finally asked Reisa what was behind her prodding.
Reisa told the team that she was getting pressure from her stakeholders and management to drive the team harder. “We understand that pressure,” Sabela told Reisa, “but given the constraints we have, our current velocity is as good as it’s going to get. We can’t go any faster.”
“What constraints are you talking about?” Reisa asked.
“The constraints that we have within the company. Not every task we do is for a story; sometimes we need to figure things out, go to the Scrum-related meetings, get together with the database team to rehash some of our ongoing problems, or do security, compliance, or accessibility reviews. The list seems to go on and on. Some of it is essential for producing quality software; some of it is, frankly, just noise,” replied Michel, a team member. “The problem is, we can’t get rid of the stuff that is noise because it’s driven by the powers that be.”
“I don’t understand,” said Reisa. “Please elaborate for me.”
The team went on to explain to Reisa that the work it was doing basically fell into four simple categories:
1. Stories (feature work) that deliver value to the stakeholders of the system, what the money is meant to be spent on.
2. Taxes, which are the cost of doing business. The team lumped things like mandatory company meetings, the Scrum-related meetings, security reviews, and similar items in this category.
3. Spikes, which are items to investigate for the future. These were used to understand and estimate the ambiguous stories. Teams often encounter stories that are quite large and have a lot of uncertainty. Instead of making a list of assumptions and estimating the story, this team set aside a certain number of hours to investigate what needed to be done to drive out the ambiguity and reduce the risk profile for that story or set of stories.
4. Technical debt, which pays down of the sloppiness of the legacy system.
“I think I understand,” said Reisa. “So, what can we do to increase our velocity?” The team looked at her blankly.
“What do you mean, ‘our velocity’?” Sabela asked. “Do you mean you want to see more stories completed in each sprint, despite the constraints we described?”
“Yes, I want to see you complete more stories that deliver user value. What do we need to do to make this happen?” said Reisa.
Sabela picked up a one-liter water bottle that someone had on the desk.
“Reisa, how much water can fit in this bottle?” Sabela asked. Reisa looked perplexed but tried to answer.
“Well, one liter?” said Reisa.
“You tell me: is it?” Sabela responded.
Reisa confirmed. The one-liter bottle that Sabela was holding could indeed hold one liter of water. The two continued the conversation and clarified that the bottle could also hold one half of a liter of water, but it could not hold more than one liter. To have the bottle hold more than one liter, the bottle would need to be reengineered or Reisa would need to get a bigger bottle. Reisa understood this.
“Reisa, the bottle represents the team’s velocity. We can carry one liter of work per sprint. Story work is just one type of work that we need to do over each sprint, so feature work cannot fill the entire bottle, take up the entire velocity, because those other work types, things like taxes, spikes, and technical debt, need to fit in the bottle, too,” Sabela said.
Reisa nodded in understanding.
“So, what you are telling me is that for the team to get more work done, more feature work, we need to either get a bigger bottle or reduce the other work types?”
“Yes!” shouted the entire team, visibly excited that it was starting to click.
“Why would I not want to just focus on delivering stories now and worry about the other work types later?” said Reisa.
“Because, just delivering stories does not ensure we have potentially shippable software. Calling a story done1 depends directly on some of the non-story work we have in our bottle—specifically, the debt and the spikes,” Sabela explained.
1. See Chapter 7, “How Do You Know You’re Done?,” for more on the team’s definition of done.
“So, is there any way to make room?” asked Reisa thoughtfully. “What about taxes?”
“Most of those are set in stone. But there is some waste there—especially some of the unnecessary meetings we’re having with the database team,” said Sabela. “If we could come up with a more efficient way to share data, it might help free up some room in our bottle—but we’ll need your help and management buy-in to make that happen.”
“I agree. I do not think we can get rid of many of the taxes, but it would help me tremendously to be able to show everyone exactly how the team’s time is being spent and where we might be able to help clear some space for you. Can you make a chart so that I can bring this up with management?”
Reisa shared the chart with the project customers and stakeholders. They were able to remove the unnecessary meetings and saw an improvement in the team’s availability and velocity. Though they searched for more ways to make room in the “team bottle,” they were unable to identify other opportunities for optimization. Once everyone saw how full the team’s time really was, however, the barrage of “get velocity higher” statements and questions stopped.
The team continued to work with Reisa on what these four basic categories meant and how the team could integrate the model into its work moving forward. Reisa liked the visibility it gave her, and so did the stakeholders.
The Model
Reisa’s issue was that she did not understand where the team was spending its time. She knew that the burndown charts showed work getting done, and she knew that the work was coming from her product backlog. But she never understood why the team committed to such a low level of output—at least a low level as she saw it. She was getting pressure from stakeholders and management to have the team complete more features, and the team was pushing back. What was missing was the transparency and insight into what the team was actually doing when it wasn’t working directly on features.
I, too, have battled ambiguity with customers, so I created this model. It is not revolutionary, but its simplicity enables teams to communicate to their stakeholders and customers how they are spending their time.
To provide the transparency and insight needed to make intelligent decisions, break the work down into these categories:
![]() Stories
Stories
![]() Taxes
Taxes
![]() Spikes
Spikes
![]() Technical debt
Technical debt
![]() Other potential categories
Other potential categories
These buckets and their definitions have been built and refined over years of projects and dozens of project teams. I do not expect them to fit your business perfectly; however, they were written broadly enough that they should work for everyone. If you choose to refactor them, remember to keep the intent of the definition the same while changing the words.
Stories
Stories are any work that delivers actual value to the stakeholders. I define a story as follows:
Functionality that will deliver business value to either a user or purchaser of a system or software package.
Story work can be attributed directly to return on investment. Money spent on feature work should provide an overall return that is higher than the cost to build the feature.
Taxes
Taxes, whether they’re income taxes or corporate mandates, are often loathed by the people and teams paying them. I have found them to be both a saving grace and a gnarly burr in my side, almost simultaneously. Without them, infrastructure would degrade, and, when building systems, teams would quickly fall out of compliance. They are a necessary evil. I define team taxes as the following:
Corporate services or mandated requirements that pose a burdensome charge, obligation, duty, or demand on teams or groups.
Based on this definition, when shipping software, you find taxes imposed by both the company and the team. A sample of the taxes paid on the project discussed in the story follows:
![]() Security reviews
Security reviews
![]() Legal compliance reviews
Legal compliance reviews
![]() Scrum meetings, such as planning, grooming, and the daily scrum
Scrum meetings, such as planning, grooming, and the daily scrum
![]() Company or divisional meetings
Company or divisional meetings
These are only a handful of the items typically required to release software (such as security reviews) or that compete for the team’s time (such as the Scrum meetings and company meetings). Businesses want to see value built as quickly as possible and sometimes forget that there is more to building software than just writing code and testing it. Financial systems, for example, require Sarbanes-Oxley compliance, so teams should expect the taxes in that environment to be higher than those of a small, eight-person web development company that focuses on building interactive websites. The meetings with the database teams that Sabela mentions in the story are an example of extraneous taxes that inflate the category and reduce overall feature delivery.
You noticed that I lumped Scrum overhead into taxes. The Scrum meetings, such as planning, retrospectives, and reviews are all necessary taxes that come with Scrum.
Spikes
A spike is used when the team cannot accurately estimate a story or feature set in its current form. A spike is a brief experiment to learn more about an area of an application. There are many definitions for a spike. I use the following:
A spike is a brief, timeboxed activity used to discover work needed to accomplish a large, ambiguous task or story.
All spikes must be timeboxed—a certain amount of time should be allocated to explore and further define work efforts that can’t be properly estimated. The end result is a story or task estimate with a higher degree of accuracy.
An example of a spike would be something like “Investigate what the deployment process should be. Document and estimate the story in the product backlog.” It would be impossible to estimate how long it takes to deploy without understanding what the deployment process is for the project and for the company.
One caveat about spiking work: The outcome of the spike, whether it be a set of tasks or more stories, cannot become part of the current sprint backlog. The new work items identified in the spike need to be prioritized with the rest of the product backlog by the product owner. Why? There are several reasons.
For one, the team has already committed to the goal and the stories on the sprint backlog, one of which was a spike. The team should not have committed to the tasks that would come out of that spike, because the team could not have known what the tasks would be. Therefore, these tasks should not be added to the sprint. If the team did try to factor in the outcome of the spike, and set aside time to spend on some of the work from the spike, it would negate the benefit of a spike.
Another reason to not add spike outcomes to the same sprint is that the newly defined tasks may not be of higher priority or value to the product owner than tasks that already exist in the backlog. It is not up to the team to arbitrarily take on the work from the spike without consulting the product owner.
Bottom line: Spike in one sprint; work on the outcome in another, as prioritized by the product owner.
Technical Debt
Technical debt seems to be everywhere today, from large companies to small startups. The debt that accumulates can kill a project, Scrum or otherwise. What is technical debt? Wikipedia has a great definition [WIKIPEDIA]:
Technical debt (also known as design debt or code debt) is a recent metaphor referring to the eventual consequences of poor system design, software architecture or software development within a codebase. The debt can be thought of as work that needs to be done before a particular job can be considered complete or proper. If the debt is not repaid, then it will keep on accumulating interest, making it hard to implement changes later on.
Think about your credit card. If you pay the full bill each month, you’re debt free. However, if you decide to make payments, you’re going to be paying a lot more in the future because your interest charges will accumulate. The same is true with software, which is why good Scrum teams have a clear definition of done; it’s meant to combat the debt that can accumulate and build.
Managing technical debt requires discipline. All teams know what the right things to do are; however, sometimes laziness and business pressures drive teams to make bad choices. You’ve probably sworn at a legacy system you’ve had to work on. Why? Because the team from years ago was undisciplined and chose to let debt accumulate. Debt has to be paid, so it’s best to show it in the sprint backlog and pay as you go.
Lastly, remember that if you end a sprint with newly created or newly found debt, you’re not really at the point where the stories are potentially shippable, or done.
Other Potential Categories
When I see teams utilize this model, they have usually tweaked it a bit, which is great. Often, teams choose to track bugs, unplanned outages, and an item I once used quite often, preconditions.
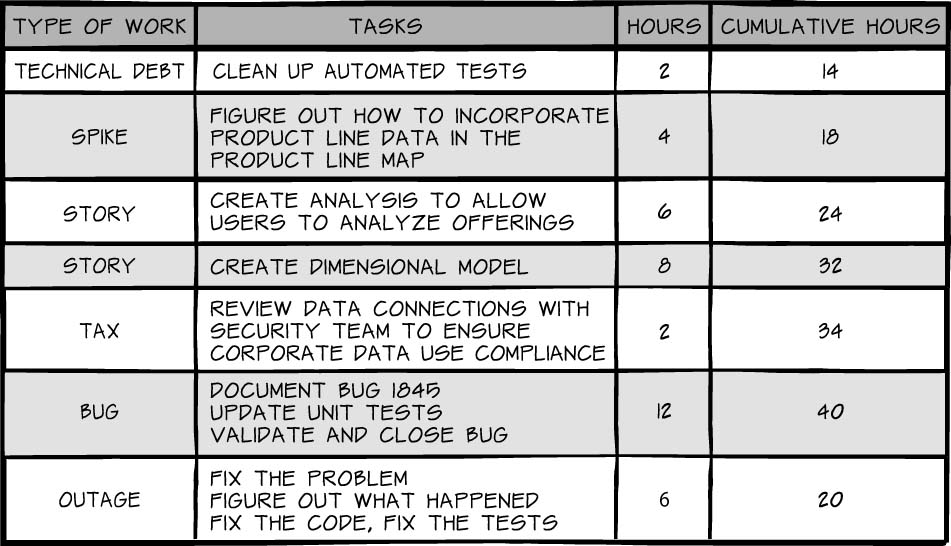
Some teams find it important to track defects separately from the feature work. This is okay. If your organization likes to see where defects go, by all means track them. You would do so by adding a category of “bugs” or “defects” and track it, as illustrated in Table 25-1. This enables you to view it visually, as illustrated in Figure 25-1. Do the same for outages.
The last potential category is preconditions.
Preconditions are items that are not part of a story’s tasks yet still must happen by sprint end. These are items identified by the team and negotiated with the product owner and ScrumMaster. Without completion of the items, the team cannot say, “The sprint is complete.”
An example of a precondition is “Set up a build environment.” While many are tempted to say the build should just happen, it’s better to track the work because it is going to contend for the team’s time. What I have found over the years is that items that would typically fall into this definition are now addressed in sprint 0, or project setup/initiation. Setting up a build environment is a setup task, and it needs to happen, but well before the first sprint starts. I find that I use preconditions less and less as more and more teams mature and become familiar with agile and Scrum. I would not consider tracking preconditions a hard requirement, but teams today still find preconditions helpful.
Structuring the Data
To structure the data, the team should start with a review of each task in the sprint backlog. Items should then have an identifier added to them that falls in one of the buckets just discussed. A snippet from an example sprint backlog is listed in Table 25-1.
Using the Data
Whether the data is stored in a spreadsheet or a database, you are now able to do analysis on the data and provide insight for the stakeholders of the system.
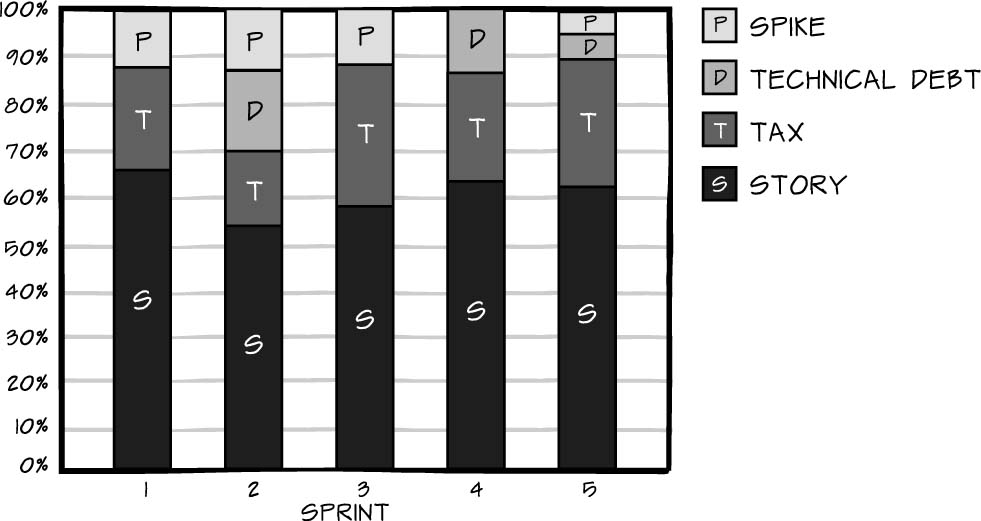
By drawing a chart like the one shown in Figure 25-1, you can see where the time is spent on a project.
In this example, the team averages close to 60 percent of its time on feature work, about 25 percent of its time on taxes, and about 10 percent of its time on spikes. Technical debt is addressed more intermittently.
From a financial perspective, the customers are paying $1.00 but are getting only $0.60 of value, based on feature work. Some will argue that spikes provide value because they will inform future work, but they don’t advance any features in the sprint, which means they have no value. In sprint 5, the taxes were nearly 30 percent—during that sprint, $0.30 of every dollar was spent on the cost of doing business.
Now, expanding this chart to include outages and bugs, note that in Figure 25-2 the value of the customer’s dollar drops significantly. In this example, the team averages close to 45 percent of its time on feature work, about 20 to 25 percent of its time on taxes, about 10 percent of its time on technical debt (when it surfaces), 10 to 15 percent on outages when they surface, and about 10 percent on bugs or defects.
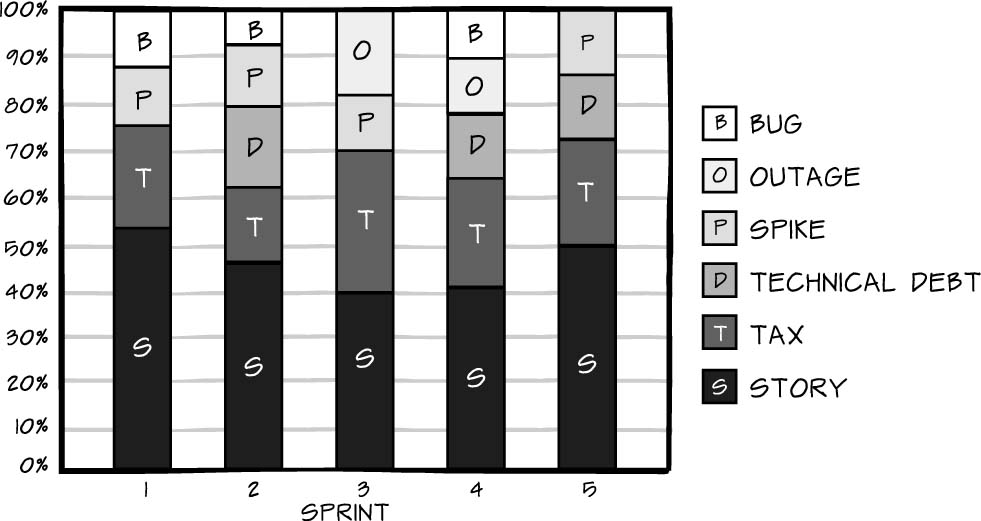
At first, this increased transparency can really hurt. I’ve seen charts like this where the value, the number of stories delivered, is as low as 10 percent, with bugs and debt taking up 70 percent of the team’s time. Until the non-story-related work is visible, though, you can’t start addressing it.
Keys to Success
With metrics like these at hand, you can readily provide your stakeholders with a tremendous amount of visibility into where their money goes. When implementing this model, remember to educate stakeholders about the model and work with them to find ways to maximize work-producing time. If you track this data for multiple teams, you also gain a new ability to spot trends and potential problems.
Educate Stakeholders
I often find that stakeholders care about two things: money and time. One impacts the other. Too often, stakeholders don’t understand why solutions cannot be implemented instantaneously. A complete, high-level categorization of the activities competing for the team’s time gives them a broader perspective: Time spent in one category of work directly impacts the others.
The model divides the team’s time into buckets. Though the chapter provided some sample categories, you might need to identify different ways to characterize the team’s work in your organization. It’s important that you expose how the team spends its time; it’s much less important to adhere to a rigid category list.
Show your stakeholders and customers where their money goes and how much time and money the activities that surround software building consume. This level of transparency will go a long way toward ultimately gaining their acceptance of release dates, value, and the overall cost of physically doing the project.
Work with Stakeholders
Once the chart is complete, remind the team and stakeholders that this behind-the-scenes look into the team’s time is not meant to be used against the team. On the contrary, it is designed to help the team and the stakeholders identify ways to eliminate time-wasting activities or inefficiencies in the team’s time that are beyond the team’s control. For example, the stakeholders in the story were able to see how much time certain corporate taxes consumed and look for ways to move them out of the team’s way.
You will never eliminate all non-work-producing activities. Some overhead is inescapable. And in some cases, you might not be able to identify any areas to streamline. That’s okay. The point is to provide a transparent look at why the team moves at the speed it does. The actions that come out of the data will vary from team to team and project to project.
Determine Trends and Patterns
If you use this model with multiple teams, you can use the data you collect to identify patterns and trends in the company. Recognizing patterns and trends can help you to forecast or spot trouble on new projects. Establish baselines, showing that by project type, a certain percentage of team time spent in each category is typical. When a team begins to venture outside the established patterns of the company, further digging into that team’s deviation might be appropriate.
In the end, this model is about transparency and accountability. Implementing it on your project not only enables you to have insight into the work the team is doing, and what type of work it is, it undoubtedly raises blocking issues that are preventing higher-performing teams from thriving in your company today.
Reference
[WIKIPEDIA] Wikipedia.com. http://en.wikipedia.org/wiki/Technical_debt (accessed 25 February 2015).
Works Consulted
Jeffries, Ron. “Essential XP: Card, Conversation, Confirmation.” XProgramming.com. http://xprogramming.com/articles/expcardconversationconfirmation/ (accessed 1 April 2015).
Wake, Bill. “INVEST in Good Stories and SMART Tasks.” http://xp123.com/xplor/xp0308/index.shtml.