The final clustering method we will look at is spectral clustering. In this section, we will learn what spectral clustering is and demonstrate how to perform it.
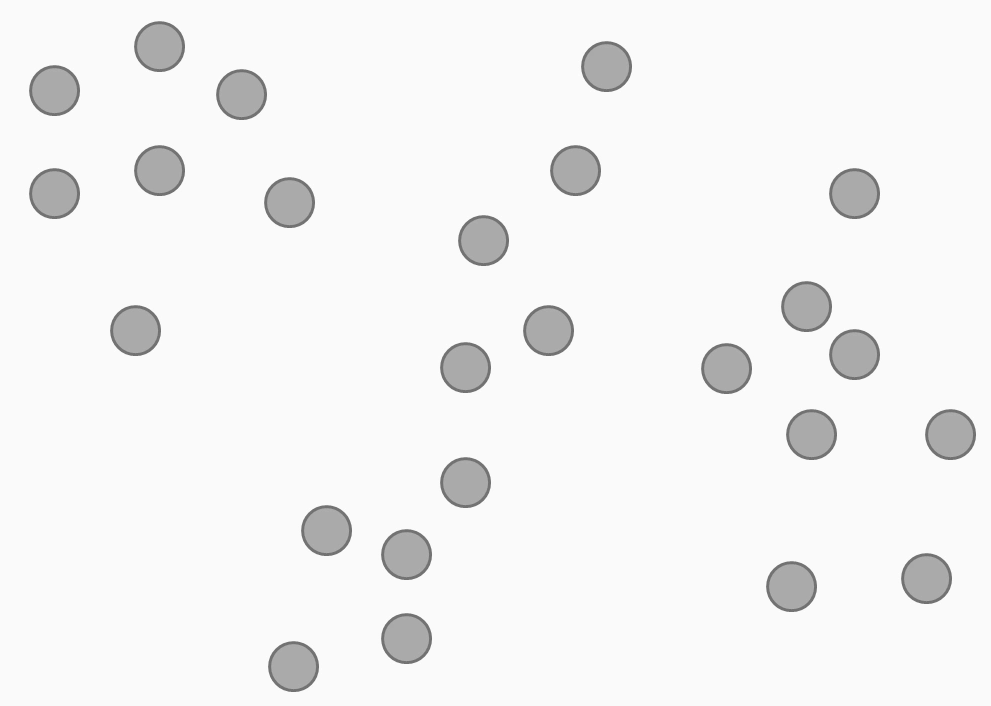
Of all the clustering methods mentioned in this chapter, spectral clustering may be the most opaque. Nevertheless, I will attempt to explain it. We start with a dataset, as shown in the following diagram:
Next, we compute the similarity between the points in the dataset, as seen here:
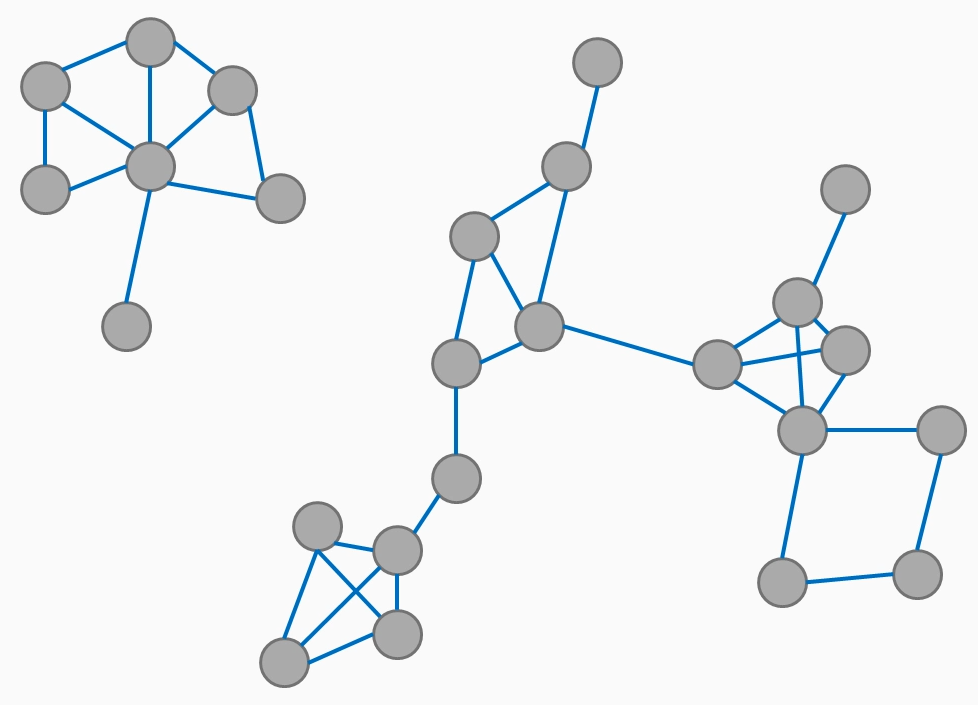
If the points are highly similar, we can infer that those points are connected:

These connections form something similar to a graph. Once we have the graph, we find connections to cut. Then, nodes that are connected belong to the same cluster. So, let's go ahead and see what spectral clustering does with the iris dataset.
We will import the SpectralClustering class and perform spectral clustering for this dataset.
We want three clusters. Spectral clustering uses radial basis function (RBF) similarity. I'm not going to explain what that is, but it's the default option. It's basically taking the distance between two points—the Euclidean distance between two points—and making that the exponent of the exponential function. So, we fit the model and then we plot it, using the following lines of code:

This results in the following output:

It comes up with clusters that look pretty similar to what we had earlier. Now, this is nice but, so far, our spectral clustering hasn't done anything that we haven't seen already.