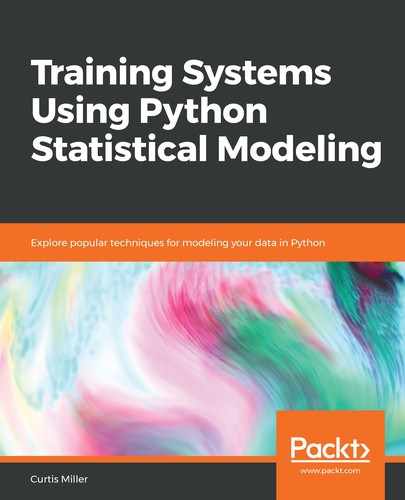
When we perform PCA, we will want to use fewer principal components than features in the dataset, but the question is—how many do we need? For that, we can create a plot where the x-axis represents how many principal components we use, and the y-axis represents how much variance in the dataset is not captured by that number of principal components, as shown here:
We are looking for an elbow in the plot, where, after using that many principal components, the reduction in unexplained variance starts to diminish.
Now, we will run a function that will create this plot for you. We will do so by using the following function:

So, let's run this function, and look at this plot for our dataset:
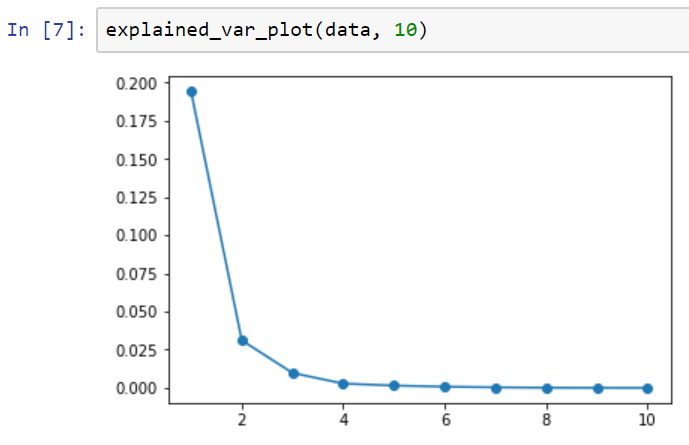
It seems that two principal components is actually a good choice for the Boston dataset. After that, the reduction in unexplained variance as a ratio of the total variance starts to decrease. So, we could actually do a lot of our learning using just the first two principal components, and have essentially captured all of the interesting variation in the dataset. Having discussed PCA, we will now move on to singular value decomposition (SVD)—a powerful matrix decomposition technique from linear algebra.