
This chapter covers the first item in the P.A.t.h. checklist, “P” for Persistence, and it shows how to assess performance health and how to interpret the resulting data to improve system performance.
The objectives of this chapter are:
- Know the biggest performance problem in Java server-side software and the two most common anti-patterns that cause it.
- Learn how to diagnose application performance problems caused by:
- Individual JDBC SQL queries
- Multiple JDBC SQL queries, regardless of how fast the individual queries run
- Learn how a small development database can lead to a false sense of performance security.
I believe there is wide agreement among a variety of performance experts that “too many database calls” is the worst performance defect in Java server-side software, but we continue to see systems with this problem, one that is almost prohibitively costly to fix (refactor all the SQL).
To help cement this opinion, I keep the following blog post up-to-date with various opinions on the matter:
This chapter shows how to detect the “too many database calls” problem in a running system—a system you can run on your own machine. It also shows how to find the problem just by looking at the source code, by looking for a few different performance anti-patterns. Finally, it quantifies the great performance boost you can get by fixing the problem.
The previous chapter described the two sets of run-on-your-own-machine performance examples that come with this book. The littleMock examples do not use a database, so this chapter’s examples come from the other set—jpt—which come with an H2 database (h2database.com). The jpt init.sh/init.cmd script populates the database with more than 2 million rows of data for a more realistic look at these issues.
Test 05: Performance Issues with One SQL
Test Results, captured from Glowroot:
- Test 05a: 3,500 requests per minute; 50ms response time.
- Test 05b: 14 requests per minute; 13,500ms response time
Metrics that you will need:
- Response time and throughput for all SQL statements executed
- A few tools that provide this data: Glowroot, JavaMelody, JDBC Performance Logger
With response time of more than 13 seconds, Test 05b is horribly slow, and throughput is very low. In fact, throughput is 250 times less than 05a, but why?
In the real world you will also need to check for issues in the other P.A.t.h. items as well, but since this is the Persistence chapter, let’s jump right into the SQL metrics to see what’s causing this 13.5 second response time. The first task is to identify the queries with the slowest response time, especially ones that get executed a lot. Then, we will see whether any obvious improvements can be made.
Figure 9-1 shows the one query whose performance is much slower than the other two: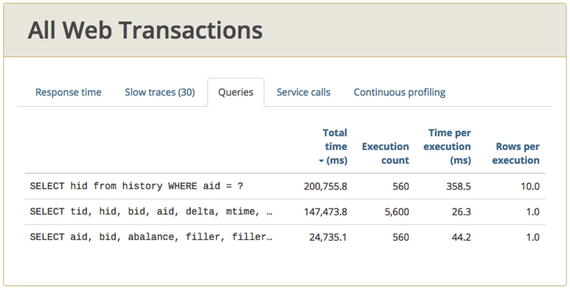
Figure 9-1.
For test 05a, throughput and response time for all SQL, provided by glowroot.org. The slowest query on the top row (358.5ms average) also happens to be the one with the most Total Time.
SELECT hid from history WHERE aid = ?
Because we’re trying to remedy 13.5 second response time, and because this query’s response time (358.5ms average, top row below) is more than 10 times slower than the other two queries, it is worth some time to investigate this query further. Even being just a few times
slower would merit some investigation.
In this query, there are no JOINS to other tables, the list of fields selected is very short (just the Hid column), and the WHERE criteria of WHERE aid = ? is trivial. The entire query is very basic. In fact, the other queries are pretty basic as well, and even for the same reasons. So why does the performance of these “basic” queries vary so greatly?
In many development shops, SQL tuning falls mainly on the (hopefully) capable shoulders of the DBA, and that’s an OK thing. But even if this is the case, and developers have little or no responsibility for performance of individual queries, I think developers need at least some rudimentary understanding of what’s required to make basic queries perform well, including basic queries in this example. More specifically
, developers need to:
- Notify the DBA when all changes to SQL are made, so the DBA can review it for performance in general, but specifically to assess whether any indexes must be added, changed, or removed to get your query to perform well.
- Know how to find out whether a SQL statement is using indexes. This is done by asking the database for the “execution plan” for the query. If the plan shows a “table scan,” then it’s likely your query isn’t using the right indexes and will have performance problems.
Of course, there are other problems that can cause performance issues, but all developers should know these basics. And as you might have guessed, Test 05b is so incredibly slow because that one slow query identified by Glowroot is querying a column in the HISTORY table that doesn’t have an index. Ouch. The 05a test (Figure 9-2) fixes that. This test uses a different version of the same database that includes the right index. Query
response time improved from 358.5ms without the index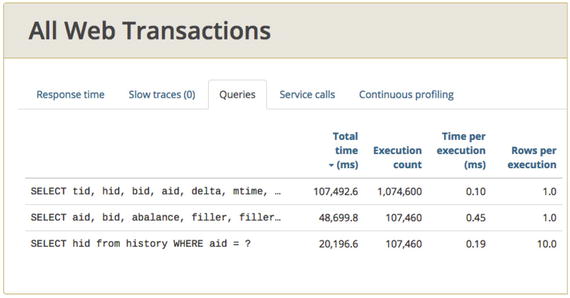
Figure 9-2.
With all db indexes now in place, response time for all queries is faster than 1ms
This blog page shows all the steps necessary for troubleshooting and fixing a performance problem with a missing H2 database index:
Retrieving and analyzing the execution plan is a similar process for other databases, but you’ll need to get help from your DBA or from the DB doc on the specifics. Is your DBA responsible for detecting problems, or does the DBA rely on dev to set tuning priorities? These are important things to decide, and good JDBC performance like those from glowroot.org are great for setting priorities for the dba.
Query response time is really composed of two
parts that we don’t discuss often enough when troubleshooting: execution and optionally, result-set iteration. Indexing issues like the problem in Figure 9-2 cause slowdowns in the first part—execution.
I just glanced back at the list of jpt performance results, Table 2-1 in Chapter 2. It shows that jpt test 04a includes an example of slow result-set iteration. If you run this example and capture some thread dumps, you will see the java.sql.ResultSet#next() method show up repeatedly, but it won’t show up repeatedly in other tests. This is how you detect problems with the second part of query performance—result-set iteration.
Thus far, we have focused on how the performance of individual queries can cause problems. The rest of this chapter is dedicated to the performance problems caused by multiple SQL statements acting in concert (bad acting in concert?), as part of a single database strategy
.
Performance Issues with Multiple SQL Statements
Near the beginning of Java Performance: The Definitive Guide (O’Reilly, 2104), Scott Oaks has a peculiar little section that is aptly named “Look Elsewhere: The Database Is Always the Bottleneck.” It is really just a page or two that cautions against blaming Java for all your performance woes, because database performance issues, regardless of the programming language, will very likely eclipse any vanilla Java performance issues. I generally agree; this is why most of the 12 jpt load tests that come with this book include database activity.
From the developer’s perspective, I see database performance as an effort to tame a two headed sea serpent:
- First head of the serpent: performance of individual queries, as shown by our missing index example.
- Second head of serpent: cumulative performance overhead of executing a group of SQL statements, like all SQL executed for one business process.
Many teams struggle to find and retain DBAs (or perhaps other staff) who can, in concert with the development team, keep the performance of individual queries under control. This is the first head of the serpent.
The second head is managing the performance of groups of queries from a single component, more simply described as the problem of “too many database calls.” This problem has gone largely unchecked by development teams, but a small, vocal group have warned about this problem for more than a decade. It still inflicts much pain, today. The blog post URL at the beginning of this chapter shows how long we have been living with this problem.
There are two main anti-patterns behind this “too many database calls” problem. Let’s look at the first, which is called the SELECT N+1 issue; it could easily have been called “SELECTs in a loop.”
The First Issue: SELECT N+1
Recognizing the SELECT N+1 in code is pretty straightforward. Just look for any SELECT executed in a loop, especially when the loop iterates through the result set of a different SELECT. In the example shown in Listing 9-1, for each iteration through the outer result set, one SELECT is executed.
ps = con.prepareStatement(
"SELECT hid from history "
+"WHERE aid = " + accountId); // outer SELECT
rs = ps.executeQuery();
while(rs.next()) { // start of loop
long hID = rs.getLong(1)
ps = connection.prepareStatement(
"SELECT tid, hid tid, hid, "
+"bid, aid, mtime from" // SELECT executed
+"HISTORY WHERE hid = ?"); // inside loop
ps.setLong(1, hID);
histRs = ps.executeQuery();
short count = 0;
Listing 9-1. Partial source code example of SELECT N+1 anti-pattern. For each row in the set of N items in the outer result set, an additional 1 query is executed. One way to refactor this is to join the outer and the inner table. Yes, the join is faster than the chatty behavior.
In this example, both the outer and the inner query hit the HISTORY table, but most times the outer and inner SELECTs
hit different tables that should probably be joined together.
But what does SELECT N+1 mean? Jeremy Bentch, a software architect from Portland, OR, described it to me this way: given a collection of N rows in a result set, do 1 additional query for each. N+1.
Here is another angle, aside from “Look for SELECTs in a loop.” Martin Fowler has written two books on the "Most Influential Book Every Programmer Should Read" list on stackoverflow.com; he is certainly an important voice. Way back in 2003, he wrote
"Try to pull back multiple rows at once. In particular, never do repeated queries on the same table to get multiple rows."
This is a great, succinct way to address this problem. But unfortunately, it still doesn’t quantify how bad the performance
problem is.
Five Variations of SELECT N+1 Load Tests
So to quantify the performance problem, I coded up five different variants of a SELECT N+1 issue and found that there was a dramatic performance difference between the five strategies, as shown in Figure 9-3.
Figure 9-3.
Chunky outperforms chatty. Strategy 5, the chattiest of the five, has the worst performance in this test. All the queries were very fast (∼20ms or less). Slower queries would certainly exaggerate this problem.
In Figure 9-3, strategy 2 had the best performance and strategy 5 had the worst—it has the most SQL executions. The fastest test, strategy 2, had the fewest SQL executions, with the exception of strategy 1, which I will come back to in a minute. Each strategy provides a different implementation of the exact same SOA service with this use case:
- Given 10 bank account numbers, return transaction history and balance info for all accounts. All five strategies must build the response data using exactly the same POJOs and the same XML serialization code.
The RDBMS schema in the H2 database is based on the performance-testing schema from Postgres
:
There is a simple one-to-many relationship utilized, in which each row in ACCOUNTS has a list of many records in the HISTORY table.
To make it easier to understand the strategies, I created a visualization that I call a “SQL Sequence Diagram.” As an introduction, Figure 9-4 shows just part of one of the strategies. The S in the top row represents the first SELECT statement executed. It p ulls data from one table—the ACCOU NTS table. The row below it represents the second SELECT statement which pulls data from the HISTORY table. Actually, each row just shows FROM clause tables. The SELECT list (of column names) is not represented at all.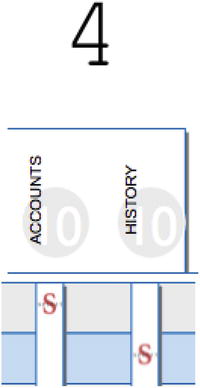
Figure 9-4.
A SQL Sequence diagram that helps understand whether the code has repeatedly queried the same table. Per Martin Fowler, a single request should access each table no more than once.
Figure 9-4 shows the FROM clauses from the first two SELECTs for strategy 4. There is a SELECT to the ACCOUNTS table, then
a SELECT to the HISTORY table.
When I ran the code, I submitted 10 accounts for inquiry, and sure enough, the same two SELECT statements in this little diagram are executed 10 times each.
Figure 9-5 shows the full list (where possible—strategy 5 didn’t fit) of SELECT statements for each strategy. Note that we can easily see how many times each strategy has gone back to the same table; data represents all SQL executed during a single round trip to the server.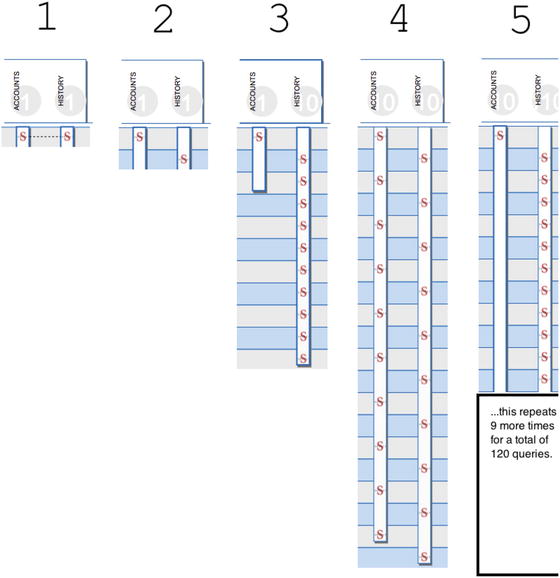
Figure 9-5.
A single SQL sequence diagram for each of the five database strategies. Strategy 5 is the chattiest and performs the worst, per data in Figure 9-3. Per the same data, strategy 2 performs the best. Strategy 1 is the chunkiest, but doesn’t perform well because the join results in more rows/results than necessary.
Strategies 1 and 2 abide by Fowler’s
direction—they never do repeated queries on the same table—they access each table just one time. Strategy 3, on the other hand, follows Fowler's advice for the ACCCOUNTS table, but not for the HISTORY table. Strategies 4 and 5 are super chatty, revisiting both tables multiple times—Fowler is unhappy.
Table 9-1 shows my rough characterization of each strategy. See if you can match each characterization in the table with each strategy’s depiction in Figure 9-5. Also think about which strategy most resembles your coding style.
Table 9-1.
The Five Database Strategies
Strategy | Characterization | Count of SELECT statements |
|---|---|---|
1 | With a single execution of a query, SELECT all rows from ACCOUNTS, joined to the HISTORY table. | 1 |
2 | SELECT all 10 accounts in a single SELECT to the ACCOUNTS table and SELECT all 200 HISTORY records from a single SELECT to the history table. | 2 |
3 | SELECT all 10 accounts in a single SELECT to the ACCOUNTS table, just as in strategy 2. But make 10 separate queries, each gathering HISTORY data for a single account. | 11 |
4 | For a single account, make two SELECTs: one for account data, and one for HISTORY records. Repeat for the remaining nine accounts. | 20 |
5 | For each account, make a single SELECT to retrieve ACCOUNTS data and make 11 queries to get HISTORY data. | 120 |
Of all five strategies, which do you think most resembles what developers use most? My personal bet is strategy 4, because that is just the style of coding that I have been around, where one account component retrieves all data for that account, history data included. When data for multiple accounts is required, a “reuse” victory is tallied, and the component is invoked an additional time for each subsequent account. Well, the reuse victory is bittersweet, at best, if performance suffers because of an increased number of database calls, as is the case of strategies
3, 4, and 5 in Figure 9-4.
Chunky Outperforms Chatty
Ultimately, the two extremes are “chatty” and “chunky.” Chatty has many executions
and small result sets—often just a single record. The “Chunky” approach
has fewer executions and bigger result sets. But just to be clear, this thing about “large results sets are OK” does not mean you can cavalierly pull back more data than necessary and discard the rest (anti-pattern #3 from Chapter 1, Overprocessing). For example, it would be really inefficient to retrieve 1000 rows and return only the first (or second or fifth) page of 100 to the end user and discard the rest. So, craft your WHERE clause to retrieve just what you need.
If you would like a more detailed look at the code to better understand the strategies, see the com.github.eostermueller.perfSandbox.dataaccess packages here:
Remember, chunky outperforms chatty, and not just with executing SQL statements. Chatty anti-patterns often cause problems with NoSQL databases, flat file reads, and even with HTTP or other network requests to backend systems.
Chunky Doesn’t Always Perform Well
When I first coded these examples, strategy 1 had the best throughput, not strategy 2. But then I wondered whether adding a handful of columns to the ACCOUNTS table to model a more fully fleshed out master ACCOUNTS record would hurt performance. It did. The low throughput of strategy 1 was caused when I added 20 columns, 84 bytes each to the ACCOUNTS table. Don’t forget that because the tables are joined, all SELECTed ACCOUNTS columns will get repeated (bad → big inefficiency) for each row in the HISTORY table.
Detecting SELECT N+1
Test results:
- Test 07a: ∼18,000 requests per minute (strategy 4).
- Test 07b: ∼26,000 requests per minute (strategy 2)
HINT: To explore how the other three strategies (1, 3 and 5) perform, open src/test/jmeter/07a.jmx in JMeter, change the SCENARIO_NUM JMeter variable to 1, 2, 3, 4 or 5, and then re-run test 07a.
Metrics that you will need:
- Total Time and Execution count for each SQL statement
- A few tools that provide this data: Glowroot, JavaMelody, JDBC Performance Logger
When troubleshooting the missing index at the beginning of this chapter, we saw that the problem query’s response time was more than 10 times slower than the other queries that were of similar complexity. That “10 times slower” is a bit of a smoking gun. If not a smoking gun, it was at least “lowest hanging fruit” that directs and motivates your research.
Take a look at the Glowroot Queries data for load test 07a in Figure 9-6. Do you see any smoking gun? This screenshot shows two minutes of data after the throughput had leveled out—my version of warmup.
.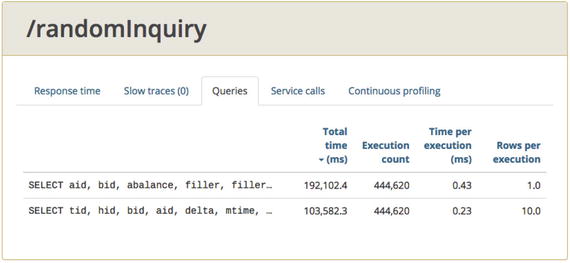
Figure 9-6.
Glowroot Queries tab for test 07a. Individual executions seems fast. Execution count seems high, but how high is a problem?
Average time per execution is very fast—less than 1ms for both queries (0.43 and 0.23), so no obvious problem there
The Execution Count
and the Total Time values
seem high, but how high is too high for these values? If you run the 07b test (strategy 2) and look at the same screen, the execution count and the Total time are lower, but there is still no guidance on what measurements/thresholds indicate a problem. The Total Time (ms) metric is roughly the “average time per SQL” multiplied by the count of invocations—it’s how long the JVM has spent executing this query.
As such, I recommend the following:
- 1.Take a close look at the 2–3 queries with the highest total time and the highest execution count.
- 2.Find out what code executes these queries and look for the SELECT N+1 issue as well as the other performance issue with multiple SQL statements that we’ll cover in the next section.
- 3.It is also helpful to compare the Glowroot Execution Count in Figure 9-6 to the load generator throughput for the same time period. This is a much more meaningful comparison when you disable all business processes in your load script except the one with questionable SQL performance. Use Fowler's rule as a guide.
- 4.Fix and retest.
The Second Issue: Uncached SELECTS to Static Data
Test results:
- Test 03a: 14,000 requests per minute
- Test 07b: 10,400 requests per minute
Metrics that you will need:
- Total Time and Execution count for each SQL statement.
- A few tools that provide this data: Glowroot, JavaMelody, JDBC Performance Logger
Load test 03b is a lot slower than load test 03a, but why? To find out more, look at the Glowroot Queries page for 03b in Figure 9-7.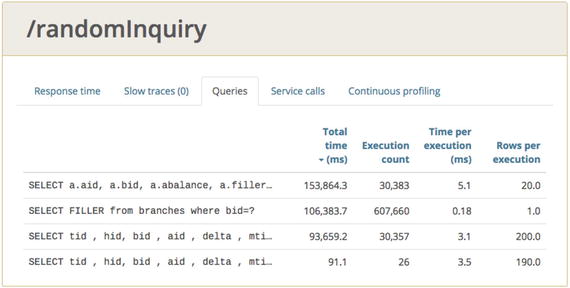
Figure 9-7.
Glowroot query panel for test 03b
Just as with the SELECT N+1 issue in test 07, there are no obvious slowdowns in the Time per Execution column, as there were in test 05 with the missing index. The response times of 5.1, 0.18, and 3.1ms are all very quick compared to the 358.5ms for the unindexed query. So this means the DBAs did their job and there are no issues with individual queries—the first head of the serpent.
On the surface, this looks very similar to the SELECT N+1, but there is one key difference—the ACCOUNTS and HISTORY tables from previous examples hold live data that could change at any second, and the BRANCHES table does not. Theoretically, that data holds static data that changes less than once a day—probably less than once a week. Here are the types of things that a branch table might hold: Branch Name and Street address, City, State, Postal Code, and so on. Since this data changes so rarely, caching it in RAM could really boost performance.
I can imagine good reasons to be hesitant about using a cache, because operating on slightly stale data from a cache might cause problems. Say that a disgruntled employee needs to be immediately locked out of your system. You don’t want an out-of-date cache of user
permissions to mistakenly allow entry. But we can have our cake and eat it too. We can use caches to make these user permissions perform better and we can also evict those caches on demand when it is critical that they are up-to-date. This link shows one example:
To avoid so many executions, the branch lookup code in the fast test (the a test) only occasionally incurs the overhead of the round trip to the database—just occasionally. The rest of the time, it pulls the results from an in-memory, hash table-like singleton—a cache—provided by
http://www.ehcache.org/
.
In the jpt repository at
https://github.com/eostermueller/javaPerformanceTroubleshooting
, look for this configuration file:
warProject/src/main/resources/ehcache.xml.
This controls how frequently the cache is emptied (aka, evicted), thus occasionally forcing your code to get fresh results using a full database round trip. By contrast, the code in the slow test incurs the overhead of the round trip for every single request. Take a minute to look at the slow and fast versions of the code in this package in the jpt repository:
com.github.eostermueller.perfSandbox.cache
Figure 9-8, from the 03a test, shows the proof in the pudding. Now that the cache is in place, see how few queries there are to the BRANCHES table, as compared to the other three queries? There are just 25 in 2 minutes, compared to 35k-ish invocations of the other queries.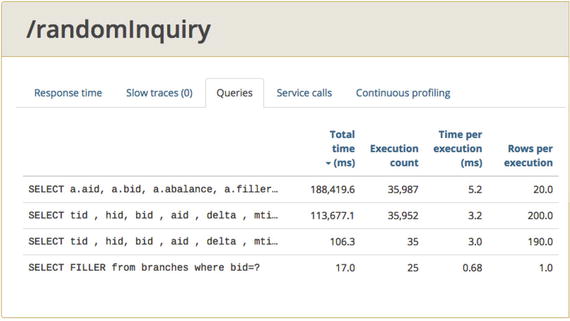
Figure 9-8.
EHCache has minimized the count of queries to the BRANCH table. See, just 25 in 2 minutes!
I can understand why you might think the throughput is so high in some of these examples that any lessons learned would not apply to smaller loads. That is almost a fair criticism; I think that the artificially fast query response times in my examples make up for that. With more realistic, slower DB queries seen in production environments, all the
problems I’ve highlighted in this chapter are significantly worse.
JPA and Hibernate
JPA, the Java Persistence API standard
, and widely used implementations like Hibernate (hibernate.org) and MyBatis (mybatis.org) are in common use today. JDBC still executes under the covers, but the minutiae of JDBC and the drudgery of moving ResultSet data into Java objects is much easier.
JPA is out of scope for this small book. If you’d like to learn more about JPA performance, consider the 2016 book High Performance Java Persistence by Vlad Mihalcea (self-published).
But a brief suggestion can be helpful:
- Spend the time to make sure your JPA code abides by Martin Fowler’s rule: “never do repeated queries on the same table” for a single server-side request.
JPA provides a very helpful way to apply common approaches to JDBC access across a large code base. That is a good thing. However, I generally find the developers using JPA are so abstracted from knowing this size, shape, and count of SQL queries that execute under the covers, that performance is suffers. Hibernate is very capable of proliferating the SELECT N+1 anti-pattern; be sure to flag it as a problem at your next code review—perhaps using glowroot.org.
The following post will help you do that, especially the part about avoiding Hibernate’s “Batch-size=N” fetching strategy.
Don’t Forget
From a high level, it seems that the lack of good, freely available SQL performance tools like Glowroot has kept this “too many database calls” problem from being addressed—that’s why this is the second head of the nasty persistence dragon, which Java developers always seem to miss. Even super-fast queries can drag down performance if your code executes them enough times.
There are other promising open source tools available, like Glowroot.org, that provide similar JDBC metrics:
We have been writing chatty code for more than a decade. Perhaps the new visibility provided by these more mature monitoring options will make it easier to implement chunky database access strategies that perform significantly better. When an application has a long history of too many db calls, it's really tough to change the culture. Setting good standards early on in a project seems like a promising start. Trying to keep SQL counts low without good metrics seems impossible. Work towards getting team-wide adoption of a good tool for SQL metrics.
It is worth mentioning one more time that the results of the chunky vs. chatty tests are skewed because of my smoking fast database. In the real world, chatty strategies coupled with poor individual query response time are a perfect storm waiting to happen.
What’s Next
This chapter covered the first item in the P.A.t.h. checklist. Chapter 10 looks at troubleshooting the performance of all the back-end systems that your JVM connects to, referred to as Alien Systems. There is one important optimization discussed that almost every system needs—the chapter has a nice test on how much benefit it can provide, but it also highlights important security concerns that are frequently overlooked when implementing this optimization: data compression.