
Performance tuning can get pretty complex; just think about all the various places in an environment that could have performance problems:
- The configuration of your container (WebSphere or Spring Boot or whatever)
- The network
- The operating system
- The hardware
- The load generator
Don’t let all of this overwhelm you. To minimize the complexity of it all, we developers should first focus on the performance of the part we’re responsible for—the code. This is the Code First approach. A healthy percentage of performance defects are write-once-run-anywhere issues that will thrive, regardless of the environment.
The objective of this chapter is:
- Learn about a half dozen things to check to make sure your load test is generating a healthy, production-like load.
This chapter highlights environmental and other performance problems that invalidate the results of the load test you’ve worked so hard to create. Getting around some of these invalid tests (which are often caused by environment issues) requires a bit of creativity; let’s have a look.
Network Issues
In chapter 2, I gave you this list of things that contribute to network performance:
- Firewalls
- Bandwidth limitation software (like NetLimiter) that runs as a security measure
- The HTTP proxy server, if accessing the Internet.
- The hardware—routers, content switches, CAT5, and so on
- Load balancers, especially their configuration to manage concurrency
Any time one or more of these cause a performance problem, your load test is invalid and the results need to be thrown away. Rarely do we have the tools, access or expertise to troubleshoot network problems, so why do we bother in the first place? I recommend designing tests to eliminate network hops, when possible. Integration tests and other larger environments are fine places to finally learn about full network performance.
Sometimes I get painted into a corner and I’m forced to use a particular network segment that I suspect of having problems. If like me you don’t have the tools or expertise (or access) to solve a network performance there is one option: indirect measurement. Say you suspect a particular network segment to have issues. If you apply load to a static web page, one known to be fast, and the response time end up being really poor, then you have an issue.
Container Issues
One of the reasons I am qualified to write a book on performance is that I have wasted so many hours of my life messing up the configuration for JDBC connection pools and web container thread pools.
One upside of these pools, and there really are many upsides, is that they can keep the OS or database from seizing up if your Java app goes haywire for some reason. The pool does this by capping the count of threads or connections to the max value set in the configuration. But if the caps are configured too low, the pools will limit performance. Knowing whether the caps are set too low should be an ongoing concern for you.
Keeping your eye on the right monitoring will show whether the caps have sprung into action at an inopportune time, robbing your system of precious throughput. But believe me I know, that takes a ton of work and steals your attention away from the primary focus (Code First). A simple guideline helps avoid all of this:
- “Raise resource caps before tuning and lower them before production.”
Yes, I’m a bit jealous that way back in 2006, Steven Haines first suggested this idea of raising all the caps in his book Pro Java EE 5 Performance Management and Optimization (Apress, 2006):
You can also find this suggestion in this online article of his:
But I think I’ve phrased it more succinctly, so you’ll be more likely to remember it.
When I say raise these caps, I mean raise them very high, like a value of 1999 for both max threads and max connections in the JDBC connection pool.
An example will help here, I think.
The graph in Figure 5-1 shows the number of concurrent users, over time, that will run in a JMeter load test against the littleMock server configured with an 8-second sleep time. littleMock is a small Java server-side test application that we will talk more about in Chapter 8. Here is the URL:
https://github.com/eostermueller/littleMock
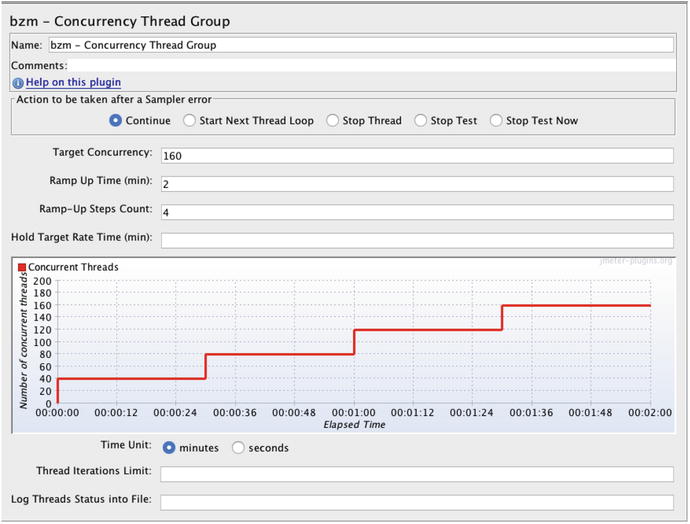
Figure 5-1.
Configuration for an incremental load test that shows the plan for applying load in a test. This thread group is a plugin for JMeter, downloadable from
https://jmeter-plugins.org/wiki/ConcurrencyThreadGroup/
.
The stair-stepped “ramp up” is the hallmark of an incremental load test, a test performance engineers have been using for many years. Each “step” adds 40 threads of load. At the one minute
and 30 seconds into the test, all 160 users will be up and running. Got it?
Figure 5-1 shows what is referred to as a load plan, and I ran it two times. The first time, I used the configuration shown here. Just seconds after the first test finished, I changed the Target Concurrency from 160 to 240 and ran it again. So instead of 160/4=40 threads per step, the second test had 240/4=60 threads per step.
All that configuration is on the load generator side, aka the client side. To check out the number of threads on the server-side (the count of active threads is called the concurrency
), in Figure 5-2 I used Glowroot, an open source APM tool from glowroot.org.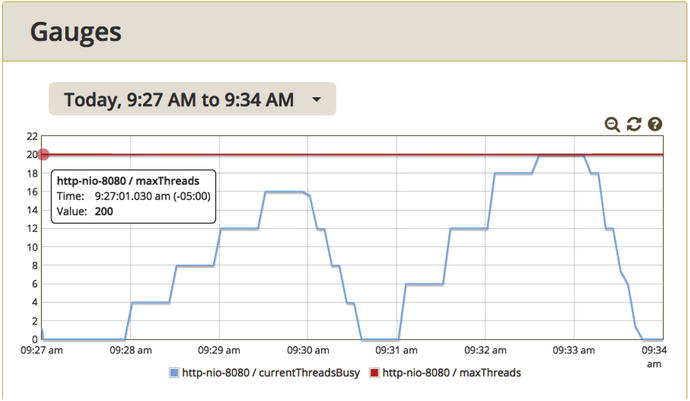
Figure 5-2.
Server-side concurrency during two back-to-back incremental load tests. In the test on the left, the load generator ran 160 threads and all 160 show up here. The test on the right ran 240 threads, but a little before 9:33am, the tomcat max threads setting in Spring Boot capped concurrency to 200.
Note
Figure 5-2 talks about concurrency values roughly from 0 to 200, but the vertical axis shows just 0 to 20, why the discrepancy? The roundtangle in the upper left shows that the actual value of maxThreads is 200. Glowroot “auto-scaled” the vertical axis and ended up with 0-20.
Avoiding this cap problem
in the test on the right would have been simple, had I followed the recommendation to “raise caps before tuning, lower them before production.” Since the SUT is littleMock, which runs under Spring Boot and Tomcat, I could have easily added this property:
server.tomcat.max-threads=1999
to the application.properties file, as documented here:
Don’t forget to do the same for JDBC connection pool settings. Most importantly, before you move the app into production, you need to lower the caps to avoid the seizing/haywire case I mentioned earlier. How much lower? Lower them to a point that is about 25% above the number of threads or connections you will use in production. For example, if your load tests show (using the metrics in Figure 5-2) that you will use no more than 240 threads in production, set the cap to 300 (1.25×240).
So load tests that bump into resource caps
are invalid tests, but now you know how to easily avoid this problem: raise resource caps before tuning and lower them before production.
Insufficient Warmup
Performance engineers could argue without end about the right amount of time required to warm up a system before running a steady-state load test. 5 minutes? 15 minutes? For me, every system is different. I warm up a system until its metrics stabilize for a few minutes. If metrics never stabilize, then the length of the warmup is irrelevant. In that case, one thing I do is simplify the load scripts to isolate which part of the workload contributes most to the chaos.
So, if you are making performance assessments before metrics like response time and throughput stabilize, you are looking at an invalid test.
Maxed-Out Hardware Resources
It should go without saying that it is your job to make sure there is enough CPU/RAM on your systems when you test. Keep in mind that it is easy to forget to check. It is also helpful to look at the two main subdivisions of CPU. Kernel CPU (aka system CPU) is the percentage of CPU used by the operating system. User CPU is the percentage of CPU used by our Java and other applications, including the database. Some people think that 0% kernel CPU is achievable. That would be grand, but I sure don’t know how to make that happen. Generally, if kernel CPU is 10% or less than the user CPU, there are no issues. So if user CPU is 75%, then 7.5% or less of kernel does not raise any red flags. When kernel CPU is much more than this, it’s time to get a system admin involved—because this load test is probably invalid. When working in virtualized environments, sometimes adding a CPU or two can fix this.
Capturing metrics from remote systems is much easier these days. Having those metrics graphed right there in your load generator is a great gentle reminder to pay attention to them. PerfMon will do that for you. It is the tool we used in Chapter 2 to graph CPU of individual PIDs. Here is the link again:
The JMeter plugin Composite Graph will even display CPU (and other environment metrics) on the exact same graph as JMeter metrics, like response time and throughput.
When your test eats up all the CPU/RAM, you have a few choices. Either add more CPU/RAM, or use the P.A.t.h. Checklist to lower consumption. That discussion begins in Chapter 8.
By now, you have probably
figured out there is some overlap in my approaches. In Chapter 3, of the three types of metrics, one type is for understanding resource consumption. In this chapter, I’m saying too much consumption makes a test invalid. There are no subtle differences between these two—just two reminders to have your eye on consumption.
The same thing goes for functional errors in load tests. I mentioned these in Chapter 4 on load scripts and again here, when talking about invalid tests. I believe the message is warranted in both places, but I wanted to make sure you know these are two references to the same issue.
Virtualization Issues
I love the idea of virtualization—being able to create a new “guest” machine (for load testing, of course) whenever I need one. But the performance metrics for the “parent” VM that runs the whole show are often off-limits for mere mortals like me. How can you know whether the guest is healthy if you don’t have access to the metrics?
Gil Tene of Azul Systems (
https://www.azul.com/
) has the answer. He wrote a little Java utility called jHiccup
. The tool is based on an interesting question: If you schedule a thread to sleep for a specific number of milliseconds, will that thread wake up on time if the entire operating system is experiencing pauses or hiccups? The answer is no, the thread will not wake up on time, and jHiccup measures the differences between expected and actual wake times for threads.
Look at this URL for the latest releases of jHiccup:
and the home page is here:
Download and unzip the release zip file to a new folder. Then cd to the same folder as jHiccup.jar and execute the following:
java -javaagent:jHiccup.jar="-d 4000" org.jhiccup.Idle -t 30000
The console will appear to hang for 30 seconds (the -t parameter). When it finishes, it will have created a file like Figure 5-3; this will be located in the current folder and named like this: hiccup.170709.1303.20680.hlog.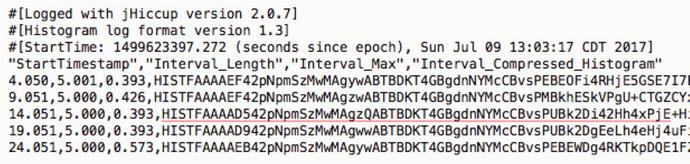
Figure 5-3.
Output from jHiccup
. The third column, Interval_Max shows the maximum time in milliseconds over the last 5 second interval (second column) that your OS was paused. The last measurement of 0.573ms is the largest pause in 30 seconds.
In the Introduction, I mentioned the need for “plug-it-in-now” tools so we can more quickly diagnose and fix performance issues. jHiccup is a great example of that. Yes, you do have to download a jar file, but outside of that it is easy. You don’t need security/access for the parent VM. You don’t need to restart any programs to capture the metrics.
Getting more detailed metrics, like actual pause times instead of just the Interval_Max ones, takes a bit more work (using jHiccupLogProcessor). But that work is only necessary if the max times show concern. Personally, I’d be concerned if the parent VM regularly paused my guest for more than 2% of the time. So if any of those Interval_Max times regularly move from the current 0.573 in Figure 5-3 to 100 or more, then I’d be concerned (100ms / 5000 interval = 2%) and I’d do two things:
- 1.Research how to use jHiccupLogProcessor to get and graph the detailed data instead of just the max values above.
- 2.Pass along my findings to the administrator of the VM parent, the one who has access to all the performance metrics.
jHiccup measurements are also sensitive to garbage collection (GC) pauses. Chapter 12 will talk more about the tools used for assessing GC health, but if you need a second opinion that GC pauses are slowing things down, jHiccup is your tool. My example, above, plugs jHiccup into a do-nothing program named org.jhiccup.Idle. You will need to seek out the alternate syntax for to plug jHiccup into the JVM whose metrics you’re questioning.
The point of this story is that unhealthy virtualization infrastructure is yet another cause of an invalid load test, whose results really need to be discarded.
Generally, I would only spend the time collecting jHiccup data if no explanations on the table (or in the P.A.t.h. Checklist) could explain a particular performance problem.
Wrong Workload Issues
The section delves into a little more detail on the Performance Anti-Pattern Number 3:
- Overprocessing: The system is doing unnecessary work and removing that work provides measurable performance benefit. One example is retrieving too much data, where most of the data is discarded. Another example is including in your load test the wrong resource-hungry use case—one that is seldom used in production.
I am very thankful for developers who take the time to create both data and tests for an application’s complicated edge cases. Thank you. We need exactly these kinds of tests, these reminders, to show the functionality we expect from the system.
All that said, it is a waste of time to pummel your system with edge cases (and try to tune them) if just a slow trickle of such cases will ever traverse your production system. Often, these edge cases rear their heads unexpectedly. Once, after performance on a system degraded unexpectedly and severely, I scoured the source code control system for any unexpected code or other changes. No obvious problems there.
After ten painfully unfruitful days of troubleshooting, we re-evaluated the load generation scripts for some of these pesky edge cases and we discovered one anomaly. The problem was not with the functionality we included in our load generation script (which is indeed something to watch out for), it was with the data.
What we found was that the average number of bytes for one of the HTTP responses (as shown by the load generator) was about 10 times larger than the rest. Why was one so much larger than the others? It turned out that a setting on our backend SUT was inadvertently changed and it started returning HTTP inquiry results for many hundreds of inactive (and unexpected) accounts, as well as the expected active ones. Oops. Sanity-checking the average sizes (in bytes) of the various parts of your load script is important for finding inefficiencies, so I also mentioned this in the chapter on Metrics—there is a nice screenshot there (Figure 3-1) if you need some detail to get the full picture.
The moral of the story is that edge cases show up not just in the functionality you choose to include in your load script, but also in your system’s data and in other places. For example, performance almost always suffers when too much logging (like log4j) is turned on, and having so much logging could also be considered one of these edge cases. Sometimes the problem is you. You find performance defects, you deploy code, and you run some load tests and then run even more load tests until you have run the “add widget” use case 100 million times. If these repeated load tests make the count of records in the database very unrealistically high, then you, the load generator, are the problem. Problems can come from the funniest places.
So, take some time to understand
the various types of traffic in your production workload. If you are not really sure about the load of each business process, how will you know what functionality should be in your load test? For example, if fewer than 1% of your account deposit traffic includes more than 10 items (checks, cash), it is a waste of time to hammer the system with deposits with thousands of checks from that one remaining pizza joint in town that still accepts checks. I bet they listen to 8-track tapes, as well.
There are a few angles here:
- Don’t waste time tuning use cases that are seldom used.
- Validate that the main use cases in production are also in your load script. If you think you know which use cases are there, what data do you have to convince others?
A large percentage of performance defects that you would normally find in production can be found even when running a single business process with a few threads of load (like 3t0tt), without any of the other business processes in the system. So I consider a “single business process” load to be a “valid” test, even though it does not contain all the business processes in the production workload.
Of course there will be occasional issues where you can only reproduce a performance defect when two particular business processes run in the same workload—consider two processes that read/write to the same rows in a RDBMS table, like “Check order status” and “Update order status.” Many applications use tables to monitor the state of a process in a workflow. These situations must also be load-tested together.
Lastly, I’d like to close this section on “Wrong Workload Issues” by mentioning a few other types of processing to watch out for. Sometimes when you are load-testing on a machine, that machine is not 100% “yours.” Automated installs run in the background, backup jobs kick off unexpectedly, and who knows when virus scanners kick in.
If you suspect any of these, don’t settle for traditional CPU metrics that show just CPU or CPU-Core level CPU consumption. Instead, take the time to find and graph the CPU consumption of each PID using PerfMon, as we did in Chapter 2 for the modest tuning environment.
Load Script Errors
When performance tuning, you are always rubbing shoulders with some interesting problems (my wife says that I am an interesting problem). Why is performance worse when nothing (seems to have) changed? Why do these two metrics contradict each other? Likewise, you have got to pack a lunch when trying to find the cause of a full catastrophic failure, when a JVM process dies—so that is kind of fun too. Jumping onto a sweaty wrestling mat with these kinds of problems is my kind of fun. But it is much less enjoyable to be bogged down with mundane, functional failures.
In fact, there is so little joy that ignoring functional errors, unfortunately, comes second nature to me. I often say to myself, “I didn’t see any errors when recording the load generation script, so how could there be a problem when I’m replaying that same script?”
Several years ago, we were struggling
to find out why performance was so horrible. I was refactoring a load script to read usernames and passwords (they were test passwords. honest, they really were) from a .csv file so that my load generator script would not log on to the SUT with the exact same user for every thread. We wanted to know whether the SQL caching code was working (and performing well). After I refactored the script, the load test successfully logged on hundreds of users (or so I thought) and response time was blazingly fast and throughput doubled (or did it triple?). I announced the great results to the team and a celebration ensued.
But what actually happened was that I forgot to put the right two-character prefix on the users’ IDs in my newly-created .csv data file, so zero of my users even logged on successfully, and zero of the business processes I had scripted were getting put through their paces. When I corrected the user names in the data file (duh), our original crappy performance was fully restored. Yeah! Performance testing is littered with bittersweet, dubious victories like this. As such, I had been load testing a lot of SUT failure, which is certainly not a priority in our Grand Focus.
So please learn from my mistakes, spend the time to enhance your load scripts to not only check for functional errors in each HTTP or other SUT response, but also make sure that the correct response is present. I will repeat this because it is very important: Your load script must check for the absence of common errors, (“exception” and “error” and other error message text) as well as the presence of the expected results, like an account balance on an inquiry, or a generated unique ID when creating an order. Richard Feynman once said “The first principle is that you must not fool yourself—and you are the easiest person to fool.”
Make skepticism in the performance results a team sport that will build team confidence in the whole tuning process. Error counts should get first-class billing, right alongside throughput and other metrics.
A reviewer once wrote the following about the Pixar animated movie “Wall-E”:
“These robots, beings not usually considered to have emotions … must convince the audience of their souls and personalities.”
As performance engineers, it is our job to convince our audience (our dev/QA team and our client) that the load test is real, that the load test inflicts stress on the SUT very much like the stress in production. Why? So the team will be motivated to fix any performance problems that arise. Sometimes, I am so skeptical of load test results (really, just afraid of all the embarrassment) that I will count the rows in important SUT RDBMS tables. Generally, I pick the largest ones that change the most. I will then make sure that before-test and after-test table counts jibe with the throughput results from the load generator. For example, say that the load generator reported that ten “Create new account” processes executed every second of a 300 second test. After the test, I would then make darn well sure that the account table contained about 3,000 more records than it did before the test started.
You might think that these kinds of errors from the SUT can be detected and managed by getting the load generator to log the full HTTP request and response for all threads. I know I did, at one time. Chapter 7 shows that too much load generator logging kills load generator performance and skews the results of the entire test
. This much verbosity is invaluable for troubleshooting problems with playback of a single thread, but gets in the way otherwise.
When your load generator is tallying test results, separating the wheat from the chaff, the success from the failure, most load generators provide a way for us specify what SUT responses indicate an error. I strongly encourage use of both techniques to flag errors. Chapter 7 will show you how to
- Flag errors because an important part of an HTML response (like an account balance on a balance inquiry) is missing.
- Flag errors when text for an exception shows up in an HTML response.
- Provide high-level overview of how many errors show up and when.
How much validation to add is up to you. I hope the earlier vignette shows the problems with too little validation that happen all too frequently. But adding too much validation takes up time that could be spent optimizing code. Too much validation can also cause load generator performance to degrade. For instance, validating 20 different data items on a single page is probably overkill for a performance test (but reasonable for a functional test). I’ve had no problems with load generator overhead while validating 3-5 data items per HTTP response while running 1,000 requests per second, generating load from a single, modern desktop-class machine. If you have overwhelmed the CPU/RAM of a load generator at this volume, then that is a problem worth your time to fix.
When a load test applies 3t0tt, it is applying three threads of load with zero think time. In my experience, this is more than enough load to flush out most errors in multi-threaded code. The classic signature of this kind of a problem is a small but steady flow of errors. If your tests have regularly have garden variety functional errors, your ability to detect multi-threaded errors will be diminished or gone altogether. Aim for zero errors in your load tests.
Don’t Forget
Imagine a college entrance exam that was printed in a font so small that the test takers, even with young eyes, were squinting at their desks for the duration and could not really read the tiny print. We would call that an invalid test, and no one in their right mind would even look at the students’ results, much less make life-changing college entrance decisions based on them. The lesson here is this: discard the results of invalid tests.
Likewise, before making decisions based on the results of a load test, you must first assess whether a test is valid, whether it approximates the conditions in your production environment closely enough. This chapter explored a number of criteria that, in my experience, make a test invalid. The validity of every single performance test should be carefully assessed before acting upon its results.
What’s Next
Does your system scale? When was the last time you checked? Chapter 6 provides a specific and novel formula for testing scalability. It is so easy to follow, you can measure for scalability every day of the week, to help keep performance angst at bay. The test is called the Scalability Yardstick
.