Activity diagrams are a technique to describe procedural logic, business process, and work flow. In many ways, they play a role similar to flowcharts, but the principal difference between them and flowchart notation is that they support parallel behavior.
Activity diagrams have seen some of the biggest changes over the versions of the UML, so they have, not surprisingly, been significantly extended and altered again for UML 2. In UML 1, activity diagrams were seen as special cases of state diagrams. This caused a lot of problems for people modeling work flows, which activity diagrams are well suited for. In UML 2, that tie was removed.
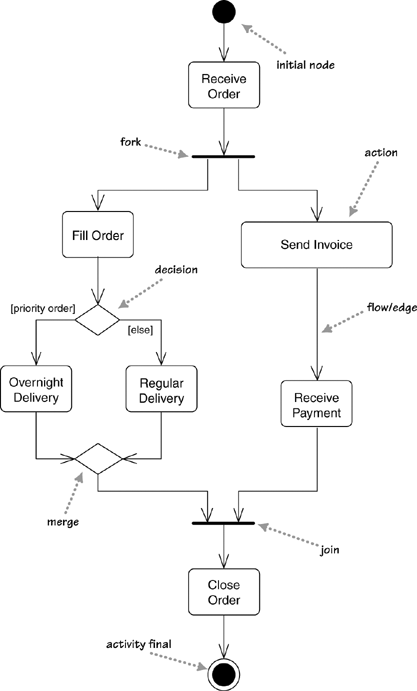
Figure 11.1 shows a simple example of an activity diagram. We begin at the initial node action and then do the action Receive Order. Once that is done, we encounter a fork. A fork has one incoming flow and several outgoing concurrent flows.
Figure 11.1 says that Fill Order, Send Invoice, and the subsequent actions occur in parallel. Essentially, this means that the sequence between them is irrelevant. I could fill the order, send the invoice, deliver, and then receive payment; or, I could send the invoice, receive the payment, fill the order, and then deliver: You get the picture.
I can also do these actions by interleaving. I grab the first line item from stores, type up the invoice, grab the second line item, put the invoice in an envelope, and so forth. Or, I could do some of this simultaneously: type up the invoice with one hand while I reach into my stores with another. Any of these sequences is correct, according to the diagram.
The activity diagram allows whoever is doing the process to choose the order in which to do things. In other words, the diagram merely states the essential sequencing rules I have to follow. This is important for business modeling because processes often occur in parallel. It’s also useful for concurrent algorithms, in which independent threads can do things in parallel.
When you have parallelism, you’ll need to synchronize. We don’t close the order until it is delivered and paid for. We show this with the join before the Close Order action. With a join, the outgoing flow is taken only when all the incoming flows reach the join. So you can close the order only when you have both received the payment and delivered.
UML 1 had particular rules for balancing the forks and joins, as activity diagrams were special cases of state diagrams. With UML 2, such balancing is no longer needed.
You’ll notice that the nodes on an activity diagram are called actions, not activities. Strictly, an activity refers to a sequence of actions, so the diagram shows an activity that’s made up of actions.
Conditional behavior is delineated by decisions and merges. A decision, called branch in UML 1, has a single incoming flow and several guarded out-bound flows. Each outbound flow has a guard: a Boolean condition placed inside square brackets. Each time you reach a decision, you can take only one of the outbound flows, so the guards should be mutually exclusive. Using [else] as a guard indicates that the [else] flow should be used if all the other guards on the decision are false.
In Figure 11.1, after an order is filled, there is a decision. If you have a rush order, you do an Overnight Delivery; otherwise, you do a Regular Delivery.
A merge has multiple input flows and a single output. A merge marks the end of conditional behavior started by a decision.
In my diagrams, each action has a single flow coming in and a single flow going out. In UML 1, multiple incoming flows had an implicit merge. That is, your action would execute if any flow triggered. In UML 2, this has changed so there’s an implicit join instead; thus, the action executes only if all flows trigger. As a result of this change, I recommend that you use only a single incoming and outgoing flow to an action and show all joins and merges explicitly; that will avoid confusion.
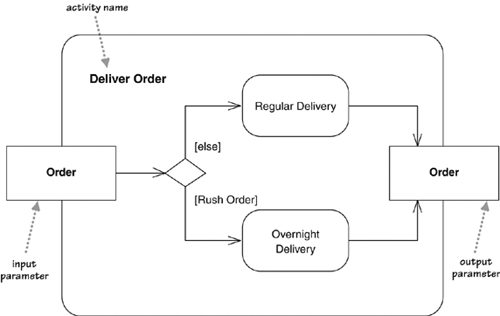
Actions can be decomposed into subactivities. I can take the delivery logic of Figure 11.1 and define it as its own activity (Figure 11.2). Then I can call it as an action (Figure 11.3 on page 121).
Actions can be implemented either as subactivities or as methods on classes. You can show a subactivity by using the rake symbol. You can show a call on a method with syntax class-name::method-name. You can also write a code fragment into the action symbol if the invoked behavior isn’t a single method call.
Activity diagrams tell you what happens, but they do not tell you who does what. In programming, this means that the diagram does not convey which class is responsible for each action. In business process modeling, this does not convey which part of an organization carries out which action. This isn’t necessarily a problem; often, it makes sense to concentrate on what gets done rather than on who does what parts of the behavior.
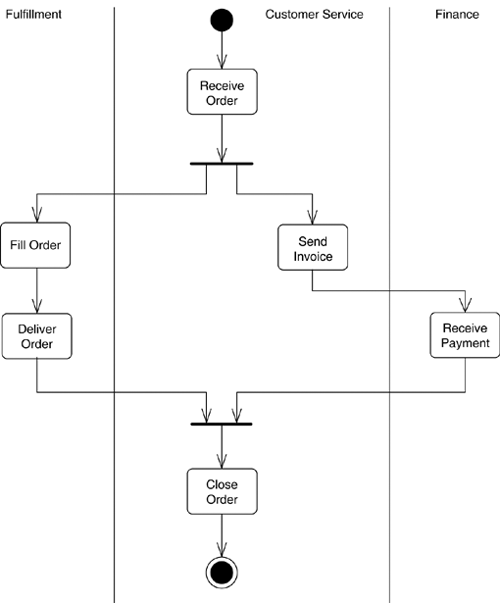
If you want to show who does what, you can divide an activity diagram into partitions, which show which actions one class or organization unit carries out. Figure 11.4 (on page 122) shows a simple example of this, showing how the actions involved in order processing can be separated among various departments.
The partitioning of Figure 11.4 is a simple one-dimensional partitioning. This style is often referred to as swim lanes, for obvious reasons and was the only form used in UML 1.x. In UML 2, you can use a two-dimensional grid, so the swimming metaphor no longer holds water. You can also take each dimension and divide the rows or columns hierarchically.
In the simple example of Figure 11.1, activity diagrams have a clearly defined start point, which corresponds to an invocation of a program or routine. Actions can also respond to signals.
A time signal occurs because of the passage of time. Such signals might indicate the end of a month in a financial period or each microsecond in a real-time controller.
Figure 11.5 shows an activity that listens for two signals. A signal indicates that the activity receives an event from an outside process. This indicates that the activity constantly listens for those signals, and the diagram defines how the activity reacts.
In the case of Figure 11.5, 2 hours before my flight leaves, I need to start packing my bags. If I’m quick to pack them, I still cannot leave until the taxi arrives. If the taxi arrives before my bags are packed, it has to wait for me to finish before we go.
As well as accepting signals, we can send them. This is useful when we have to send a message and then wait for a reply before we can continue. Figure 11.6 shows a good example of this with a common idiom of timing out. Note that the two flows are in a race: The first to reach the final state will win and terminate the other flow.
Although accepts are usually just waiting for an external event, we can also show a flow going into them. That indicates that we don’t start listening until the flow triggers the accept.
If you’re sufficiently brave to venture into the demonic depths of the UML specification, you’ll find that the activity section of the specification talks a lot about tokens and their production and consumption. The initial node creates a token, which then passes to the next action, which executes and then passes the token to the next. At a fork, one token comes in, and the fork produces a token on each of its outward flows. Conversely, on a join, as each inbound token arrives, nothing happens until all the tokens appear at the join; then a token is produced on the outward flow.
You can visualize the tokens with coins or counters moving across the diagram. As you get to more complicated examples of activity diagrams, tokens often make it easier to visualize things.
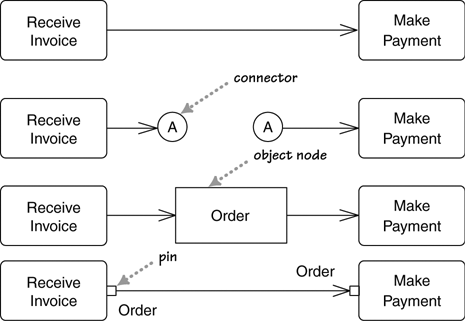
UML 2 uses the terms flow and edge synonymously to describe the connections between two actions. The simplest kind of edge is the simple arrow between two actions. You can give an edge a name if you like, but most of the time, a simple arrow will suffice.
If you’re having difficulty routing lines, you can use connectors, which simply save you having to draw a line the whole distance. When you use connectors, you must use them in pairs: one with incoming flow, one with an outgoing flow, and both with the same label. I tend to avoid using connectors if at all possible, as they break up the visualization of the flow of control.
The simplest edges pass a token that has no meaning other than to control the flow. However, you can also pass objects along edges; the objects then play the role of tokens, as well as carry data. If you are passing an object along the edge, you can show that by putting a class box on the edge, or you can use pins on the actions, although pins imply some more subtleties that I’ll describe shortly.
All the styles shown in Figure 11.7 are equivalent; you should use whichever conveys best what you are trying to communicate. Most of the time, the simple arrow is quite enough.
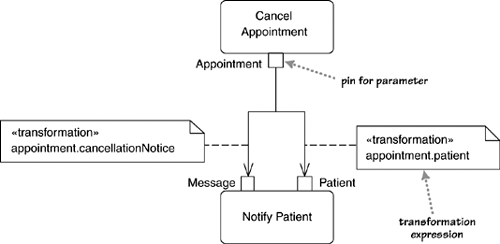
Actions can have parameters, just as methods do. You don’t need to show information about parameters on the activity diagram, but if you wish, you can show them with pins. If you’re decomposing an action, pins correspond to the parameter boxes on the decomposed diagram.
When you’re drawing an activity diagram strictly, you have to ensure that the output parameters of an outbound action match the input parameters of another. If they don’t match, you can indicate a transformation (Figure 11.8) to get from one to another. The transformation must be an expression that’s free of side effects: essentially, a query on the output pin quary that supplies an object of the right type for the input pin.
You don’t have to show pins on an activity diagram. Pins are best when you want to look at the data needed and produced by the various actions. In business process modeling, you can use pins to show the resources produced and consumed by actions.
If you use pins, it’s safe to show multiple flows coming into the same action. The pin notation reinforces the implicit join, and UML 1 didn’t have pins, so there’s no confusion with the earlier assumptions.
With activity diagrams, you often run into situations in which one action’s output triggers multiple invocations of another action. There are several ways to show this, but the best way is to use an expansion region. An expansion region marks an activity diagram area where actions occur once for each item in a collection.
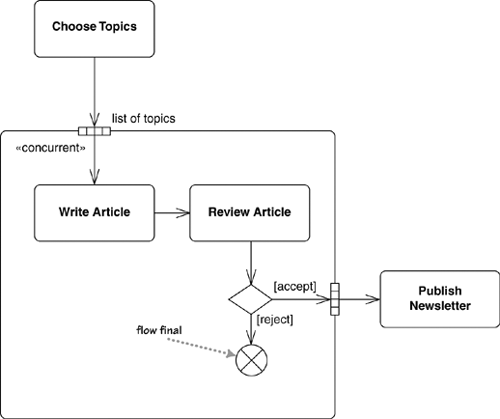
In Figure 11.9, the Choose Topics action generates a list of topics as its output. Each element of this list then becomes a token for input to the Write Article action. Similarly, each Review Article action generates a single article that’s added to the output list of the expansion region. When all the tokens in the expansion region end up in the output collection, the region generates a single token for the list that’s passed to Publish Newsletter.
In this case, you have the same number of items in the output collection as you do in the input collection. However, you may have fewer, in which case the expansion region acts as a filter.
In Figure 11.9, all the articles are written and reviewed in parallel, which is marked by the «concurrent» keyword. You can also have an iterative expansion region. Iterative regions must fully process each input element one at a time.
If you have only a single action that needs multiple invocation, you use the shorthand of Figure 11.10. The shorthand assumes concurrent expansion, as that’s the most common. This notation corresponds to the UML 1 concept of dynamic concurrency.
Once you get multiple tokens, as in an expansion region, you often get flows that stop even when the activity as a whole doesn’t end. A flow final indicates the end of one particular flow, without terminating the whole activity.
Figure 11.11 shows this by modifying the example of Figure 11.9 to allow articles to be rejected. If an article is rejected, the token is destroyed by the flow final. Unlike an activity final, the rest of the activity can continue. This approach allows expansion regions to act as filters, whereby the output collection is smaller than the input collection.
By default, a join lets execution pass on its outward flow when all its input flows have arrived at the join. (Or in more formal speak, it emits a token on its output flow when a token has arrived on each input flow.) In some cases, particularly when you have a flow with multiple tokens, it’s useful to have a more involved rule.
A join specification is a Boolean expression attached to a join. Each time a token arrives at the join, the join specification is evaluated and if true, an output token is emitted. So in Figure 11.12, whenever I select a drink or insert a coin, the machine evaluates the join specification. The machine slakes my thirst only if I’ve put in enough money. If, as in this case, you want to indicate that you have received a token on each input flow, you label the flows and include them in the join specification.
I should stress that this chapter only scratches the surface on activity diagrams. As with so much of the UML, you could write a whole book on this one technique alone. Indeed, I think that activity diagrams would make a very suitable topic for a book that really dug into the notation and how to use it.
The vital question is how widely they get used. Activity diagrams aren’t the most widely used UML technique at the moment, and their flow-modeling progenitors weren’t very popular either. Diagrammatic techniques haven’t yet caught on much for describing behavior in this kind of way. On the other hand, there are signs in a number of communities of a pent-up demand that a standard technique will help to satisfy.
The great strength of activity diagrams lies in the fact that they support and encourage parallel behavior. This makes them a great tool for work flow and process modeling, and indeed much of the push in UML 2 has come from people involved in work flow.
You can also use an activity diagram as a UML-compliant flowchart. Although this allows you to do flowcharts in a way that sticks with the UML, it’s hardly very exciting. In principle, you can take advantages of the forks and joins to describe parallel algorithms for concurrent programs. Although I don’t travel in concurrent circles that much, I haven’t seen much evidence of people using them there. I think the reason is that most of the complexity of concurrent programming is in avoiding contention on data, and activity diagrams don’t help much with that.
The main strength of doing this may come with people using UML as a programming language. In this case, activity diagrams represent an important technique to represent behavioral logic.
I’ve often seen activity diagrams used to describe a use case. The danger of this approach is that often, domain experts don’t follow them easily. If so, you’d be better off with the usual textual form.
Although activity diagrams have always been rather complicated and are even more so with UML 2, there hasn’t been a good book that describes them in depth. I hope this gap will get filled someday.
Various flow-oriented techniques are similar in style to activity diagrams. One of the better known—but hardly well known—is Petri Nets, for which http://www.daimi.au.dk/PetriNets/ is a good Web site.
