
5
Investment Fundamentals
This chapter expands on the Investment definition introduced earlier and provides a practical method for forecasting income projections to support Cost of Delay (CoD) and Weighted Shortest Job First (WSJF) calculations. Investments are the smallest increment of software functionality that has the potential to increase income and/or reduce operational expenses. This allows CoD to be associated at the Investment level.
We start by differentiating Investments from initiatives and programs commonly used in portfolio management. Portfolio management is the process used to distribute funds across numerous potential projects to maximize the benefits for the company. It is like your stock portfolio where you allocate money to investments that maximize your Return on Investment (ROI) and manage risk.
An Investment relationship hierarchy, or “schema,” is introduced in this chapter that plans value independent of release planning. Investments bundled into releases increase Net CoD because each Investment could have generated income earlier if it had been released independently. The schema also introduces profit and loss (P&L) centers that can be used to allocate portfolio ROI responsibilities.
It may be difficult to estimate income to calculate CoD for some Investments. For example, penetration of a new market may be difficult to estimate prior to product introduction. Or income may be expected beyond a planning period used to calculate WSJF. There is a section on how to allocate your R&D portfolio to account for what are called “strategic Investments” with payback periods greater than three years.
In many cases, sales or operations may be reluctant to commit to a revenue or income profile. In the past, they have been able to push for features without financial justification. This chapter provides a method to determine income profiles necessary to satisfy a target payback period based on development cost and projected growth rates. This opens a collaborative discussion among sales or operations and product management to determine the optimal balance of expected income and payback period.
Investment backlogs are introduced, including how to prioritize strategic Investments. Investment Work in Process (WIP) is addressed. It includes the effort for Investments that have been started and not completed, and introduces a one‐year backlog planning WIP limit.
Lastly, this chapter discusses a topic near and dear to engineering leaders – technical debt. It shows how technical debt reduction can be justified as an Investment.
5.1 Investments, Initiatives, and Programs
Initiatives are defined by product management to implement a strategy to achieve a business goal. The initiative defines the responsibilities of departments to make the initiative successful. For example, a company wants to penetrate a new market by funding an initiative. The initiative may entail new development from R&D, support from field services to deploy the software, and new marketing collateral to sell the product. It may also involve new hardware. The training department might develop training material for sales and customers. The initiative defines the responsibilities of all departments involved and estimates total implementation costs.
Investments, as defined in this book, are limited to the R&D contribution to an initiative or business goal. The Investment model is intended to optimize the order of development of software development work so external costs are not included. Investments may define the R&D work necessary to accomplish an initiative.
For completeness, we should understand the difference between “initiatives” and “programs.” Programs specify the deliverables of departments and their interdependencies to achieve the initiative or business goal within schedule and cost constraints defined in the business plan. Programs are usually owned by a different organization, often called a “program management office,” or PMO.
5.1.1 Investment Hierarchy
Investments facilitate a shift in traditional product management thinking. They change focus from functionality to value. Investment value depends on the willingness of a customer to pay for an Investment. Value is no longer a nebulous concept. It is determined by having a CoD.
With Waterfall release planning, R&D work usually starts at the feature‐level. An endless stream of features is bundled into large releases. This is also true in the many Agile implementations where Waterfall planning persists. Financial value is usually determined at the release level, making it impractical to calculate CoD to prioritize smaller elements of work within a release. The conventional planning hierarchy is represented in Figure 5.1.
Planning typically starts with the assumption of a major release that needs to be filled up with features.
The number 1 and the infinity symbol (∞) indicate that multiple child releases can be funded from the R&D portfolio, each with multiple features. This is referred to as a “one‐to‐many” relationship.
Figure 5.2 shows how Investments establish a planning element between portfolio and feature levels.
Release bundling should be viewed as a problem to solve rather than the first step in Agile planning. Releases increase Net CoD because they delay deployment of Investments that could generate income earlier. Recall that every Investment has associated income. Bundling Investments extends payback periods and reduces near‐term R&D ROI. Chapter 8 quantifies the additional Net CoD posed by releases and provides guidance on when Investments should be bundled within a release.

Figure 5.1 Release feature‐level planning hierarchy.

Figure 5.2 Investment planning hierarchy.

Figure 5.3 Investment planning P&L centers.
Figure 5.3 introduces P&L centers that can provide another level of financial control and accountability between the portfolio and Investment levels. For example, there may be separate P&L centers for different regions, like North America or Asia. There may be separate P&L centers for market segments, like the North American large, medium, and small markets. This provides flexibility for multiple product managers to share functionality in a common release while separating financial responsibilities and product planning.
P&L centers also provide finer control of resource allocation. Resources may be shifted at any time based on P&L performance. Financial projections of P&L centers can be created based on increased resource allocation for comparison. For example, what would three‐year financial projections look like if each P&L could increase staffing by 10%? This would allow money and resources to be shifted from lower‐ to higher‐performing P&L centers.
Figure 5.4 shows how Investments can be driven by strategies and initiatives. The connections with the infinity symbol at both ends indicate that any number of Investments can be associated with any number of strategies in a so‐called “many‐to‐many relationship.”
Investments can be derived from strategies or initiatives. The relationships also ensure that strategies and initiatives are adequately supported by R&D investment.
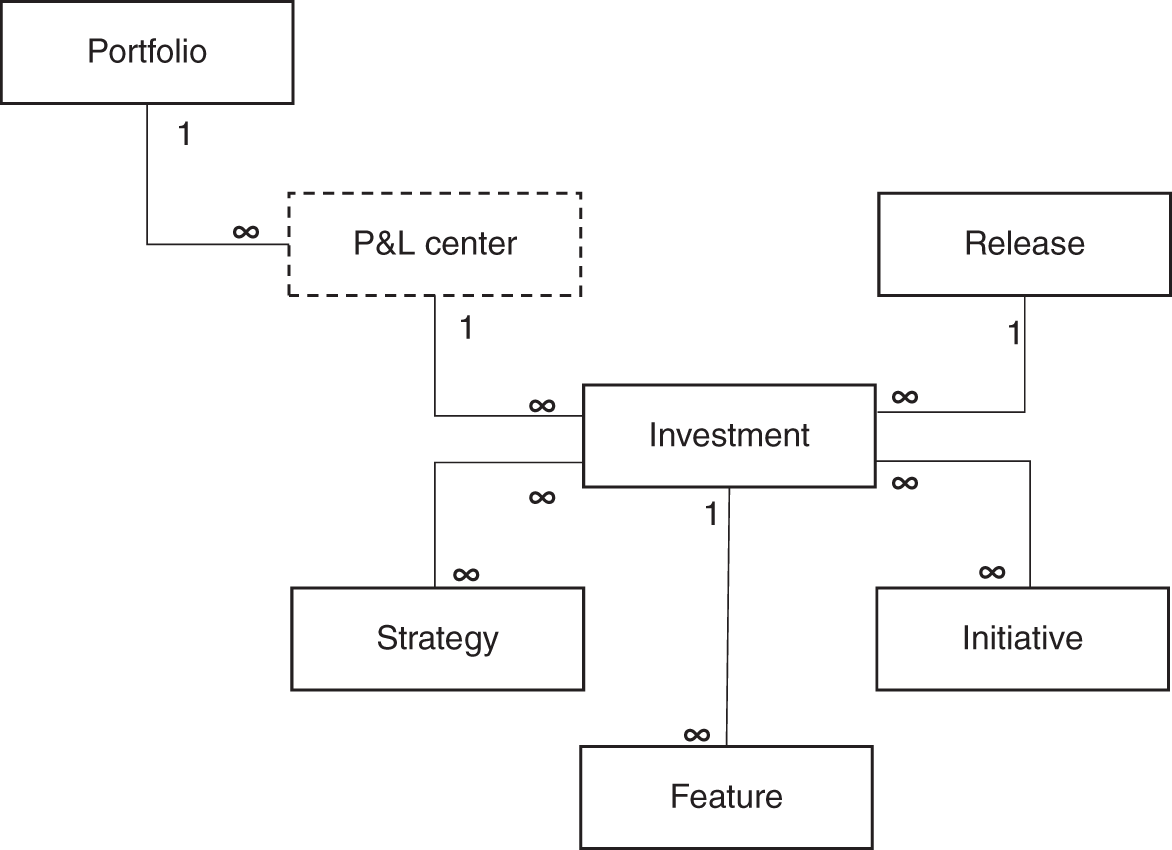
Figure 5.4 Investments related to strategies and initiatives.
5.2 AccuWiz Investment Examples
Below are examples of Investments that AccuWiz came up with after applying the practices described in this book. Each Investment is associated with a clear business objective and has the potential to increase income.
| Investment | Objective |
|---|---|
| Quick Close Capability | Increase quarterly customer financial predictability |
| Workflow Enhancements | Reduce customer accounting staff costs |
| European Version | Expand AccuWiz market |
| User Interface (UI) Enhancements | Reduce AccuWiz customer churn rates |
| Data Analytics Connectors | Increase customer financial predictability by supporting personalized dashboards |
| Enterprise Integration | Reduce customer accounting costs and increase accuracy by reducing redundant data entry |
| Customer Support Enhancements | Reduce AccuWiz customer churn rates and increase customer references |
| Mobile Application | Retain AccuWiz market share |
How was AccuWiz product development able to arrive at software functionality that creates value that customers pay for instead of taking feature orders from sales? How did AccuWiz change their organizational culture from conflict to teamwork and collaboration among the three department heads to agree on priorities? The principles and practices necessary to do this in your organization are the subject of this book. We'll return to AccuWiz in a later chapter to see how it happened. I'll give you a glimpse. Charles, the chief operating officer (COO), doesn't make it. His controlling style is not necessary anymore to achieve financial predictability.
5.3 Portfolio Allocation
It may not be possible to assign financial value to every Investment. For example, changing the product UI to improve branding. We can account for this by separating portfolios into tactical and strategic pools. We define a strategic Investment as one with an uncertain payback, or a payback period greater than three years.
Consider a case where your marketing department wants to change the UI to strengthen branding. Marketing feels strongly that this will result in increased income, but they just can't say by how much. These requests are “bets” rather than Investments. Just as with your personal Investment portfolio, you limit “bets” on high‐risk Investments to a fraction of your portfolio. You want to invest most of your portfolio in safe Investments that can provide more predictable returns.
The recommendation is that your company's R&D portfolio be separated into “strategic” and “tactical” Investments. Strategic funding goes to the “bets” where income can't be forecast or payback is beyond three years. Tactical Investments pay back within a three‐year planning period. The tactical fund generates the predictable income the business needs to meet financial commitments.
Figure 5.5 shows a recommended R&D portfolio allocation.
It's very difficult to forecast financial returns for Investments in innovation. If you could, the funding would come out of the tactical Investment allocations. Innovation funding is like the small portion of your stock portfolio you might allocate for high‐risk, early‐stage startup companies. Funding for innovation should not compete with Investment portfolio allocations because it is not possible to calculate a value for WSJF.
Software maintenance has a specific definition in this model. It is limited to fixes and technology changes necessary to maintain the viability of the product. For example, updates for browser compatibility would qualify as maintenance. Maintenance does not include changes to provide additional value to a customer. These would be part of the Investment allocation.

Figure 5.5 Investment portfolio allocation.
I assert that strategic Investments can be justified financially in more cases than we believe. In the branding case, the question would be, “How many more customers would we add or retain with the UI rebranding?” What tests could marketing set up to show that customers exposed to the new UI are more likely to purchase or retain the product? How much money would we lose if we don't do the rebranding or cut the funding in half? Investments bring up hard questions to justify allocation of precious development resources.
5.4 Investment Forecasts
5.4.1 Development Effort and Cost
The term “forecast” will be used in place of “estimate” to stress that effort estimates should be expected to vary in Agile development. Initial forecasts are done without detailed requirements and may change based on newer information and sprint feedback. Software effort forecasts should be like sales forecasts, where variability is managed through feedback and decision‐making at a weekly sales meeting focused on sales targets. Sales expects that specific sales predictions will change, so they carefully manage their pipeline to achieve revenue commitments. The Investment approach embraces estimation variability to increase predictability.
Forecasting Investment effort and schedule should not involve a lot of planning effort. The purpose of these forecasts is to determine backlog priority, not to fix schedules. A later chapter will discuss how Investments can be timeboxed by adjusting feature content and functionality based on the rapid feedback provided by Agile development.
Additional planning and estimation effort should not be wasted on Investments with very low WSJF scores. We want to do an initial screening based on WSJF as soon as possible with as little effort as possible. There are several good “top‐down” estimation techniques, like estimation by analogy and estimation by statistical methods. Top‐down estimation does not require software design and decomposition to provide an estimate. These and other estimation methods can be found in Steve McConnell's book, Software Estimation: Demystifying the Black Art [1].
A common Agile approach is decomposition into epics and user stories to estimate story points, which is a form of “estimation by analogy.” Engineering defines a scale to enable relative effort comparisons. The scale is anchored by assigning a story point value to one user story, for example, 100 points. A user story estimated to be twice the effort would be 200 story points. Story points allow the team to target stories that can be accomplished within a sprint based on the total story points completed in prior sprints, which is the team's velocity.
Even though engineering may estimate effort in terms of story points, they must be related to hours at some point. Project approvals require estimations of development cost before development starts. Companies are not willing to fund the development without prediction of what will be delivered when, and the investment required.
Engineering is often reluctant to provide a conversion from story points to hours because they end up being committed to schedules and content they can't meet. I often hear complaints from product managers about outrageous development estimates. This is usually a sign that engineering has been forced into commitments they can't make. Initial Investment estimates are more likely to be reasonable because they are not used to fixed schedules. They are only used to forecast development costs for initial screening. Section 5.4.2 will show how development cost forecasts are used to determine income that must be generated by an Investment to justify development.
Once an Investment passes initial screening, traditional “bottom‐up” estimation techniques may be applied, or epics may be broken down to the user‐story level. WSJF can be refined to ensure the Investment should proceed to the backlog. Cycle time can be refined to set Investment timeboxes. A timebox assumes a fixed schedule but allows delivery content to change to account for increased estimates and new requirements.
Consider one more factor that provides flexibility on Investment content. Your CEO and CFO don't really care about which features are delivered. They want financial commitments to be met. Sales wants products and upgrades customers will pay for. The Investment model allows commitments to be made above the feature‐level, giving product management and engineering more control over feature content.
5.4.2 Investment Income Forecasts
Investment income forecasts are required to calculate CoD. This can be a challenge. Asking your sales organization for a revenue commitment upfront or asking operations to commit to expense reductions is not likely to result in the answer you want – “We just know that the number is big!” This section provides a way to establish mutually agreed Investment income forecasts to support a CoD calculation.
A relationship can be drawn between CoD and payback period. An Investment or project is expected to generate a specific return within the payback period to recover development costs. For example, an Investment of $180K with a payback period of three years would need to generate an average of $60K per year, which is an average of $5K per month. This is also the cost of a one‐month delay if we assume a linear income profile. However, we've already established that income profiles are not linear and often follow a growth curve. We can account for nonlinear income profiles with a bit of algebra.
Most organizations have payback targets for software development. The period is typically short because of the high risks in the dynamic software market. Periods of one to three years are typical. If you don't have a target payback period provided by your CFO, as a product manager you should establish a reasonable target that balances the payback period with the risks of your industry.
As an example, the AccuWiz “Quick Close” Investment requires a sales forecast to justify development. However, sales is reluctant to commit to a number. AccuWiz product management has established a target payback period of three years for Investments. AccuWiz product management now avoids investing in new development without a sales commitment to achieve the payback revenue. This is a new game for sales. They could always just apply pressure in the past to try to get what they wanted. What can product management do?
The Investment development cost is estimated at $570K in this example with a target payback period of three years. Product management only needs to ask sales what they think the relative profile of income by year will be. If the income from year 1 is 100%, what would future yearly revenue be relative to year 1? I would argue that the company shouldn't be making large Investments in a case where sales cannot even predict a growth rate.
This example assumes the Investment generates sales revenue, but the same calculation can be done for the case of expense reductions where internal operations should be willing to commit to productivity improvements to justify tactical Investments.
Assume a revenue growth rate as shown in Figure 5.6.
In this case, second‐year income is expected to be 5% higher than the first year's income.

Figure 5.6 Relative annual income forecasts.

Figure 5.7 Income profile example.
Figure 5.7 shows the income necessary to meet the payback period of three years. Appendix B shows the math behind the calculation and includes a reference to a downloadable Investment Income Profile Calculator spreadsheet you can use to determine income profiles needed to meet payback targets based on development cost estimates.
In this case, the income for the first three years is the same as the development cost of $570K, meeting the payback period objective. Revenue can be estimated by dividing by projected margins. In the case shown in Figure 5.8, margin of 80% in each year is assumed.
The downloadable Investment Income Profile Calculator accounts for fractional years. For example, it will calculate the correct income profile for a payback period of 2.5 years.

Figure 5.8 Sales revenue calculated from annual income forecast.
The intent of this calculation is to establish a collaborative dialog with sales or operations to balance payback period and income commitment. A director or VP of sales may initially balk at the calculated income profile. “This is much higher than I think we can meet.” The next step is to consider what could be done to make it more reasonable. Increasing the payback period will reduce the revenue commitment, but it increases financial risk for the company, and your CFO may have absolute limits on the maximum payback period. The conversation naturally leads to ways to decrease development effort to decrease the required income to an acceptable level.
Consider the following collaborative discussion with a sales director:
Product manager: “We understand that this Investment could significantly increase sales. However, based on payback targets it would require this much revenue over the first three years.”
Sales director: “Wow! That's much higher than I expected. How can we reduce the sales commitment?”
Product manager: “We can reduce development effort or justify a lower payback period. However, I know our CFO is firm on software development payback periods.”
Sales director: “What's the next step?”
Product manager: “Perhaps the features or functionality you said are essential could be simplified or deferred. There's a possibility of reducing the functionality by focusing initially on a narrower market segment. What if we put out an initial release that can only be sold in North America where most of the sales are generated in the first three years anyway? There are several features we wouldn't need. And I can also ask engineering to propose functionality simplifications to reduce development effort.”
Sales director: “I really appreciate you looking at alternatives to make this happen. I certainly will consider reduced functionality to get this done. And I'll go back to see if we could generate additional sales to justify the functionality we want.”
Aha! The illusive Minimum Marketable Feature Set (MMFS) appears! An often‐antagonistic discussion turns into one that can substantially improve company financial results and relationships. Everybody wins.
We now understand why the MMFS has not, and will not, propagate until there are trade-offs that sales and operations understand. There are no perceived financial consequences for continuing to pile on functionality. The Investment approach provides a practical way to present these trade‐offs in early planning stages where options still exist.
You may be thinking that sales will just agree to a higher forecast to justify higher priority in the Investment backlog. There is a catch. The individual Investment income forecasts add up to the sales VP's commitment for new development. The projections are used to establish sales quotas for the VP and directors. You can be sure they will vet the income assumptions to end up with a sales quota they believe they can achieve.
5.5 Investment Backlogs
WSJF is used to prioritize Investments to create an Investment backlog. However, actual order may vary from strict WSJF order based on judgment of risk, strategic value, and the credibility of supporting data.
Strategic Investments can be interspersed within the backlog to obtain development resources. Even though the funding comes from different portfolio allocations, they must still be prioritized relative to tactical Investments that have quantified WSJF. Insertion of a strategic Investment in the backlog increases Net CoD of tactical Investments beneath them. The actual financial impact of a strategic Investment is the cost of development plus the increase in Net CoD of the lower-priority tactical Investments. A strategic Investment to improve UI may have a development cost of $100K, but costs millions of dollars when the additional backlog Net CoD is considered.
One way to compare strategic Investments with delayed income is to use Net Present Value (NPV). Although NPV is not used to compare tactical Investments, the long‐term income from strategic Investments may be discounted to the third year of a three‐year planning period. However, income beyond three years should also be heavily discounted for risk.
Strategic Investments may be first prioritized among themselves with a weighted point system that considers more than income generation.
For example:
- Support for company vision
- Support for company strategic plan
- NPV forecast
- Risk
- Competitive positioning
- Contribution to company brand
- Leverage of company core competencies
- Ability to expand market
5.5.1 Investment WIP
The importance of minimizing WIP was discussed in the earlier description of Kanban. Even though it is associated with Kanban, minimization of WIP should be an objective of every software development process. Reducing WIP reduces system delays. It also reduces R&D capital tied up in partially completed Investments.
WIP is a Key Performance Indicator (KPI) for manufacturing organizations. The cost of WIP appears as a component of the inventory asset account on the balance sheet. Components of products are assumed to have value. For example, a completed LCD screen to be installed in a television set in the next manufacturing step has financial value that adds to the inventory asset account. The WIP cost for the LCD screen includes material costs and the labor to produce it. Manufacturing organizations strive to keep WIP costs low. It represents capital tied up in the manufacturing process. WIP added to the balance sheet reduces shareholder Return on Equity (ROE).
WIP in software organizations also represents tied up capital. Material costs are negligible, but every document or line of code has an associated labor cost. At any point in time, a large portion of the R&D budget is tied up in partially completed components targeted for the next release. However, software organizations do not focus on WIP costs because they do not directly impact financial reports. Reduction of WIP in software development can increase total productivity and free up capital that can be invested in new development.
The Investment model provides a vehicle to manage and reduce WIP without requiring a detailed accounting system. We will consider two types of WIP that we want to make visible and quantify. The first is Investment planning WIP to minimize wasted planning effort. The other WIP is the labor cost accrued during Investment development prior to completion. In Chapter 8, we will introduce one other form of WIP analogous to manufacturing finished goods WIP.
It should be noted that zero WIP is also not a good situation. There should be some WIP to account for processing time variance so that development stages don't need to wait. For example, an Agile team may find there are no user stories available in the product backlog, or a test team may run out of stories to test. Queues typically maintain upper and lower WIP limits to prevent bottlenecks and queue starvation. Refer to Reinertsen's, The Principles of Product Development Flow, for more information.
5.5.2 Investment Planning WIP Limits
At the start of the software development process, we don't want to plan more work than we can develop. Organizations waste hours of product management and engineering time creating detailed plans and estimates for the latest great idea, only to be replaced with a higher priority three months later. These estimates cause considerable frustration and disrupt planned work.
Many software organizations plan work that engineering never develops. In one assessment, I quantified the development effort for incomplete backlog work that had gone through a first level of planning and estimation. It would have taken their current engineering resources almost 10 years to complete the backlog, assuming no new work was added. Such a waste of valuable planning effort. We want to use WIP limits to prevent this backlog of planned work that will never be developed.
Figure 5.9 depicts the AccuWiz Investment backlog prioritized by WSJF. The grayed‐out Investments can't be started within the next year based on R&D capacity.

Figure 5.9 Investment backlog with one‐year work‐in‐process (WIP) limit.
Capacity may be constant, or it may be increased by adding new staff. Either way, there are a limited number of staff‐hours or story points available in an upcoming year to start new Investments.
Agile development reduces wasted planning effort by adopting a “just‐in‐time” approach to requirements development. However, larger organizations require some level of planning before they invest in a project or release. The business case needs cost and schedule estimates.
The level of effort for estimation varies greatly among organizations with which I've worked. Estimation may involve creating an initial set of requirements or features decomposed at the user‐story level. Since engineering is usually held to schedule estimates, they expend considerable effort to create the estimate, even breaking the requirements down into modules with statement counts. I've even seen cases where project managers create a schedule at the task level to produce estimates.
It makes no sense to do detailed planning for an Investment that can't be started within a year. Requirements are likely to change, or an Investment within the limit may be moved down in priority due to new opportunities. One year is a good number for an Investment WIP limit, but it can vary depending on the rate of change in your industry. The Investment WIP limit allows product managers to match their work level with software development capacity.
5.5.3 Minimizing Investment WIP
Investment WIP, the labor cost of partially completed Investments, can be minimized by placing a higher priority on completing Investments than starting new Investments. To the extent possible, work for Investments prioritized higher in backlog priority should take priority. This is not always practical because developer specialization causes resource contention that can impact the critical development path. Staff may be available, but they don't have the skills needed to work on a specific Investment.
There are two ways to look at this. The first is based on Reinertsen's, The Principles of Product Development Flow, where he shows that minimization of Net CoD is more important than staff utilization. In fact, queue delays go to infinity as utilization approaches 100%. So, it is not a bad thing to have some staffing flexibility for development commitments.
The second view is that since staff are available, you may as well get them started on the next Investment in line. This would presumably reduce backlog Net CoD, but it ends up being very disruptive to Agile teams. You must weigh what may be an insignificant improvement in Investment cycle times against the disruption to functioning Agile teams. Shifting staff to start lower‐priority Investments has a high efficiency cost and increases WIP. It may be better to have individuals work on deferrable tasks like maintenance and remain with their teams.
The Investment model reduces WIP by being able to prioritize R&D work throughout the development organization. Prioritization of work among multiple Agile teams with interdependencies is challenging because financial value cannot be associated with features or user stories. This is especially true when functional Kanban teams support multiple Agile teams, each receiving myriad simultaneous requests from Agile teams. For example, there may be a single team to add services for database access. With the Investment approach, the priority of work of any team is based on the WSJF priority of the Investments in the backlog, ensuring that higher‐priority Investments are completed before new Investments are started. This provides functional teams with clear priorities and reduces software WIP.
The ideal case is that Investment development order is not driven by developer skill availability. I know this is easier said than done. However, as the Agile community says that the business needs to be more Agile, I contend that development organizations must improve their agility to develop an Agile backlog in the order of business value. This can be accomplished by staff cross‐training and layered architectures that enable teams to focus on functionality without having to know the details of lower layers.
5.6 Technical Debt Investments
“Technical debt” is incurred when engineering takes shortcuts to implement functionality in a way that increases development costs in the future. The idea was that companies should budget to retire technical debt at a future time to refactor software. For example, an engineering team may forego a layered architecture to directly build functionality to get it out quickly, recognizing that at one point they will need a layered architecture to scale.
Technical debt has long been a source of frustration for engineers. Engineers want to develop the most efficient and effective code that will provide a solid platform for scalability. Even with the best intentions, technical debt creeps into the software base because design assumptions or requirements change. Engineers can now prioritize technical debt reduction within the Investment backlog as either a tactical or a strategic Investment, but they must learn the rules of company financials.
The CoD model shows that retiring technical debt can be costly because it delays income‐generating Investments. Engineers need to realize that a technical debt reduction is not likely to be a good business decision unless a direct impact on cycle time reduction can be justified. A general cycle time reduction has a cascading effect on Investment deployment dates and provides a significant reduction in backlog Net CoD. The example in Figure 5.10 shows additional income within a planning period of three years for a set of quarterly releases, each with a CoD of $10K per quarter.

Figure 5.10 Added income from technical debt reduction.
In this case, the added effort for refactoring reduces net income by about $80K if there is no reduction in cycle time, making it unlikely that the business will approve this Investment. The Investment breaks even with a cycle time reduction of 10%. A cycle time of reduction of 30% increases income by over $200K.
The catch here is that the added income for the technical debt reduction must justify a WSJF value to be within the backlog one-year WIP limit to be further considered. The message for development is that reducing technical debt can be justified if cycle time can be reduced. A good example is refactoring a platform to release Investments on‐demand to save the opportunity costs posed by large releases.
There may be other reasons other than efficiency to retire technical debt. Inability to scale is one. Quality is also often brought up. However, any case for technical debt should be justified on the basis of financial benefit for the company. For example, what is the income at stake if the system is capped at its current capacity? Would it be better to apply the money required to scale to other Investments? And what is the financial impact of poor quality caused by badly structured code? How much money are we losing from previous customers who complained about quality? Would it reduce customer churn rates? By how much? Investments provide the foundation for objective discussions for product management and engineering to make sound business decisions on retirement of technical debt.
The bottom line is that you are going to live with your technical debt unless you can quantify financial benefit for the business. Just calling it a “debt” won't get you anywhere. Technical debt retirement can be justified in cases where it significantly reduces backlog Net CoD or enables deployment of individual Investments.
5.7 Summary
- The Investment model was created to establish software development increments that can be associated with income generation so they can be prioritized by WSJF.
- Investment costs are based on software labor costs to prioritize software development, as opposed to initiatives and programs that include all costs.
- Investments establish a planning element between portfolio and feature‐levels.
- P&L centers, strategies, and initiatives can be associated with Investments.
- Investments are formed around business objectives that identify business value in terms of income.
- Strategic Investments are those with indeterminate income forecasts or payback periods greater than three years.
- Tactical Investments are those with projected payback in less than or equal to three years.
- There should be separate portfolio allocations for strategic and tactical Investments to account for risk.
- Investment effort and income estimates are called forecasts to reflect the dynamic nature of Agile development.
- Commitments for income generation or cost reductions can be established based on a target payback period and growth profile.
- A backlog Investment WIP limit reduces planning effort wasted on Investments that will likely change.
- Investment WIP analogous to WIP in manufacturing organizations is based on labor costs attributed to partially completed Investments.
- Technical debt Investments can be justified based on impact to income. The best technical debt solutions increase deployability to accelerate backlog income.
Reference
- 1 McConnell, S. (2006). Software Estimation: Demystifying the Black Art. Microsoft Press.