
12
Maximizing Investment Development Productivity
I'm including this chapter because I've seen so many inefficient Agile implementations where productivity has decreased. Most of them abandoned proven software engineering quality practices because they were viewed as overhead that slows Agile development. And, “If we get it wrong, we can fix it quickly.” The code created in a sprint is pretty much built and tested the same way it has been done for decades, just in shorter cycle times. Agile development should not be a step backward. Good software engineering practices can reduce cycle time and development costs.
We've shown how to get the maximum value using current engineering resources with Investment Weighted Shortest Job First (WSJF) prioritization. We now want to maximize throughput by increasing engineering productivity. Industry attempts to measure software productivity have failed. This chapter shows how “nonproductivity” can be measured. Productivity is what's left over. Nonproductivity includes testing, waste, and rework that can be measured and reduced. The traditional Cost of Quality model is updated for Agile development. This chapter shows a direct relationship between rework reduction and increased productivity.
This is followed with a way to measure software productivity in Agile. We need to be very careful here to use the measurement as a scorecard for continuous improvement and not try to compare productivity across teams. Another section shows how a minimum set of software quality metrics can be used with Agile for continuous quality improvement.
There is one other major contributor to productivity. You may have all the best practices documented in your organization, and your development organization fully trained. But what if they don't follow the practices? What level of productivity can you expect from a demotivated and frustrated development organization? How do you maximize team motivation? These questions are addressed in Chapter 13.
Of course, there are many other factors that impact software productivity, such as training and tools. However, I would argue that quality and motivation have the largest impact, and both can be measured and improved. Yes, the level of motivation can be measured in your organization. Chapter 13 tells you how.
12.1 Measuring Software Productivity
For years organizations have wanted to measure software productivity. This subject came up most often in organizations where engineering consistently failed to meet schedules. Of course, they missed schedules because of being forced into Waterfall planning schedules with fixed schedule and scope. However, the rest of the organization viewed this as an engineering productivity problem.
Software productivity has been a group discussion topic at every Construx Leadership Summit I attended. Virtually all engineering leaders complained that the productivity of their engineers was often questioned by the executives. One had to go so far as to provide the executives with code check‐in and check‐out times by time of day to quell criticism. The executives were surprised to see that engineers were working from early morning well into the night, far harder than anyone in their departments. That stopped the snide remarks about not seeing engineers at their desks at 8:00 a.m.
Product managers usually name poor engineering productivity as their number one problem during assessments. Product management has perfect plans and only need engineering to deliver faster. I would tell them that it is not their job to question the productivity of engineering. That is a discussion between the CEO and the head of engineering. The role of product management is to determine how to produce the greatest return on finite engineering capacity.
I've asked engineering leaders what they would do if they had a perfect measure of software productivity in terms of “widgets per developer hour.” Engineering leaders are usually not seeking the measure for internal use. It has been requested by the CEO or CFO because other organizations blame their failures on poor engineering productivity. In an ideal world, they would be able to use this measure to compare with industry benchmarks to show they're not as bad as everybody thinks. But nobody has found a meaningful way to measure software productivity, and measuring it as a defensive move is unlikely to change the perspective of your executives if you miss schedules.
The focus has been on “unit productivity,” an attempt to measure productivity on the basis of “widgets per hour.” We've all seen the meaningless measures of statements per hour. I know of one organization that even standardized story points as a measure of production. I would immediately multiply all my story points by a factor of 10! We need to accept at this point that there is no such thing as an accurate unit productivity measure in engineering. There are just too many factors that change from one software project to next. I once heard someone describe productivity as, “Statements not written.”
Software unit productivity measurement would be valuable if it could be used to identify what to change to increase productivity. That's not going to happen with any software unit productivity measure. What would you do if you found that your engineers wrote fewer code statements than an industry benchmark, or if you found that one Agile team produced more story points per hour than another, assuming you could standardize on a common story point scale? Would you just ask the other teams to write code faster?
In Section 12.1.1, we'll see that while it's not possible to define a useful measure of software productivity, we can increase productivity by eliminating engineering effort that does not generate value in the end‐product. We can increase productivity by reducing nonproductivity.
12.1.1 Cost of Quality (CoQ)
The concept was introduced by Armand V. Feigenbaum in a 1956 Harvard Business Review article [1] to determine the potential savings of process improvements. It was originally applied in manufacturing organizations to increase productivity by reducing wasted effort and material costs. It was applied within software organizations in the 1980s, including the large telecommunications company I worked for. I'll describe the model used at that time and then simplify it to make it practical for Agile development.
Our R&D budget and project cost accounting were broken into the following categories:
Appraisal
- Effort and tool costs to find defects through reviews and testing
Rework
- The cost to correct defects leaked from a prior development stage
Production
- The R&D budget minus the costs of appraisal and rework
These categories assume that staff are creating deliverables, verifying deliverables, or correcting defects in deliverables.
People are usually surprised to find that testing is not considered as production. “Of course, we have to test to have a viable product.” That is true, but what if you could produce the same level of quality with less testing? Investment in automated tests is an example. Testing effort will never be zero in software development, but it should be categorized separately as an incentive to increase testing efficiency. The separate appraisal category allows organizations to measure and reduce testing costs.
Rework is the cost to correct a deliverable after it passes to a subsequent development phase. For example, the cost to correct a coding defect during system testing would be rework. We'll address Agile rework shortly, including the issue of refactoring.
Appraisal, rework, and production total 100% of direct project software development costs. We consider appraisal and rework as non‐productivity. Subtracting them from R&D project budgets shows how much effort is producing value. Reducing appraisal and rework increases productivity.
Our R&D budget had another accounting category called “prevention.” This included the costs for process improvements, tools, and training to prevent defects in the deliverables (not to find them, which is covered by appraisal). For example, the labor cost to create a coding best practices document and train the developers would be a prevention cost. Our annual R&D budgets could justify an increase in the prevention budget by projecting reductions in rework. We saw rework levels drop from over 50% to just over 20% over a few years. We got there by an effective metrics program to support continuous improvement.
You're probably thinking of the project accounting method nightmare this generated. It wasn't as bad as you think because we already had detailed project accounting on an activity basis. Don't worry. I'm not going to recommend any project accounting categories for Agile development. There is a simpler approach I'll describe later.
12.1.2 Cost of Quality and Software Productivity
Before we get into Agile, let's examine the significant impact that reductions in appraisal and rework have on software productivity. Appendix D provides a derivation of an equation to determine the increase in productivity as a function of appraisal and rework reduction, assuming the ratio of appraisal to production remains the same. Further improvements are possible with improvements in appraisal efficiency, but the greatest opportunity is the reduction of rework.
The formula is
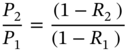
where P is production, and rework R is expressed as a fraction of project development costs.
Table 12.1 Productivity improvement based on rework reduction.
| R2 | |||||
|---|---|---|---|---|---|
| R1 | 10% | 20% | 30% | 40% | 50% |
| 20% | 13% | ||||
| 30% | 29% | 14% | |||
| 40% | 50% | 33% | 17% | ||
| 50% | 80% | 60% | 40% | 20% | |
| 60% | 125% | 100% | 75% | 50% | 25% |
Table 12.1 shows the productivity improvement gained by moving from a rework level of R1 to R2, assuming the same level of testing efficiency.
For example, if the current rework level R1 is 40% and it can be reduced to 20%, the productivity improvement is 33%.
One might think that a 20% reduction in rework would provide a 20% improvement in productivity. However, there is a leverage effect. For example, if your current appraisal and rework costs are 60%, production is only 40%. Reducing rework from 50% to 30% frees up 20% of the project budget for production. Production increases from 40% to 60%, which gives a productivity improvement of 50%.
Figure 12.1 is a graphical representation of Table 12.1.
Each line shows the productivity improvement if rework can be reduced from the current level indicated in the legend. For example, the solid line is based on a current rework level of 60%.
I estimated a rework level of about 60% for a recent client using Agile development. Rework was caused by an ineffective implementation of the product owner role. Product managers were too busy to talk to product owners, and product owners had no access to customers. The product owners did not sit with the Agile teams. Requirements problems were detected during customer acceptance, causing huge levels of rework.
I believe that most Agile organizations are close to this level. I haven't seen any large product organizations that have mastered the Agile requirement process. I'm sure there are some out there, but I didn't come across them in my years of consulting. To be fair, rework levels of 60% were not uncommon in Waterfall development. The requirements process is challenging with any development framework.

Figure 12.1 Productivity as a function of rework reduction.
12.1.3 Sources of Software Rework
Figure 12.2 has been around a long time and has been shown in many forms. I've taken this one from Rapid Development [2] by Steve McConnell. This is a Waterfall chart, but I will relate it to Agile development later.
Defects can be introduced in any of the four phases on the axis on the left. The horizontal axis shows the traditional Waterfall software development phases of a release where a defect can be found and corrected. For example, a design error could be caught during the design phase or in any of the following phases. Requirements errors can be detected in any of the phases on the horizontal axis. McConnell reports that the cost to correct requirements errors can be 50–200 times the cost [3] to fix it at the requirements stage.
The curve shows an exponential relationship between the phase of defect introduction and the phase of detection and repair. For example, a requirements error found during a review may be fixed in a few hours by a documentation change. The same error found in production may take hundreds of hours to fix, requiring architectural and design changes that impact software module interfaces, and even the structure of the software itself. Then there are the tests that must be rewritten and executed, plus redeployment to the field. Requirements errors are the biggest drivers of rework.
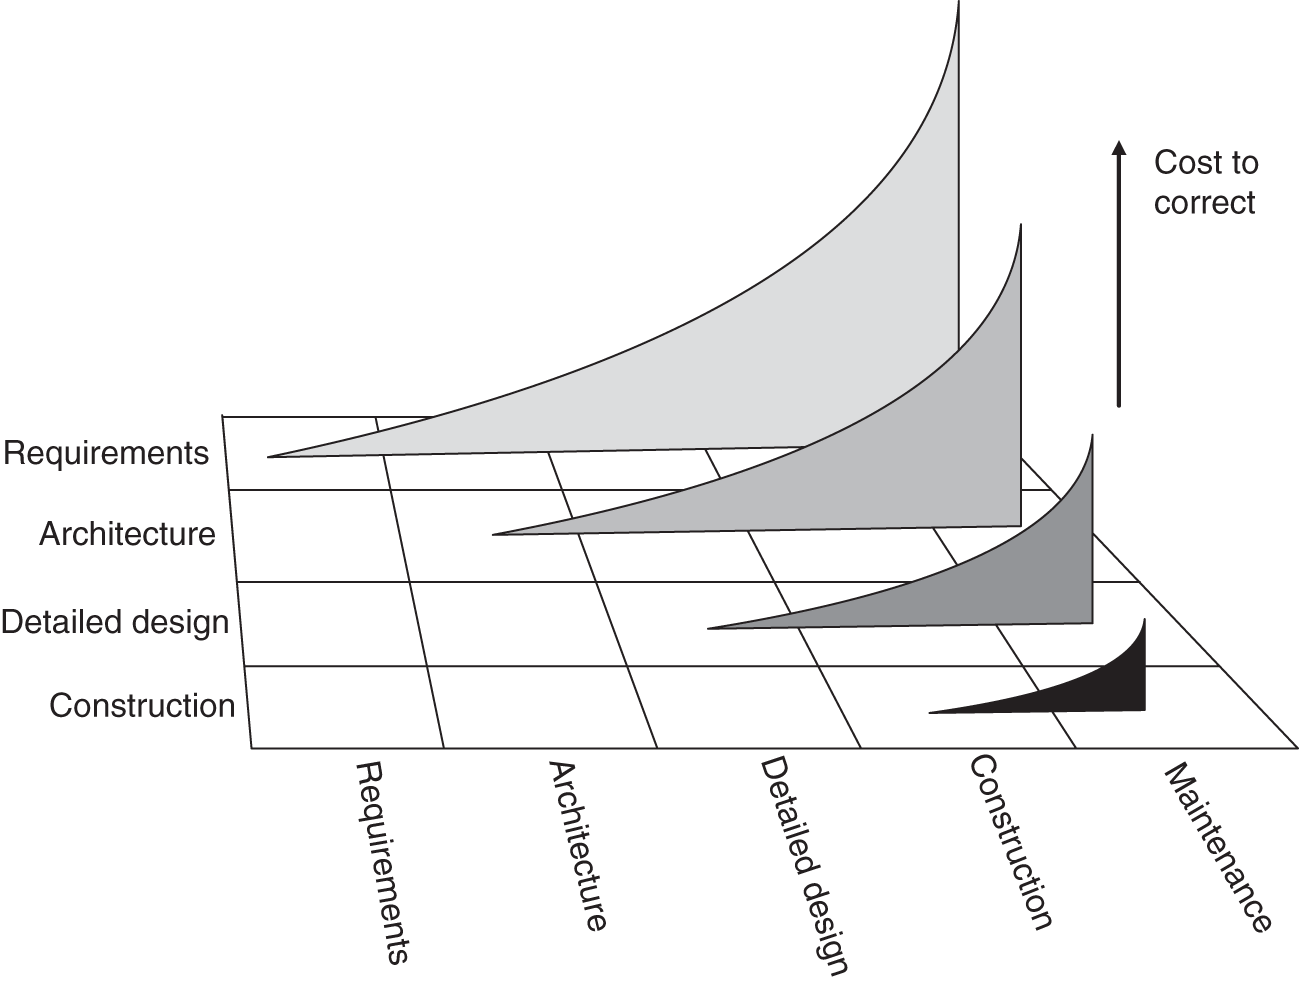
Figure 12.2 Cost of defect correction by phase of detection.
12.2 Agile Cost of Quality
Rework is a term associated with Waterfall development. Of course, Agile encourages “rework” based on feedback during development. In the Waterfall days, we created large requirements documents with UI mockups, wireframes, and screenshots and then had stakeholders sign off on them. Any changes after the approval were resisted because of the fixed schedule and content commitments. Users were told, “You signed off on it.” User complaints after delivery were translated into “enhancement requests” that usually never appeared. Agile has the potential for developers to incorporate feedback during release development. I say “potential” because it often doesn't happen because of fixed schedule and content, and ineffective product owner role implementations.
Although rework in Agile is encouraged, how much is too much? What if it took six months of feedback and revision to finally get a feature to the point of acceptance? What if it took a year? How can we tell if an Agile team is inefficient, and the reason for the inefficiency? Rework is included as story points as if it were new production.
We'll use the Waterfall Cost of Quality approach that defines production as the ideal output of the development process where all documents and code could be written and approved one time. They are defect‐free, so no appraisal is necessary. Of course, that never happened in Waterfall, but the model was a useful concept to continuously improve toward the ideal.
What would an ideal Agile development process look like? A knowledgeable product owner would be engaged with the team throughout the sprint to ensure that each developer knew everything they needed to build the right functionality. These ideal developers would be able to write code and release it defect free without any reviews or testing required. The user story would be marked as “done” after the sprint review with no changes necessary.
The Agile process accounts for changes necessary to incorporate the feedback from the product owner, so they should not be considered as rework. We want to encourage rework during the sprint to get it right the first time. Agile also supports refactoring, recognizing that the best way to construct software may not be apparent until after it has been written, so we don't count refactoring as rework. However, we do want to minimize changes after a story is declared “done.”
Agile rework can be measured by adding a single field to the user story record in your Agile development platform with the following values:
- New functionality
- Revised functionality
- Code correction
New functionality is considered as production. It includes any rework during a sprint or refactoring. The other two categories are rework but have different root causes. Revised functionality indicates a problem in your Agile requirements process and/or an ineffective product owner implementation because stories are being approved at the sprint reviews but need to be revised later. Coding errors result from ineffective software engineering coding practices. You can define a metric called “Agile production ratio,” which is the ratio of new functionality story points and total sprint story points.
You may question if revised functionality should be considered as rework if the product owner didn't have the knowledge. As in the Waterfall case, the answer is yes. The production baseline is the ideal case where the product owner has obtained the information needed to get it right. If not, the question is, “Why didn't the product owner have the knowledge?” Root cause analysis with the Five Whys can lead to improvements.
A word of warning. Do not use Cost of Quality metrics as a management tool to shame people at project review meetings to pressure them for improvements. Never show metrics at an individual level and never compare teams. Let the teams own the metrics. There's no reason for the team to share metrics with anyone unless they want to share them, and that should be for recognition. Chapter 13 explains how metrics can be used as a scorecard for team motivation. If anyone feels punished by the metrics, you will find that they are skewed, or your Agile teams will be resistant to valid changes prior to release.
12.2.1 Reducing Agile User Story Rework
The main driver of rework costs in Agile development is requirements errors. This was the case for all the Construx clients with whom I worked. Product owners were usually unavailable to teams to clarify user stories, resulting in incorrect development assumptions. Sprint demonstrations were often cursory and didn't cover all the possible cases. Product managers were used as product owners and had higher priority requests from sales, or there were product owners in engineering without market or user knowledge. If user story acceptance tests were written, they only addressed the “happy path.” Product owner effectiveness must be improved to attain high productivity in Agile development. Measuring and reducing rework after “done” will put you on that path.
The relative cost to repair functionality after a user story is declared “done” is no different than the rework costs of Waterfall. Problems that escape the Agile sprint cycle into system test and beyond cause the same level of rework as we experienced in Waterfall. The difference is that Agile executes development in shorter cycles so rework feedback can be obtained more frequently.
The Agile production ratio becomes a team goal for continuous improvement. This is consistent with the Agile philosophy of using sprint retrospectives to reduce waste. Story point contributions from functionality changed after “done” should be analyzed. The team should assess causes such as the following:
- What sprint review process improvements could have detected the incorrect functionality before declaration of “done”?
- ○ Additional attendees?
- ○ More time?
- ○ Expanded demo cases?
- ○ Improved sprint retrospective meeting structure?
- What could have prevented implementation of the incorrect functionality?
- ○ More product owner time with the team?
- ○ Product owner colocation?
- ○ Product owner with a different skill set or addition of a Subject Matter Expert (SME)?
- ○ Additional product owner training?
- ○ More effective communication between product owner and product manager?
- ○ Improvements to product requirements elicitation process?
- ○ Reduced schedule pressure?
- ○ Additional cases in user story acceptance test plan?
These types of questions provide a constructive and positive environment for continuous improvement measured by reductions in Agile rework.
Steve McConnell's book, More Effective Agile, illustrates Agile requirements methods that can reduce Agile rework. The Investment approach helps because there are distinct roles for product managers and product owners, and the problem to solve is conveyed to engineering as opposed to detailed feature requirements.
12.2.2 Reducing Agile Defect Rework
Coding defects can also be a significant component of Agile rework costs. I've observed that software testing practices honed over decades of software development have been dropped in many Agile implementations, resulting in high defect rates. The team is focused on the near‐term goal of demonstrating functionality at the end of the sprint; therefore, testing tends to be at the functionality level. Practices that were shown to be necessary to create high‐quality software, like reviews, unit testing, and integration testing, have been abandoned. There is a false assumption that moving to functional testing sooner is more efficient.
Most of the organizations I worked with said they were doing reviews but really weren't. It usually meant that another developer would take a quick look at the code if they had time. I suggest you look at ways to implement effective reviews with a new understanding of the potential for productivity improvement from rework reduction. Developers often had valid complaints that the fixed schedule and content of Waterfall development caused them to skip reviews. That should not be an issue with the variable content supported by the Investment model. Application of effective software engineering practices should be a higher priority than development of new functionality.
Software organizations producing high‐quality reliable software build automated unit tests that can be used for regression testing. They also mandate a minimum code coverage criterion for code, usually 70–80%. This is the only way that exception and alternate paths can be verified. Automated unit regression testing is a great way to find obscure side effects from those changes that “can't possibly impact anything else.”
In many cases, engineers told their management that unit testing was no longer possible because it involved additions to legacy code that did not have existing unit tests. Obviously, creating a complete unit test regression suite for legacy code is impractical. This excuse should not be accepted. Your developers just need to be trained to design for testability. Introduce coding guidelines that limit the number of statements that can be added inline with legacy code. For example, a limit of 30 would require that the functionality be added in a new method that can be independently unit tested. Any code added in‐line should be carefully reviewed.
Integration testing seems to be a lost phase in Agile development. It is usually assumed to be complete when a user story has been demonstrated successfully. This was not the original intent of integration testing. Unit testing verifies code within methods. Integration testing verifies interfaces among methods. Functional testing, which is the user story acceptance test in Agile, verifies that requirements have been met.
Integration tests were historically created from design documentation that documented the interfaces needed to be tested with drivers and stubs and breakpoints. All possible combinations and ranges of parameters can't be exercised at the functional‐test level. Integration tests had to be developed by someone familiar with the code, hence its name “white‐box testing.” However, integration testing is usually not considered to be a separate testing phase in Agile.
Agile integration testing still needs to be done if you want to make a serious dent in reducing rework. Interface changes often have significant code impacts across methods. This can be challenging because separate design documentation is usually not created in Agile; however, class definitions must exist in the code.
You should be able to extract a list of new or changed class definitions for methods shared by multiple developers. Class definitions within the scope of a single developer should have been verified as part of their unit tests. Define the parameter values and combinations required to fully verify other interfaces and then check them off if they have been exercised in the user story acceptance tests. If not, either add cases to the acceptance tests or create drivers and stubs to verify them. All the interfaces must be verified.
Improving defect removal efficiency should not be viewed as overhead in Agile development. Steve McConnell, in his book More Effective Agile, presents a solid argument for removing defects earlier to increase software development efficiency [4].
12.2.3 Agile Cost of Quality Example
Figure 12.3 shows an example of what you would see from a team motivated to reduce rework.
The team starts out highly productive because they are not carrying significant rework from past sprints. An ineffective product owner starts to drag down production after several sprints as functional testing exposes missing or incorrect requirements. Construction defects start to rise from prior sprints. Production has fallen from 66% to 26% by the sixth sprint. Productivity has decreased by (66 − 26)/66 = 61%.

Figure 12.3 Agile production ratio metrics.
Root cause analysis is performed on the stories in the rework and defect categories to make process improvements. The detail of unit story acceptance tests is increased. The product owner now sits with the team to be 100% available. The team sets a goal of 80% for unit test code coverage. Any exceptions must be approved by the technical leader after a detailed review.
By the 12th sprint, 73% of the team's effort is going toward new production, and they are performing at a high and steady rate.
Note that this chart does not track any changes in appraisal effort per the classical Cost of Quality model. Appraisal costs require hourly project tracking, which is not likely to go over well with an Agile team. And the data accuracy would be suspect. Focus on rework after “done.”
12.3 Summary
- Investment Net Cost of Delay can be minimized by improving software development productivity.
- There is no practical method to measure software unit productivity, but nonproductivity can be accounted for in the form of appraisal and rework costs. Production is what remains.
- There is a direct relationship between total productivity improvement and rework levels.
- Requirements errors and missing details were the biggest drivers of rework in Waterfall development. The same effect is observed in Agile development because of ineffective product owner implementations.
- Agile “rework” is encouraged during sprint development. Rework is as costly as Waterfall rework after a sprint is declared “done.” “Rework after Done” is a useful metric for continuous improvement to improve the product owner process and reduce software development defects.
- Agile “Rework after Done” can be measured by adding a user story field in your Agile development platform.
- Rework from construction defects can be reduced with improved reviews and testing.
- There are three distinct phases of testing, whether testers are embedded in the Agile team or external. Unit testing verifies code coverage, integration testing verifies interfaces, and functional tests verify requirements.
- Continuous improvement based on rework reduction metrics can more than double software development productivity.
- Metrics should be owned by the team and never used by management to judge performance or compare teams.
References
- 1 Feigenbaum, Armand V. (1956). Total quality control. Harvard Business Review (November–December), p. 34.
- 2 McConnell, S. (1996). Rapid Development: Taming Wild Software Schedules. Microsoft Press.
- 3 McConnell, S. (2001). An ounce of prevention. IEEE Software 18: 5–7.
- 4 McConnell, S. (2019). More Effective Agile: A Roadmap for Software Leaders. Construx Press.