Chapter 5
Inflation and Interest Rates
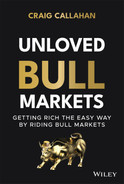
Figure 5.1 shows the twelve-month rate of change for the Consumer Price Index (CPI) from January 1970 to April 2021. At the left, it can be seen how quickly inflation accelerated in the 1970s, especially from 1977 to 1980. The peak was March 1980 at 14.8%. What may surprise many is how quickly it was reduced. Disinflation took only about three years, from that peak in March 1980 to August 1983, when it was tamed to a docile 2.6% over the previous twelve months. Since January 1983, as measured by the CPI, inflation has averaged only 2.64% over all of the rolling twelve-month periods through April 2021 (straight line). Disinflation wasn't a twenty- or thirty-year process; it took three years. There have been spurts of inflation since 1983 but nothing significant or sustainable. From the graph it seems so obvious that inflation was tamed and nothing to worry about.
Yet investors kept worrying about inflation returning. We have been doing presentations to financial advisor and investor audiences since 1991. The most frequent objection to owning stocks and bonds the entire time has been the fear that inflation was coming back and, therefore, interest rates were going higher. Those concerns have persisted during the recent multiyear bull market and kept many investors in cash. As evidence we point to mortgage brokers who have been successfully appealing to that fear by stating, “Refinance your home now before interest rates go higher.” That pitch worked by playing on people's persistent fears of increasing inflation and interest rates.
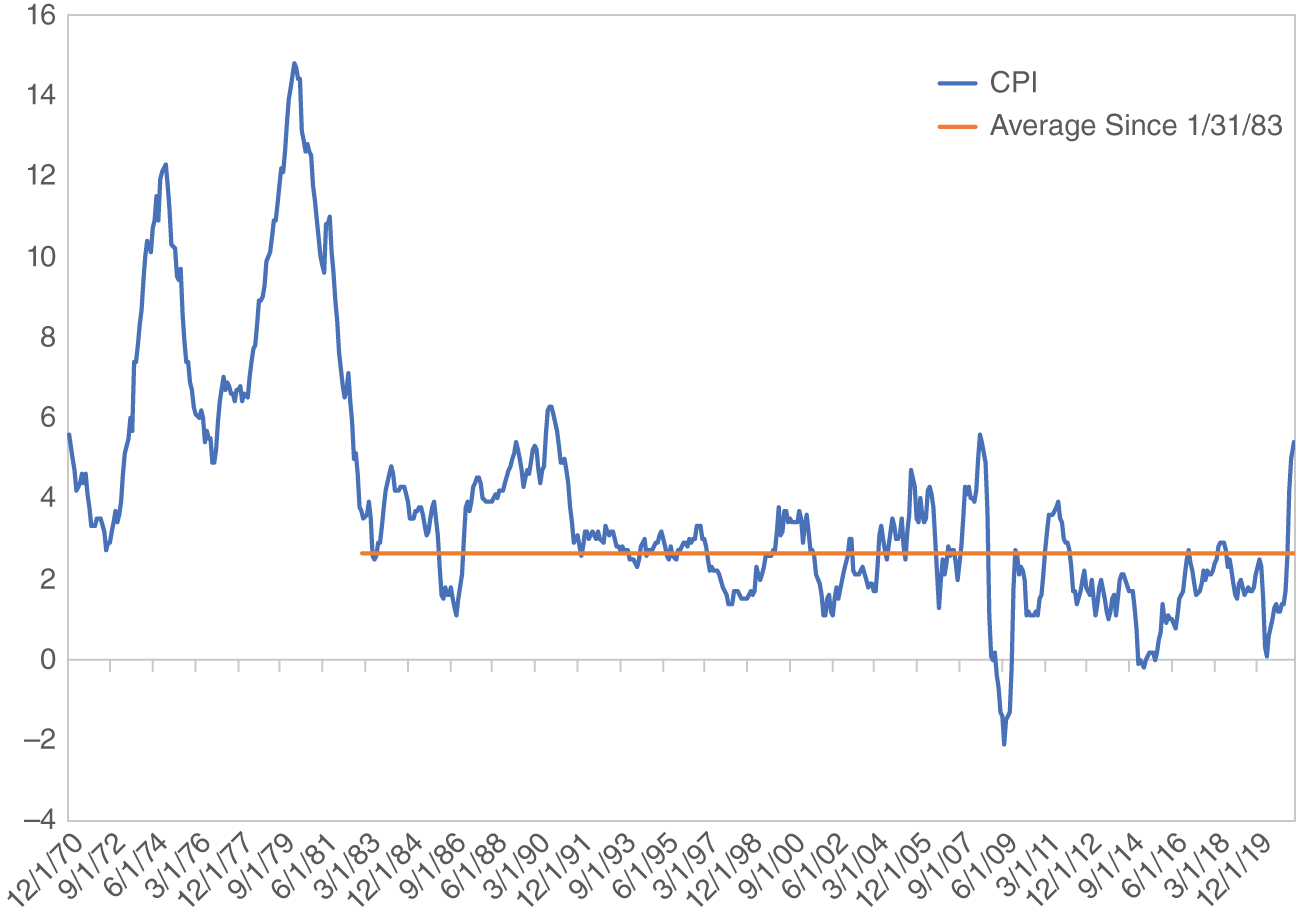
Figure 5.1 Twelve-Month Rolling CPI Rate of Change, 1/1970–6/2021
This first example of a predisposition to predict inflation is from June 2009, right near the bottom of the recession. With high unemployment you'd think the last thing to worry about would be inflation. Yet, in a Wall Street Journal article on June 8, 2009, entitled, “Land Mines Pockmark Road to Recovery,” Mark Gongloff wrote, “But the market for U.S. Treasury debt had its worst day in nine months, driven by worries about inflation and higher interest rates.” Then, two paragraphs later he went on a roll of conjecture, basically saying the side effects of inflation could halt the economic recovery. Because he was “preaching to the choir” (investors who feared inflation) it probably made sense to investors at that time. “A jump in economic growth, for example, could send commodity prices sharply higher. On Friday, oil briefly traded above $70 a barrel, due partly to economic optimism. Worries about inflation would cause interest rates to rise, hurting the housing market. Higher commodity prices could also be a drag on economic recovery, pushing job losses higher and leading to more mortgage defaults.” Wow! Doomsday, all because of inflation. Looking back, we now know inflation remained low and interest rates dropped.
Here is another example of expectations for higher interest rates, five years into the bull market, in an article in Fortune, June 14, 2014, entitled “The Real Reason Interest Rates Are Rising,” by Nin-Hai Tseng. “A curious thing is happening with interest rates. Since the financial crisis, the cost of borrowing have sunk to historic lows … But that's changing as rates are rising again.” … “And yet, as investors brace for what some say could be a new era of higher interest rates, global markets in bonds, currencies and stocks have experienced bouts of turmoil.” The presumption of higher interest rates proved incorrect. On Friday June 13, 2014, the day before the article appeared, the yield on the 10-year Treasury note was 2.604%. About seven months later, on January 30, 2015, it had dropped to 1.642%. As for short-term interest rates, the yield on the 13-week T-Bill was 0.084% on Friday June 13, 2014. It dropped to 0.032 % by September. A year after that article about rising rates the yield on the 13-week had inched up to only 0.091%.
A few more quotes from 2014 can help get a feel for how prevailing the expectations for higher interest rates were. On September 29, 2014, Bloomberg News reported, “Some of the world's most successful money managers say bonds are due for a tumble. Julian Robertson, the billionaire founder of Tiger Management LLC, said at the Bloomberg Markets Most Influential Summit this month that there's a bubble in bonds that will end ‘in a very bad way.’” Omega Advisors Inc. founder Leon Cooperman called bonds “very overvalued” and Howard Marks, the chairman of Oaktree Capital Group LLC, said interest rates are “unnaturally low.” In summary, these comments are saying bonds were priced too high and their yields were too low. A couple of weeks later on October 10, 2014, Bloomberg News reported, “Primary dealers had the biggest short position on benchmark government notes at the beginning of the month since last year's taper tantrum. It was the wrong bet: The debt has gained 1.5 percent in October as 10-year Treasury yields plunged to the lowest since June 2013.” Short positions in bonds are bets that prices will drop and yields will rise. The article continued, “‘Over the last year, what's sort of been the market's focus is everyone is bearish,’ preparing for rates to rise, said David Ader, head of interest-rate strategy at CRT Capital Group LLC.” A bubble in bonds? Overvalued bonds? Interest rates “unnaturally low”? Primary dealers short selling bonds? Looking back, all wrong but reflecting the intuitive, but incorrect, belief that interest rates should rise.
Stuck in the 1970s
In response to the questions about inflation and higher interest rates, we have offered data, graphs, charts, and logic to support the case for disinflation and lower interest rates. In hindsight, even though we were correct, the audiences never seemed fully convinced, because their gut feelings overruled the data, graphs, and charts we presented. We contend that the fear of returning inflation and higher interest rates is the biggest generational miss we will see, all a residual of the inflation jolt of the late 1970s.
Women have been known to observe that men stick with the haircut they had during what they remember to be the best years of their lives, whereas women often change their hairstyle. The inflation jolt of the late 1970s had a big impact on a generation and fixed their “economic hairstyle” on inflation and higher interest rates. Here is an example of how the Great Depression did the same thing to another generation. My father graduated from high school in 1931 during the Great Depression. Besides extremely high unemployment the depression also caused thousands of bank failures. My father never trusted banks and always carried an unusual amount of cash with him in case his bank would fail. Just as the depression of the 1930s molded a generation's views on banking, the inflation jolt of the 1970s did the same on young people of that era.
A similar view was stated in a Bloomberg Businessweek, September 23, 2019, article titled “Why We Love to Call Everything a Bubble” by Joe Weisenthal. He described Helene Meisler as a stock market columnist who's been active in the market for four decades and then quoted her, “I have often thought that we are all products of when we ‘grew up’ in the market. So, for example, folks who grew up in the ’70s are always looking for inflation. Those who grew up in the ’80s are always on alert for a crash.”
Phony, Fabricated, and Dangerous
How did the fear of inflation returning and interest rates rising affect investor behavior during the recent multiyear bull market? If a person has a powerful gut feel–based expectation that inflation will return and interest rates will rise, what does that person do when the opposite happens? The Fed eased monetary policy, but inflation, instead of increasing, dropped to 2%. Along with it, T-Bills went to near zero and the ten-year Treasury yield dropped below 2% when the investor expected inflation at 4%, T-Bills at 4%, and the ten-year Treasury yield near 6%. We found ourselves in a completely opposite world, in terms of inflation and interest rates, than most investors expected.
What do you do? Well, the investor could admit being wrong, but most couldn't. It is easier for investors to say the world is wrong than to admit their intuitive-based forecast was wrong. Instead, they reasoned that this new setting was phony, fabricated, and dangerous because it disagreed with their gut feeling. What would an investor do who thought the interest rate setting was phony, fabricated, and dangerous? Probably be cautious and even sell stocks and watch stock prices move higher while sitting on the sidelines.
Here is an example, from an advisory letter. The author (Carl) did very well over the years for himself and his followers by analyzing individual stock situations. He continues to write market and economic commentary to his followers, which requires a totally different skill set that he lacks. On February 10, 2020, he wrote, “The stock market has surprised me over the last two years. I did not expect interest rates to remain down as long as they have.” Over the two years leading up to that writing, the S&P 1500 Index gained 31.2%. Apparently he missed that impressive gain because of an expectation that interest rates would not remain low but would increase. He is not alone because the view that low interest rates were phony, fabricated, and dangerous was quite common.
Negative Interest Rates
In the later years of the eleven-year unloved bull market negative interest rates appeared. Investors had never seen them before. As just stated, in a setting where some investors thought low interest rates were phony, fabricated, and dangerous, negative interest rates just added fuel to that fire. In November 2016, we wrote a paper to address that topic and essentially to tell investors not to worry about them.
That was November 2016. The bull market continued, charging on despite negative interest rates. We assume investors owning those “negative rate” bonds wished they had owned stocks instead.
Why Didn't the Easy Monetary Policy Ignite Inflation?
Think of inflation as compounding price increase on top of price increase on top of price increase and so on. A one-time price increase is not inflation.
The inflation jolt of the 1970s took about twenty to thirty variables to all line up and fall in place. The large baby boomer generation needed starter housing, along with other goods and services not already there for them. They demanded goods and services immediately. Price was no problem, so prices went higher and higher. On the flip side as a young workforce, they were demanding and even belligerent. Workers in their twenties are much more likely to go on strike than workers in their forties and fifties, who value security. Oil prices had risen with OPEC rising in its strength and power. The list, which formed a perfect storm for inflation, goes on and on, and as stated, it probably meant twenty to thirty variables all lining up. We have not had all those conditions lining up the last few decades, maybe one or two here and there, but not all together. Over the last three decades, if a company raised its price, the executive would hide under the desk hoping the price increase held. During this multiyear bull market the foundations for inflation were not in place, yet stuck in the 1970s, investors continually worried about it.
Capacity Utilization
We were at a conference in Phoenix a couple of years into the recovery, and after our presentation a financial advisor came up with the familiar view that inflation was returning and interest rates were going higher. He reasoned that the expansive monetary policy would fuel inflation. He even issued a statement he had probably memorized for a college economics exam, “too many dollars, chasing too few goods.” The problem with his reasoning was that there was not “too few goods.” At that time and still today, we can make more of anything we want. There are no shortages, which fuel price increases. You want more software or hardware? No problem. You want more blue jeans, windows, roof tile, or automobiles? No problem. We can make more of anything. It should be noted that in spring and summer 2021, there were some shortages in a few products such as semiconductors and lumber, but that appears to be more a function of businesses being surprised by the robust economic recovery than long-term capacity issues.
Figure 5.2 shows capacity utilization 1967 to 2021. Capacity utilization tracks the extent to which the installed productive capacity of a country is being used in the production of goods and services. It drops sharply during recessions: 1969, 1974, 1982, 2001, 2008, and 2020. Those aside, it has been trending downward the last few decades. During the eleven-year bull market, it was in the 75% to 79% range, whereas in the 1970s it was over 85% at peaks. It is difficult for inflation to get a toehold when there is excess capacity for production and therefore no shortages.

Figure 5.2 Capacity Utilization
2009 Outlook
In 2009, we put out a short research report on inflation. It showed how recessions reduce inflation. We made the case that inflation could stay low for a few years following 2009.
That report, written and distributed in mid-2009, proved correct because inflation remained low. The average annual increase in the CPI for 2008 through 2011 was even lower than the 1.96% predicted. It was 1.78%. Even through 2018 it was 1.63%. Indeed, the recession of 2008–2009 did knock down inflation just as previous recessions had done, which created a very forgiving setting for monetary expansion.
Velocity of Money
The monetarist school of economics has an equation to explain total spending: MV = PQ, where M is the money supply, V is the velocity of money (or the number of times that a dollar turns over), P is the general level of prices, and Q is the quantity of goods and services acquired. The left side says that total spending is the amount of dollars times the number of times they turn over. The right side defines total spending as the price of goods and services times the quantity.
If the money supply is increased and velocity stays constant something on the right side has to increase. Either prices increase or we increase the output of goods and services or some combination of the two. During the recovery from the 2009 recession the Fed promoted growth in the money supply. In the next chapter it will be shown that at times the money supply was experiencing 20% Y-O-Y growth. So why didn't the growth of the money supply cause higher inflation? Let's look at Figure 5.3, which shows the velocity of money from 1959 to 2021.
As discussed, there was excess capacity for production so the Q, or quantity part of the MV = PQ, could grow. But another funny thing happened on the way to recovery. The velocity of money declined as seen in the chart of Bloomberg Velocity of M1 1959 to 2021. At the economic peak late 2007, a dollar turned over 10.68 times, but then turnover dropped over the next eleven years to just 5.51 times. Velocity of money slowed and there was excess capacity to produce goods and services. Net result: no or minimal inflation.
Finally, velocity fell off a cliff in 2020 to slightly greater than 1.00 with the self-imposed economic shutdown and recession. The Fed increased the money supply but in the stay-at-home world, consumers weren't spending. From 2007, velocity of money has dropped from around 10 to 5 to 1. There are some theories as to why it has dropped. One points to the increasing wealth gap over that time between the most wealthy and the lower and middle incomes. It states that the lower and middle incomes spend most or all of their income, whereas the most wealthy do not. Another theory points to the large population of baby boomers, who don't spend like they used to. It is beyond the scope of this book to explain the decrease in velocity. We just believe it was a contributing factor to keeping inflation very low.
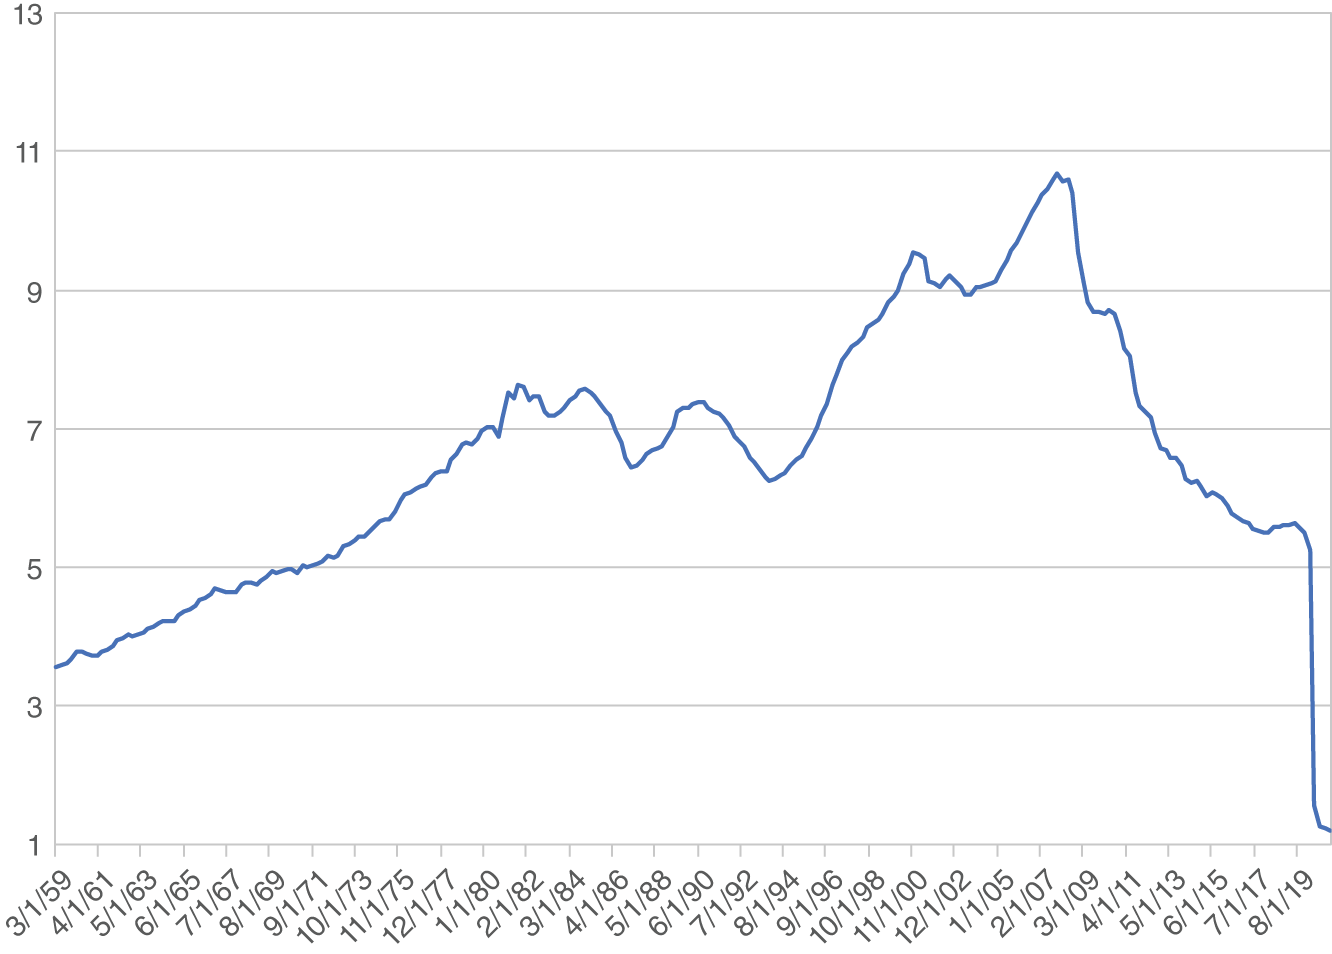
Figure 5.3 Velocity of M1 (Money Supply), 1929–2021
Are Low Interest Rates Rational and Normal?
In a letter to investors in January 2013, we wrote, “Currently, we do not see pressure for interest rates to rise significantly. In fact, we believe rates can remain low for many years.” Then, regarding stocks, we concluded, “The stock market has just about recovered its losses from the bear market and recession of 2008 and 2009. We believe it is only about halfway through an advance that will take it to new highs.”
What was the basis for the belief that “we believe rates can remain low for many years?” It was based on the view that the expectation for inflation is the primary determinant of long-term interest rates. With our expectation that inflation would remain low it followed that interest rates would remain low.
Figure 5.4 shows the yield on Moody's AAA bond index for year-end 1929 to 2020. The chart is dominated by the ascent to the peak in 1981 when investors saw inflation increasing, followed by the thirty-nine-year decline as investors gradually realized disinflation was prevailing. What's normal? We believe the settings for the ascent and decline are unusual and the low steady periods are normal. In 1934, the yield dropped below 4.00% and stayed below 4.00% for twenty-four years, 1934 to 1957. In 1939, the yield dropped below 3.00% and stayed below 3.00% for fourteen of the next sixteen years, 1939 to 1954. So rates can go low and stay low for many years, a condition we labeled “the old normal.”

Figure 5.4 Moody's AAA Bond Yield, 1929–2020
Summary
At various times during the bull market when the Fed promoted rapid growth in the money supply many investors expected high inflation would result. Fearing higher inflation, and the resulting higher interest rates, would hurt stocks, they sold and got out of the multiyear bull market. We contend their reasoning was influenced by the fear of inflation left over from the 1970s. Then, when inflation and interest rates went opposite of their expectations, they reasoned the setting was dangerous, resulting in mistrust and more selling of equities. If they could have just realized that low inflation was sensible, they could have also realized that low interest rates were sensible. Instead, gut feel and intuition prevailed, the bull market was unloved, and many investors missed out on the opportunity to accumulate greater wealth the easy way.
- There was a powerful gut-feel expectation for inflation and rising interest rates.
- Unexpected low interest rates must have seemed phony, fabricated, and dangerous
- Negative interest rates cause no problems.
- There was a capacity to produce more, with no shortages.
- Recessions lower inflation.
- Velocity of money declined.
- Low interest rates were sensible and rational.