Chapter 15
I Want My Money Back
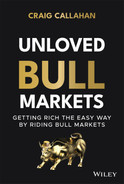
In Chapter 14, Figure 14.1 showed the S&P 1500 chugging its way higher in 2019 and early 2020 and then the swift and severe twenty-three-trading-day crash. As a continuation, Figure 15.1 shows the S&P 1500 Index from its precrash peak of February 19, 2020, through September 10, 2021. The post-crash rally is so spectacular that the crash doesn't look so stunning any more. Two lines are on the graph because the rally changed personality midway through. From March 23, 2020, through September 2, 2020, the market resembled the previous eleven-year bull market in many ways. Then after about a two-month sideways pause, it emerged from an October 30, 2020, low with many different traits and behaviors.
In Chapter 3, we showed how the stock market typically leads the economy by six to nine months and that the economic news is bad at bottoms and good at peaks. We showed how unusual the peak in 2007 was in that the news led the market. Investors who sold on the first bit of bad news got rewarded and potentially avoided the bear market of 2008–2009. They learned a lesson and behavior that proved costly during the great bull market, because selling on bad or disappointing news prohibited the investor from participating in subsequent rallies. Similar to 2007, selling on the first bit of bad news about the virus worked again in February 2020. It is likely that there is a new generation of investors that continued the behavior of waiting for good news before buying into the new bull market. As a result, many investors did not participate in the spectacular rally.
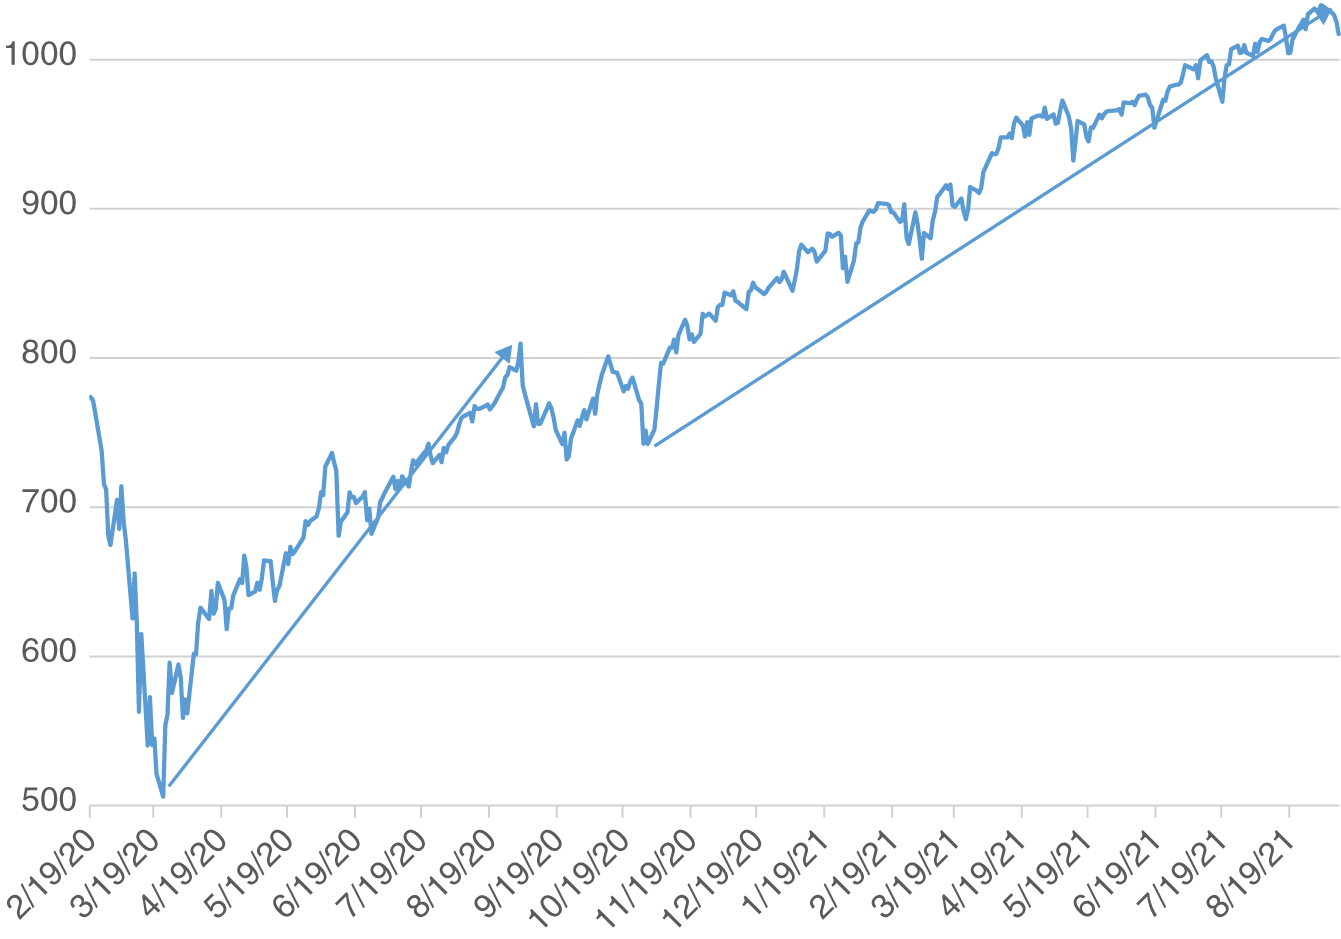
Figure 15.1 S&P 1500 Index
Unloved Rebound
Figure 15.2 is the bull/bear ratio weekly for the AAII Investor Sentiment Survey beginning the first week of January 2020. The reading the week of the stock market peak was below the historic average. There were higher readings earlier in the year but still below the one standard deviation line. Notice how fast sentiment deteriorated during the crash. It is normal that it was one standard deviation below its historic average at the bottom, but it is extremely unusual that it didn't improve as the market advanced. The S&P 1500 gained 61.32% from March 23 to the then all-time high September 2, 2020, and sentiment remained extremely bearish. Usually a market advance of that magnitude would attract investors and they would turn bullish, but not this time. Investors were scared and dug in. This surely qualifies as at least as “unloved” as the prior eleven-year bull market.

Figure 15.2 AAII Sentiment, Bulls/Bears 1/2/20–9/10/21
In late October and early November the sentiment changed from bearish to bullish when successful vaccine tests were announced and after the S&P 1500 Index had gained 62%. From that quick jolt of optimism, sentiment slid back down below its historic average. The subsequent increase in bullish sentiment was concurrent with Congress finally passing a fiscal stimulus package. It appears many investors didn't have advanced faith in medical researchers to develop a vaccine or for Congress to pass an obviously necessary stimulus package. As for sentiment to change, they waited for those events to actually happen. By the time the bull/bear ratio got above one standard deviation of its historic average for the second time in late March 2021, the S&P 1500 had gained 80.7% in slightly over one year. As we stated, “rallies don't issue invitations” and “they are usually disguised.”
Money Market Fund Assets
Figure 15.3 shows total assets in money market funds weekly from December 31, 2018, through September 9, 2021. During 2019, investors were gradually adding to their money market holdings, perhaps taking profits from the long bull market in equities. In March 2020, however, there were huge flows into the safety of money markets when the stock market was crashing. The subsequent turnaround and gradual descent in money market assets in 2020 is very similar to the sluggish decline of 2009 at the beginning of that bull market, suggesting the initial 2020 rally was at least as unloved as the early 2009 bull market. If investors had correctly realized the stock market was about to go on an impressive eleven-year bull market in 2009 and realized there would be a sharp rally in 2020–2021, money market assets would have rapidly declined both times. But instead, both times investors were slow to take money out of money markets to buy stocks. Worse yet, in 2020 money market assets did not reach a peak until late May, two months into the rally in equities. In other words, it appears investors were selling into the rally during its first two months and moving to safety rather than buying into stocks. Money market assets the first five months of 2021 resembled 2019, increasing, suggesting investors were selling stocks and moving to safety as the stock market moved higher.

Figure 15.3 Money Market Fund Assets 1/2/2019–9/9/2021
It wasn't just individual investors. Based on interviews on TV and in the print media, many professional money managers were bearish as well and unable to recognize the new bull market. There were many reasons for being bearish and missing out. Some investors wanted to wait to invest until a vaccine had been produced. Other investors doubted a vaccine could be created in a year. Off the March bottom, many observers argued the market would have to retest its low and waited for a “double bottom,” which never happened. Some took an economic forecasting approach and only saw a bottomless pit. There were predictions from notable Wall Street economists for unemployment to exceed 20%. There were doubts that the combination of monetary and fiscal stimulus would be effective as we frequently heard a skeptical phrase mentioned previously in the book, “it was like pushing on a string.” The most frequently heard reason for a bearish posture was valuation and sounded just like the incorrect claims during the 2009 to 2020 bull market. They claimed the P/E on the market was too high. To address the P/E concerns, here is a paper we distributed in the summer 2020.
Sectors
Sector index performance during the first five months of the 2020 rallied, as shown in Table 15.1, and revealed a classic economic recovery anticipation rally. The leaders were economically sensitive and cyclical. The laggards were the so-called recession-proof, defensive sectors. Investors participating in this impressive rally weren't looking at the current economic data; they were looking for improvement six months or so into the future. In other words, they were saying, “Things are going to be better than is currently priced.” Investors sitting on the sidelines holding cash didn't have that faith.
Some observers, presumably those who were in cash missing the rally, tried discrediting the advance by claiming the only stocks participating were a handful of “work from home” or “stay at home” stocks. These are companies that actually benefited from the shutdown, such as Amazon.com making home deliveries. The sector returns, however, indicate broad participation. Similar to the 2009 to 2020 bull market, the leadership was composed of high beta (volatility) sectors, whereas the trailing sectors are made up of low beta stocks. Similar to the previous eleven-year bull market, investors who accepted and tolerated volatility got rewarded.
Table 15.1 Sector Returns
| 3/23/20–9/2/20 | 10/30/20–9/2/21 | ||
|---|---|---|---|
| Sector | Return (%) | Sector | Return (%) |
| Consumer Discretionary | 82.9 | Energy | 78.9 |
| Information Technology | 80.4 | Financials | 61.5 |
| Materials | 73.3 | Real Estate | 48.9 |
| Industrials | 65.3 | Communication Services | 46.8 |
| S&P 1500 Index | 61.3 | Information Technology | 44.6 |
| Communication Services | 57.2 | Industrials | 41.7 |
| Energy | 50.9 | S&P 1500 Index | 41.4 |
| Health Care | 48.0 | Materials | 40.3 |
| Real Estate | 45.8 | Health Care | 36.1 |
| Financials | 45.0 | Consumer Discretionary | 29.4 |
| Consumer Staples | 38.7 | Consumer Staples | 20.8 |
| Utilities | 34.6 | Utilities | 16.2 |
As discussed in Chapter 4, it is normal for an economy to first recover and then expand coming out of recession. We suggested during the eleven-year bull market the economy struggled with the expansion phase. The first five months of the 2020 rally priced in recovery and the sector performance resembled that of the eleven-year bull market with information technology and consumer discretionary sectors leading. That is where investors could find growing earnings in a moderate economy. After the September–October pause, however, investors priced in expectations of a robust expansion. Energy and financials moved from the bottom half to being the top two sector performers. Real estate was third and industrials beat the S&P 1500. Investors could easily find impressive expected earnings growth in those leading sectors in the expansionary setting they were anticipating. Information technology fell to fifth and consumer discretionary moved to the bottom half along with defensive, recession-proof sectors. Notice during this second phase investors participating in the leadership had to embrace the economy and have faith in economic expansion. They didn't do that during the eleven-year bull market and hadn't done it since 2005 to early 2007. Embracing the economy and believing in an expansion was new for them.
Strategies
Chapter 12 presented ten investment strategies and showed how they performed during the 2009–2020 bull market relative to their historic performance. During that bull market, future growth and competitive position led as they have historically. Risk, economic conditions, and market conditions lagged, as they have historically. Social consideration and valuation reversed roles with social consideration being among the leaders with valuation lagging. As seen in Table 15.2, the first five months of the rally off the March low of 2020 were quite similar to the previous bull market with future growth, competitive position, and social considerations being the top three. The strategy data come out monthly and do not line up exactly with the daily low and high, but they are close. Similar to during the eleven-year bull market, risk and market conditions lagged and so did valuation again, unlike its historic ranking. Similar to the eleven-year bull market, it was a difficult setting for active managers because the average active manager lagged the S&P 500 Index and only two strategies beat that index.
Table 15.2 Strategies
| 3/31/20–8/31/20 | 10/31/20–8/31/21 | ||
|---|---|---|---|
| Strategy | Return (%) | Strategy | Return (%) |
| Future Growth | 46.4 | Valuation | 44.7 |
| Competitive Position | 37.6 | Quantitative | 41.9 |
| S&P 500 Index | 36.5 | Competitive Position | 41.2 |
| Social Considerations | 35.8 | Average Active | 40.9 |
| Average Active | 34.9 | Profitability | 40.7 |
| Quantitative | 34.3 | S&P 500 Index | 40.1 |
| Economic Conditions | 33.3 | Social Considerations | 39.3 |
| Market Conditions | 31.2 | Market Conditions | 38.8 |
| Valuation | 29.7 | Future Growth | 38.4 |
| Profitability | 25.7 | Economic Conditions | 37.2 |
| Risk | 25.2 | Opportunity | 36.7 |
| Opportunity | 22.9 | Risk | 29.5 |
After the eleven-year bull market, we should be used to this: low investor sentiment suggesting investors do not believe in the rally. The investors who did buy in favored fast-growing (future growth), well-managed, innovative (competitive position) companies. Perhaps they felt they could get their arms around those elements. Just the opposite, it appears investors didn't have enough faith to buy a stock just because it was cheap (valuation). Those investing but trying to minimize risk (risk) missed out as did investors using charts and momentum (market conditions). At the bottom of strategy performance, opportunity managers are very situational and deal to deal, so they missed out on the broad advance. In Chapter 11, we provided a guess that the three most popular strategies among individual investors are valuation, economic conditions, and market conditions. Some may like to buy bargains using readily available valuation data. Some may think they have an informed view of the economy, and some may like to use technical analysis and momentum. But these three strategies weren't working well during the first five months of the 2020 rally, so, with their systems not working, investors may have concluded the rally wasn't sensible or sustainable and sat on the sidelines.
What a complete change after the two-month pause of September and October 2020! From October 31, 2020, through August 31, 2021 (monthly data), valuation took the lead as the best-performing strategy. Profitability jumped into fourth. Future growth dropped to fourth from the bottom. Also note that the average active manager beat the S&P 500 Index as did four of the ten strategies. Did active managers all of a sudden get smarter or work harder? No. A variety of conditions captured in Howard's Active Equity Opportunity (AEO) Index described in Chapter 11 changed. In fact, that index suggested a favorable setting for active managers because there were occasional spikes in the VIX Index, returns among stocks became more dispersed, and skewed and small-cap stocks became the new leaders.
Combining strategies and sectors, the first five months of the 2020 rally resembled the eleven-year bull market. Information technology and consumer discretionary led and were very rewarding to managers employing the future growth, competitive position, and social consideration strategies. It was not a good setting for active managers in general and was as equally “unloved” as the eleven-year bull market. After October 2020, energy and financials led, which was rewarding to managers employing the valuation and profitability strategies. Along with that change, there was a little more bullish sentiment. Perhaps investors can embrace the expansionary theme better than the recovery theme.
Monetary Policy
During the second half of the 2009 to 2020 bull market with low interest rates, many believed the Fed would be helpless if it needed to stimulate the economy. Based on the belief that lowering interest rates is the basis for stimulating the economy, the skeptics argued with rates so low the Fed was out of ammunition. In Chapter 6, we explained that it isn't interest rates that boost the economy but the money supply and that the Fed had three tools to boost the money supply: open market operations, the Discount Window, and lowering reserve requirements. The first two can inject reserves into the banking system, even when interest rates are very low. All three tools enable banks to make more loans, which creates money. Figure 15.6 shows the fifty-two-week rate of growth in the money supply, M1, from October 28, 2016, through February 12, 2021. Initially the Fed was gradually reducing the rate of growth of M1. This bothered investors and finally triggered the volatility event of fall 2018. In 2019, the Fed lowered the Federal Funds rate by injecting reserves three times, which got M1 fifty-two-week rate of growth back up to 6% to 7% by February 2020. In March 2020, as it became apparent the economy would have to be shut down, the Fed kicked into gear. They lowered the Federal Funds rate, injected reserves, and M1 fifty-two-week rate of growth increased to over 40% in a few weeks. This certainly shuts down the theory that the Fed is out of ammunition when interest rates are low. They weren't done yet, still having more stimulus capabilities. As Congress seemed politically stalled over a fiscal stimulus package fall 2020, the Fed again injected reserves, banks made loans, and the fifty-two-week rate of growth for M1 increased to 70%. It isn't interest rates that stimulate economic growth, it is M1, and the Fed delivered. We can only guess that investors who thought the Fed would be out of ammunition in a low interest rate setting missed the rally.

Figure 15.6 Fifty-Two-Week Rate of Change in M1, 12/28/18–2/12/21
Pace
In Chapter 10, it was shown that the faster the pace of a bull market, the more difficult it is for managers to keep up with indexes. From the bottom, March 23, 2020, to the short-term peak, September 2, 2020, the S&P 500 gained 61.38% over 114 trading days. That pace is .54% per day, over double the pace of the three fastest bull markets shown in Chapter 10. As seen in the strategy performance table, the average active manager gained 34.9% and trailed the S&P 500 Index, which was up 36.5%, again based on monthly data. If we had strategy performance data to the day, we suspect the active lag would be worse. The market surged 15.6% the last six trading days of March and caught many managers holding cash and defensive equities. Nevertheless, the first five months of the 2020 rally just add support to the evidence that the faster the pace, the more difficult it is for active managers.
During the second phase and the 211 trading days from October 30, 2020, to the short-term peak September 2, 2021, the S&P 500 Index gained 41.4% for a pace of .20% per day. This slower pace was more favorable for active managers but probably doesn't explain their success as much as the other factors (AEO Index) mentioned in the previous strategies section.
Down Days
In Chapter 2, it was shown that from the bottom to the top of a bull market, the market goes down 44% to 46% of the trading days. The topic was presented to show that the eleven-year bull market was very typical and that bears got incorrect “bearish” confirmation two to two and a half days per week. What about the bull market of 2020? Through its first 134 trading days, the S&P 1500 Index dropped fifty days, or 37.3% of the days. Also in Chapter 2, it was shown that if an investor could just be invested on the best days, it only takes about 2.3% to 5.1% of the total days to get the return of the entire bull market. Through the first 134 trading days of the 2020 rally, we see a different personality than usual. If an investor could have been invested in just the best days, it would have required being invested in 7.5% of the 134 days. With fewer down days and more best days required, the 2020 rally was more of a straight, steady ascent than other bull markets. Investors in cash had to chase it, at higher and higher prices, and short sellers just kept repurchasing (covering) their short positions. Maybe this bull market will go on a few more years. Maybe by then it will look more like typical, choppy bull markets, but in its initial phase, it didn't disguise itself with down days as most bull markets do. It was more of an obvious rally, just unloved.
As for the second phase, the market went down 40.8% of the 211 trading days, closer to the historic average for bull markets and just enough for the skeptical investor on the sidelines to get incorrect confirmation that cash was best.
Economic Surprise
In Chapter 4 there was a graph of the Citi Economic Surprise Index. It was there to show how economists rapidly revised their forecasts during the eleven-year bull market. It suggested some investors might have missed the bull market because they just couldn't get their arms around the economic outlook. Figure 15.7 is an updated version of that same graph from January 3, 2020, through July 23, 2021. The Surprise Index (black) is scaled on the left. The zero line down the middle is when forecasts were accurate with data neither better nor worse than forecast. The S&P 500 Index (gray) is scaled on the right. Leading up to the stock market peak in February 2020, the economic data were generally better than economists had forecast. The market crashed and then the terrible economic data that followed in April and May were much worse than had been forecast. Looking down a “bottomless pit,” economists then revised their forecasts downward, way down and too far. From June 2020 through the next twelve months, economic data were better than forecast. They forecasted a horrible economic setting and were wrong. Just to show how far off they were, during the eleven-year bull market the extreme readings for the index when economic data were better than expected were in the 70 to 90 range. In summer 2020 the index hit 250. In terms of the stock market, the crash went too far and priced in a horrible economic setting that didn't happen. Repeating a quote from the book's Introduction, Craig told CNBC TV a few days after the crash. “We do believe a bottom is forming and it seems like all the bad news is priced in.” As the subsequent data showed the economy to be bad but not horrible, as previously priced, the stock market rally was very sensible.

Figure 15.7 Economic Surprise and S&P 500 Index
Unemployment
Unemployment can serve as an example of economic data that ended up being not as bad as forecast, but first a little background. As discussed in Chapter 7, during the eleven-year bull market many investors didn't participate because they thought unemployment wasn't improving fast enough. Figure 7.2 lined up the peak months of unemployment for the recessions of 1982 and 2009. In both cases unemployment improved at a similar pace. Both times, investors complained it was not improving fast enough, which was apparently irrelevant because in both cases the stock market moved higher.
Figure 15.8 compares unemployment for the recessions of 2009 and 2020. In 2009, there was a gradual buildup, but not in 2020. It was sudden as virus containment measures shut down the economy very rapidly. In 2009, it took twenty-six months from the peak to get unemployment down to 8.4% or better, but in 2020 it took just four months. Both times the stock market moved higher. In 2020, however, rapid improvement in unemployment and the stock market rally were still not enough to get investors off their bearish sentiment. Some investors picked up on the rapidly improving economy and the fact that it was better than had been forecast, but many investors didn't.
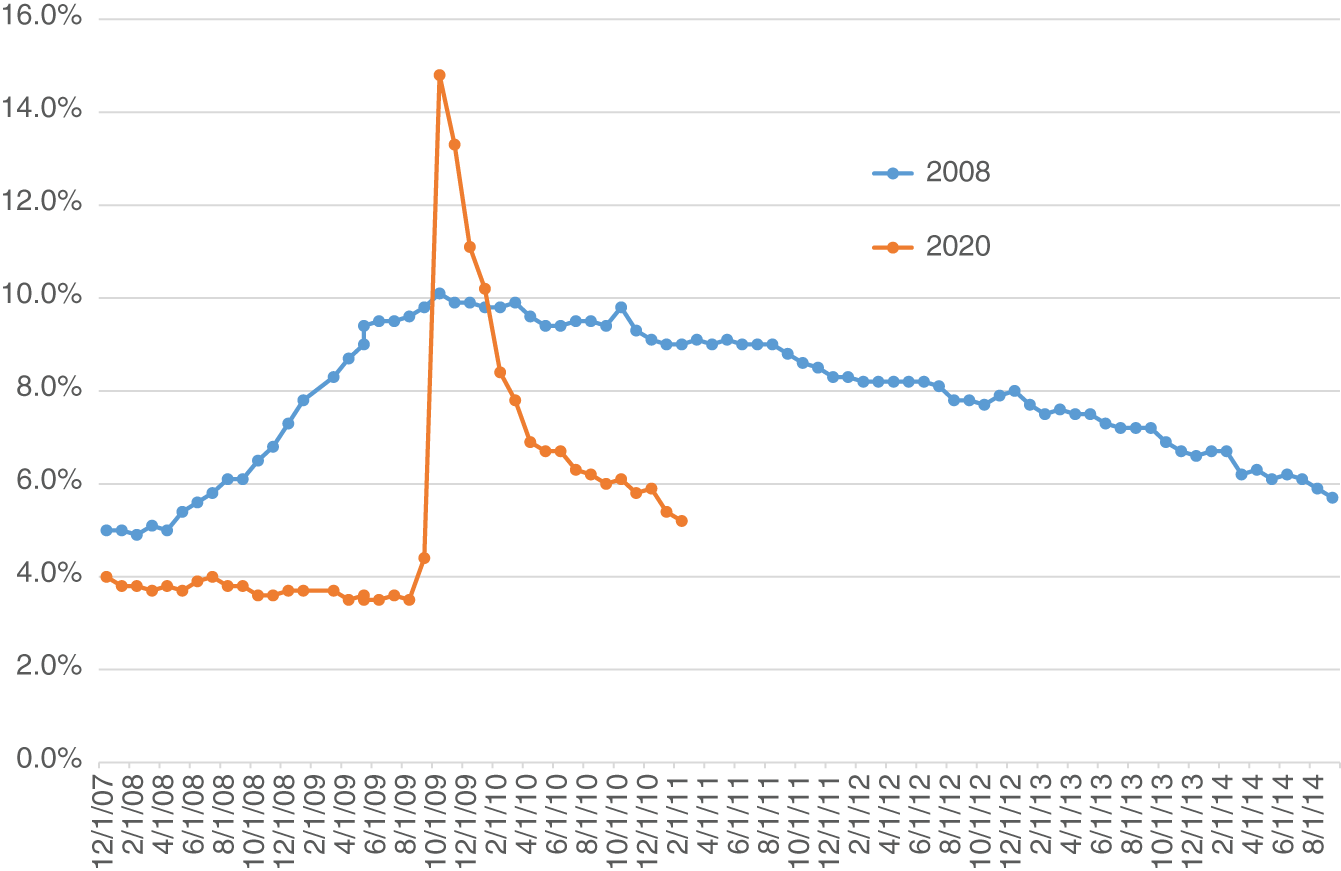
Figure 15.8 Unemployment, 2008 and 2020 Recessions
Value and Sentiment
We have developed a chart in Figure 15.9 to relate value and investor sentiment, which helps explain why the bull market of 2009–2020 and the rally of 2020 were sensible. The outer circle shows investors’ view of the economy, ranging from perfect in the upper right to horrible in the upper left. The next circle presents various levels of investor sentiment ranging from greed in the upper right to frightened in the upper left. The second circle from the center is the ICON Market Value/Price (V/P) ratio. As described in Chapter 2, ICON estimates intrinsic value for more than 1,700 domestic stocks and divides that value by price. The market V/P is an average V/P of all the stocks in the database. The .8 V/P in the upper right would indicate that an investor buying $1.00 of stocks would be acquiring only 80 cents of value. In the upper left, a V/P of 1.49 would mean an investor is getting $1.49 of value for every $1.00 invested. Finally, the innermost circle just describes the degree stocks are over- or underpriced relative to fair value.
Figure 15.9 Value and Investor Sentiment
In the upper right, why would investors be willing to invest $1.00 but only get $.80 to $.89 of value in return? Sure stocks are overpriced but investors believe the economy is perfect and greed has taken over. Moving clockwise, if investors think the economy is great, but not perfect, they will be optimistic and still willing to pay more than fair value for stocks. The market V/P of .90 to .99 suggests stocks are modestly overpriced. Continuing clockwise, investors’ view of the economy deteriorates. Accordingly, sentiment declines and better and better bargains are available in the stock market.
After the crash of 2020, we were clearly in the upper left section. Similarly, at the beginning of the eleven-year bull market and during the European debt crisis rounds one and two, investors were in the upper left. They apparently saw a horrible or bad economy, were frightened and scared, and gave us an opportunity to buy stocks deeply and extremely underpriced. Most of the time during the eleven-year bull market, however, they saw the economy to be okay to good, displayed sentiment of cautious to neutral, and stocks were priced a bit below fair value.
Maybe investors missed the eleven-year bull market and the rally of 2020 because they were waiting for the economy to be good, great, or perfect, but the economy does not have to be good, great, or perfect for stocks to rally. It just has to be better than what was previously priced in. If investors price stocks for a horrible economy, and it turns out to be just bad, stocks can rally. Then, if investors price in the expectation for a bad economy and it turns out to be just mediocre, the rally can continue. All it takes to ignite a rally is for the economy and the accompanying news to not be as bad as was previously priced in.
Top Ten Reasons
In Chapter 1, we showed how we borrowed from “The David Letterman Late Night Show” early into the eleven-year bull market and tried coaxing investors to get invested. Let's apply that approach to the 2020 rally and look at the top ten reasons investors missed it.
- 10. I was waiting for a double bottom.
- 9. There were conflicting calls for the economy to be a V, a U, an L, a K, or even a Swoosh.
- 8. I forgot the expression, “Don't fight the Fed.”
- 7. I was waiting for everybody to get vaccinated.
- 6. I was uncertain about the 2020 election.
- 5. I was busy and in over my head with home schooling.
- 4. Unemployment was not dropping fast enough.
- 3. I thought government deficits would cause inflation and higher interest rates.
- 2. I got scared out (near the bottom) and didn't get back in yet.
And the number one reason I missed the 2020 rally:
- 1. I heard P/E ratios were too high.
Summary
From the low of March 23, 2020, to September 2, 2021, the S&P 1500 Index gained 109.6%, meaning it more than doubled in seventeen months. Raise your hand if you recognized the opportunity, put all your assets into equities in late March 2020, and then doubled your worth. We expect that if you are raising your hand you may be alone. What would it have taken to be correctly bullish and invested early on and throughout the rally of 2020–2021?
First would be recognizing a market bottom and having the courage to buy in. There is an old saying on Wall Street that it is time to buy stocks when “there is blood in the streets.” Late March 2020 certainly qualified. The news was bad and getting worse. Economists were rapidly and severely revising their forecasts downward. To buy into that bottom, the investor would have had to realize that stocks had fallen too far and priced in a horrible setting that was not going to happen.
Also, various situations needed to be handled to be invested. It was important to recognize that the Fed jolted the money supply and then believed that the jolt would be effective. In terms of a vaccine, it was necessary to realize that there were a lot of really smart, highly motivated people trying to develop a vaccine and that they would succeed. Perhaps most important to be correctly bullish was to ignore the claims that stocks were expensive based on P/E. After recognizing those situations, being invested just required being patient and tolerating volatility.
Here is our commentary from our April 2020 Portfolio Update, written the last week of March.
As for the stock market, we believe a bottom is forming. Our market value/price (V/P) ratio is at an all-time high and we are seeing many other behaviors and data often seen at bottoms: negative (bearish) investor sentiment, high correlation among sectors, high volatility, decreasing breadth on declines, and, as mentioned, monetary easing and fiscal stimulus. We do not know the exact day of the bottom, but we expect it to be before we see the worst of the news regarding the virus and the economy. This would be consistent with the market's reputation of leading the economy by six to nine months.
Then out of the depths of doom, gloom, and uncertainty the rally unfolded.
- The rebound was very fast.
- As seen by sentiment and money market assets, this rally was as unloved as the previous bull market.
- P/E again proved unrelated to future returns.
- The new bull market had two phases: recovery then expansion.
- Economic data were better than forecast.
- Rallies don't need good news, just better than previously expected.