Chapter 9
Volatility Events
We have given the name volatility event to a certain situation in the stock market. Stock prices drop about 16% to 20% over about twelve weeks, then recover and resume the long-term upward path they were on before the volatility event. During the descent and especially at the bottom, there is a specific concern that is very well known by investors. In fact, they are focused on it. This is different than the beginning of a bear market when investors are usually baffled by the stock price declines because there is no obvious cause. Volatility events are triggered by news, whereas bear markets begin for no apparent reason. We believe volatility events are unpredictable. They have occurred in 1990, 1998, 2010, 2011, and 2018. Notice there were three of them during the post-2009 bull market. These are agonizing and painful for investors. Having three of them in one multiyear bull market sure contributed to the “unloved” nature. We suspect many investors sold during them and never returned.
Figure 9.1 shows the S&P 500 Index a few months before and a few years after the volatility event of 1990. When Iraq invaded Kuwait, it caught investors by surprise and sent the market into a twelve-week tailspin. There was a sharp decline, an almost equally fast recovery, and then a resumption of the long-term trend. The straight line emphasizes how the sharp drop was just an unpleasant interruption in the long-term trend. At the bottom of all volatility events, it seems like there is no way out. It is difficult for an intelligent, logical person to come up with any scenario for recovery. The negative news just builds and creates a setting of no hope, yet the market rebounds.

Figure 9.1 S&P 500 Index, 12/31/1989–12/31/1992
1990 and 1998
The sharp drop in 1990 was ignited by the invasion of Kuwait. In 1998, the fear came from what the media called the “Asian Contagion.” There was the theory that the recession in Asia would spread to Europe and then spread to the United States. Although later proven to be incorrect, that line of reasoning became very convincing and apparently believed by enough investors to cause a 19.2% drop in the S&P 500 Index. There were different fears at different times, but volatility events are quite similar. Figure 9.2 shows the S&P 500 Index adjusted to a beginning value of 1.00 for 1990 and 1998. They are similar in depth and duration, although 1998 had a bit faster recovery. Similar to 1990, the market resumed its climb higher in 1998, not peaking until March 2000.
Why show 1990 and 1998? Because it is a pattern and repeated itself three times during the recent multiyear bull market. In 2010 and 2011, investors focused on the European debt crisis with potential defaults on sovereign debt. The drops were not as deep as in the 1990s—15.6% in 2010 and 18.4% in 2011—but the news was equally scary and the outlook just as bleak as at those bottoms. In Figure 9.3, the drops, the duration, and the recoveries in 2010 and 2011 were quite similar. In other words, having lived through events in the 1990s, we had a road map for the volatility events of 2010 and 2011.

Figure 9.2 1990 and 1998 Volatility Events

Figure 9.3 S&P 500 Index, 2010 and 2011 Volatility Events
Although the trade war with China was a concern for investors in late 2018, the biggest problem was the belief that the Fed was not “data driven,” as it had been saying, but instead predetermined to continue raising the Federal Funds target to well over 3% in 2019. The drop in late 2018 and the rebound most closely resembles the event in 1990 as shown in Figure 9.4.
Although the strategy of buy and hold was very productive for eleven years, it certainly was made difficult by three volatility events. In addition, those events caused problems for most money managers. As shown in Chapter 2 they included complete theme reversals. Over the long run, information technology, consumer discretionary, financials, and industrials were the top-performing sectors, but they suffered the most during the short-term, severe setbacks. Managers generally do not have the ability to “time” twelve-week sector and industry theme reversals. Whether using value, momentum, or most other strategies used by investors and managers, short-term theme reversals prove difficult to handle, especially when they are caused by fears that later on prove to be invalid, in other words, irrational.
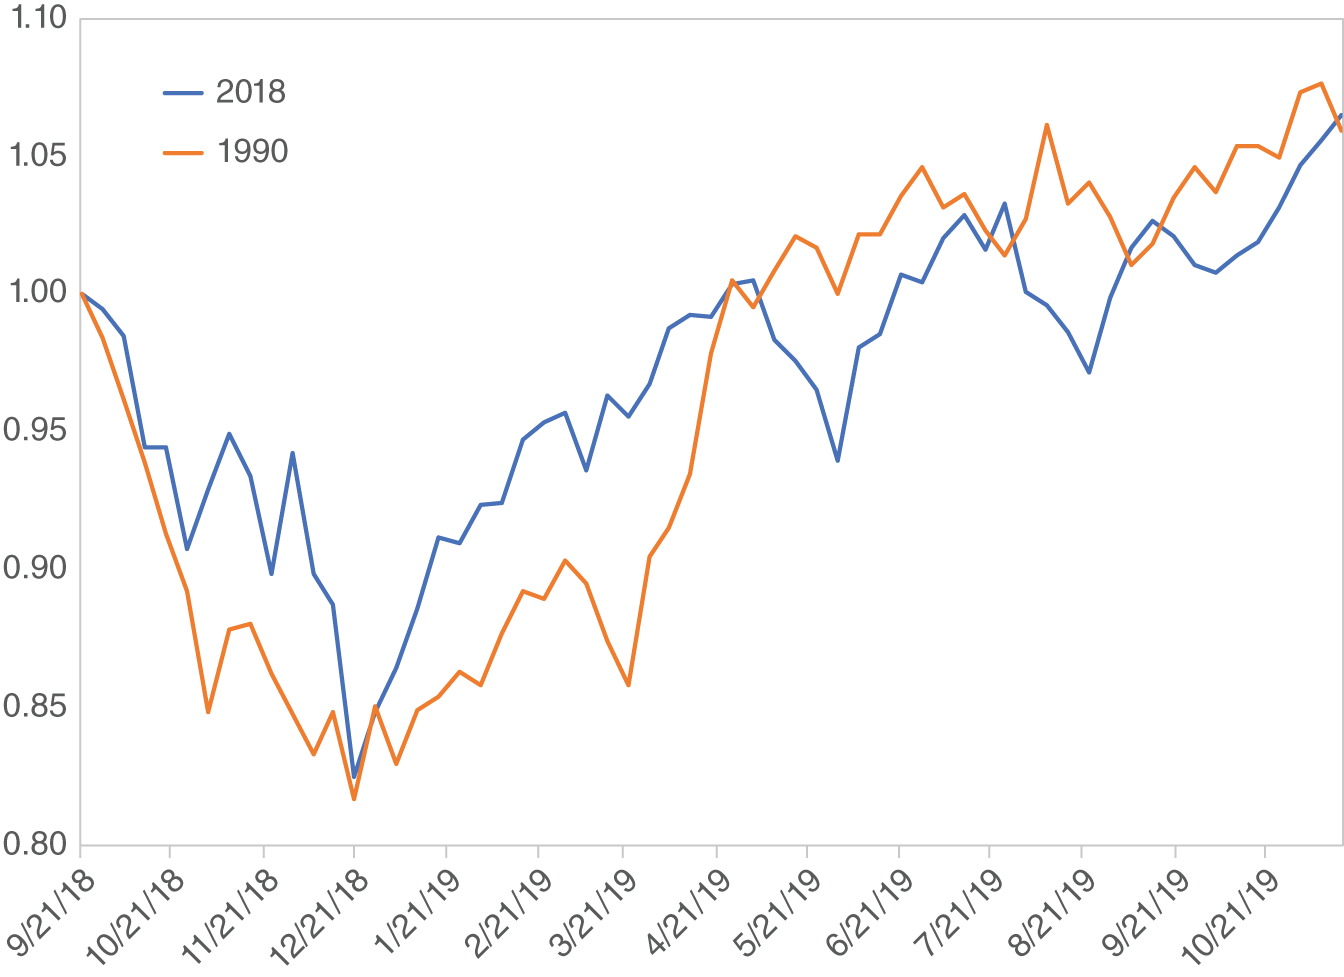
Figure 9.4 S&P 500 Index, 2018 and 1990 Volatility Events
CNBC TV
In December 2018, the market bottom was December 24. I was on CNBC TV December 26 on “The Exchange” hosted by Kelly Evans. I was the first guest at 1:00 Eastern time. That day, Bill Griffith was at the desk with Ms. Evans. He asked, “Craig, what do you think?” My response, “We believe we are in what we call a volatility event like 1990, 1998, 2010, and 2011. In those cases, the market dropped 17% to 20% over about nine to twelve weeks, then the market rebounded and resumed its long-term trend. So we expect the same this time … It sure feels like a bottom to us.”
The market moved higher and two weeks later, I was on the show again. Kelly Evans asked, “The day after Christmas you told us it feels like a bottom now. What happens next?” I said, “So we would expect to get back to those [all-time] highs we saw in September by late March, early April.” It actually took until May; we were off by a few weeks because volatility events are remarkably similar but not exactly alike.
Value
Although downright scary, those volatility events produce excellent buying opportunities. At ICON, we compute intrinsic value for stocks and divide by price. Each stock has a value/price (V/P) ratio. Anything above 1.00 means the stock is priced below our estimate of fair value. We take an average of all the stocks in our database to get what we call a market V/P. Table 9.1 shows our market V/P and the discounts to fair value, on average, for stocks at the bottom of the five volatility events. As you'd expect, bad news and attractive bargains go hand-in-hand. You don't get discounts that attractive because the news is good. Good discounts go with bad news and bleak outlooks.
Table 9.1 Market V/P
| Year | Market V/P |
|---|---|
| 1990 | 1.20 |
| 1998 | 1.35 |
| 2010 | 1.34 |
| 2011 | 1.52 |
| 2018 | 1.15 |
Setbacks and Theme Reversals
Although the volatility events of 2010, 2011, and 2018 were the biggest drops, there were five other noteworthy setbacks. We have divided the eleven-year bull market into nine advances and eight declines based on short-term troughs and peaks. The longest advance was 102 weeks from February 2016 to January 2018. The shortest was fifteen weeks June to September 2014. The average advance was fifty weeks. The longest drop was thirty-eight weeks from May 2015 to February 2016 and the shortest was just six weeks from September to October 2014. The average decline lasted 15 weeks. Table 9.2 shows sector rates of return ranked by “up-market” performance and reveals extreme theme reversals.
In Chapter 2 we saw that over the entire bull market information technology, consumer discretionary, financials, and industrials were the four best-performing sectors. Here we see that they were the leaders during the phases when the market advanced, but we also see how they got hit during the down phases. The long-term lagging and so-called recession-proof sectors, such as consumer staples, utilities, and telecommunication services, were sluggish when the market advanced but held up the best during down phases. With the average advance being just fifty weeks and the average drop being just fifteen weeks, these are extremely rapid theme reversals that are very difficult on active managers. Most managers do not have the ability to “time” fifteen-week-long sector themes.
Table 9.2 Sector Returns in Up and Down Phases
| Up (%) | Down (%) | |
|---|---|---|
| Financials | 48.5 | −14.9 |
| Information Technology | 48.3 | −13.0 |
| Consumer Discretionary | 45.4 | −12.0 |
| Industrials | 42.8 | −13.8 |
| Materials | 40.4 | −16.5 |
| S&P 1500 Index | 37.6 | −12.2 |
| Health Care | 32.5 | −9.3 |
| Energy | 28.8 | −19.5 |
| Consumer Staples | 22.4 | −5.3 |
| Utilities | 18.2 | −1.5 |
| Telecommunication Services | 17.6 | −5.5 |
As a side note, energy was the worst sector over the entire bull market but not because it didn't participate in rising markets. It lagged the market during advances but still participated. Energy got pounded during down phases similar to materials because both sectors have a commodity price sensitivity. Also in 2018, S&P changed telecommunication services into communication services. For this table we use the identity it had for nine of the eleven years.
What contributed to the volatility and short-term theme reversals? Was it jitters? Was it the lack of confidence? Was it the two steps forward, one step back nature of the economic recovery? Was it the on-again, off-again monetary policy of the Fed and the European Central Bank? Whatever it was, these short-term drops and complete theme reversals were unpleasant, scaring investors and creating headaches for money managers.
Accepting the Stock Market as It Is
In fall 2018 we wrote a paper to try to help investors ride through the dips, theme reversals, and volatility of this bull market.
Summary
There were three volatility events during the eleven-year bull market, and they were very similar to the previous two in the 1990s. The market dropped sharply over nine to twelve weeks while investors focused on a well-known, obvious concern or situation. The potential recession never happened and in all cases the market bounced back quickly and resumed its pre-volatility event path higher.
Volatility events are good examples of “the market can be wrong.” Investors sell, fearing and even predicting some event or situation, then it never happens. Paul Samuelson, noted economist at MIT declared, “The stock market is a leading indicator; it has predicted nine of the last five recessions.” The market did that three times during this multiyear unloved bull market. Unloved? Three volatility events in ten years with two coming in the first two years sure made this multiyear bull market anything but fun. Some investors just couldn't get through those. The great Peter Lynch of Fidelity Magellan fame advised, “The key to making money in stocks is not to get scared out of them.”
- A volatility event consists of 16% to 20%, nine- to twelve-week drops, quick recovery, and resumption of the long-term trend.
- 1990, 1998, 2011, 2011, and 2018 were very similar volatility events.
- Three drops during the eleven-year bull market scared investors.
- Volatility events feature complete sector theme reversals.
- Riding through volatility is rewarding. It is expensive to reduce volatility.