Today's virtual environment is not considered complete until it remains online 24/7. High availability is supported by almost all kinds of operating systems, regardless of its type. VMware also supports high availability and the Distributed Resource Scheduler (DRS) to allow you to have a fully automated and highly available infrastructure. DRS manages the workload and load balances them within the vSphere cluster. It is based on advanced algorithms to automate the migration of virtual machines using vMotion from one host to another when the resources are not available to satisfy the virtual machine requirements on a particular host. The migrations are done entirely without any downtime.
To avoid downtime and to monitor the performance of your infrastructure, you must know how to troubleshoot DRS and high availability issues in VMware infrastructure. In this chapter, you will also see how to troubleshoot vMotion and storage vMotion issues. You have already seen in Chapter 1, The Methodology of Problem Solving, how important business continuity is in the 24/7 highly available environment and what it means for a seasonal system administrator of the infrastructure.
In this chapter, we will cover the following topics:
- Overview of cluster information
- Cluster performance monitoring
- Failing heartbeat datastore
- DRS-enabled storage
- Insufficient resource troubleshooting
- I/O control troubleshooting
- vSphere fault tolerance
- Configuring SNMP traps for continuous monitoring
Let's start by looking into the cluster information from the vSphere web client:
- Log in to your vSphere web client.
- Click on vCenter in the left pane.
- Now click on Hosts and Clusters from the inventory tree.
- Click on the arrow of data center to view all the children under it.
- Click on the cluster, and then click on the Summary tab on the right under Actions.
- You can see a vSphere cluster named LinxSol-FatNodes in the following screenshot:
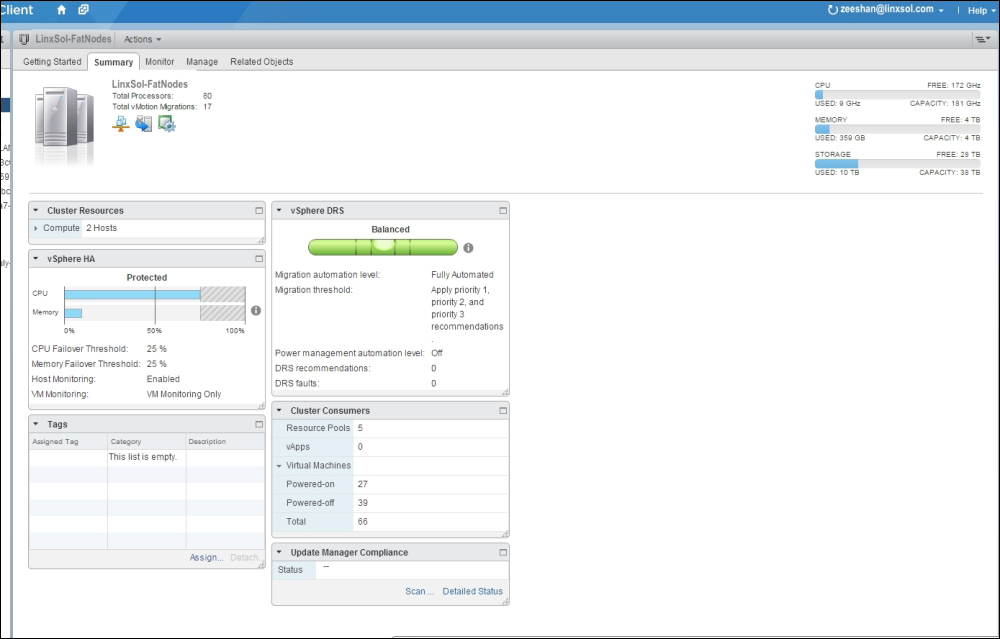
You can see a summary of information about the vSphere cluster named LinxSol-FatNodes. The top column shows the total number of processors and the total number of vMotion migrations. In the same pane, you can see on the right the total CPU, MEMORY, STORAGE and their usage respectively. The Cluster Resources pane shows the number of hosts the cluster is made up of, total processors, CPU resources in GHz, total memory, and the EVC mode.
The vSphere HA pane shows information about vSphere HA protection status, percentage of CPU Failover Threshold, percentage of Memory Failover Threshold, status of Host Monitoring, and status of VM Monitoring. You can monitor a brief summary of your vSphere DRS from the vSphere DRS column. This column provides you with information about Migration automation level, whether it is Manual, Partially automated, or Fully automated. As you can see, in my case it is Fully automated, and DRS has automatically decided to place and migrate virtual machines to optimize resources. It also shows information about the Migration threshold, Power management automation level, number of DRS recommendations, and number of DRS faults. The next pane Cluster Consumers shows information about consumer resources that are utilizing the resources of the cluster. It includes the information about the number of Resource Pools, number of vApps, and number of Virtual Machines.