Identification and Prediction of Volcanic Facies
Volcanic facies is of great importance for reservoir prediction because it controls the type, degree of development, and distribution characteristics of pores and fractures in volcanic rocks; affects the type and intensity of later diagenesis; and determines the distribution of favorable facies belts [1]. The identification criteria and models for different lithofacies are established on the basis of volcanic facies classification. Following the technical approaches of proceeding from single wells to a profile, then to a 2D plane and finally to 3D space, volcanic facies can be identified and their distribution predicted, including quantitative characterizations of their size, shape, and superposition relationships, as well as their distribution patterns. This will help establish a basis for predicting favorable reservoirs and building 3D geological models that reflects the characteristics of volcanic facies.
4.1 Classification of volcanic facies
4.1.1 Classification of lithofacies
Facies are the overall geological characteristics that reflect the genesis of a rock body [2]. Volcanic facies are the spatial distributions of volcanic products, the mode of occurrence, and the appearance and characteristics of these products, controlled by factors such as the modes of volcanism, eruption types, magma composition, geological structures, and paleogeographical settings [3].
M. Usov, Yu. Kuznetsov, and V.I. Pavlinov pioneered a detailed classification of volcanic facies. In 1973, Kropachev and Starostni proposed a new classification scheme, which constituted the foundation for classifying volcanic facies [4]. In 1978, Kepugef introduced the term volcanic facies into the geology literature and classified volcanic rocks into three facies based on their petrogenic conditions and rock body morphology, including primary eruptive facies, subvolcanic facies and volcanic conduit facies [5], a classification scheme adopted also by Li and Wang [6]. Fisher and Schmincke classified volcaniclastic rocks into four facies: volcaniclastic flow facies, volcaniclastic rock facies, eruptive alluvial facies, and ash flow facies [7]. In a more elaborative classification proposed by Tao and Qiu, 11 volcanic facies were recognized: eruptive-effusive facies, fallout facies, volcaniclastic flow facies, surge facies, lahar facies, collapse facies, extrusive facies, volcanic crater-neck facies, subvolcanic facies, cryptoexplosive breccia facies, and eruptive sedimentary facies [8]. On the basis of various modes of volcanic material transportation, Jin and colleagues classified volcanic rocks into four facies: explosive facies, eruptive-collapse and eruptive-effusive facies, extrusive and subvolcanic facies, and eruptive-sedimentary facies [9]. Xie and coworkers recognized 13 volcanic lithofacies: eruptive-effusive facies, explosive fallout facies, volcaniclastic flow facies, explosive-effusive facies, base surge facies, volcanic debris flow facies, eruptive sedimentary facies, volcanic neck facies, extrusive facies, subvolcanic facies, cryptoexplosive breccia facies, intrusive facies, and volcanic lake facies [10]. Liu and colleagues classified volcaniclastic rocks into four groups: eruption fallout deposits, volcaniclastic flow deposits, lahar deposits, and volcanic base-surge deposits [11]. Liu and colleagues classified the volcanic rocks in the Dabie Mountains into four facies: explosive facies, eruptive-effusive facies, eruptive-sedimentary facies, and subvolcanic facies [12]. Wang and associates classified the volcanic rocks of the Yingcheng Formation in Xujiaweizi into five volcanic facies: volcanic conduit facies, explosive facies, eruptive-effusive facies, volcanic-sedimentary facies, and extrusive facies [13].
A systematic and standardized volcanic facies classification scheme should take into account the following aspects: (1) volcanic eruption pattern; (2) volcanic eruption environment; (3) surface settings for the accumulation of volcanic products; (4) mechanisms of volcanic explosion and transportation and accumulation of volcaniclastic debris; (5) mechanisms of magmatic intrusion at a given depth; and (6) the specific location of the volcanic edifice [14]. By integrating the results of previous work with consideration of the geological features of volcanic rocks in the Songliao and Junggar basins, this book recognizes six volcanic facies: explosive facies, effusive facies, extrusive facies, volcanic conduit facies, subvolcanic facies, and volcanic sedimentary facies, among which a total of 19 subfacies are also identified (Table 4.1).
Table 4.1
Classification of Volcanic Lithofacies
| Facies | Subfacies |
| Explosive facies | Splash subfacies, hot debris flow subfacies, hot base surge subfacies, and fallout subfacies |
| Effusive facies | Top subfacies, upper subfacies, middle subfacies, and lower subfacies |
| Extrusive facies | Intrazone subfacies, mesozone subfacies, and outer zone subfacies |
| Volcanic conduit facies | Volcanic neck subfacies and cryptoexplosive breccia subfacies |
| Subvolcanic facies | Intrazone subfacies, mesozone subfacies, and outer zone subfacies |
| Volcanic sedimentary facies | Xenoclast-bearing subfacies, re-transported subfacies, and coal-bearing tuff subfacies |
4.1.2 Lithofacies models
Lithofacies models are the generalization of lithofacies assemblages, with the conceptualized and simplified models to demonstrate the interrelationships between various volcanic facies [15]. The distribution of volcanic lithofacies is obviously controlled by the settings of the eruption “sources” and different levels of eruption energy. Different lithofacies have different geological and geographical settings and hence different assemblage patterns.
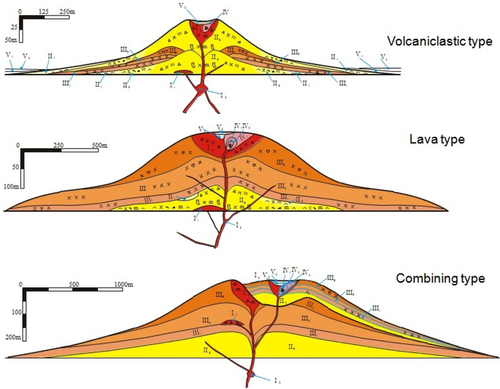
1 Lithofacies pattern of acidic volcanic rocks in Songliao basin
Due to the complexity and peculiarities of various volcanoes and the impact of later transformations, the volcanic facies have diverse distribution patterns.
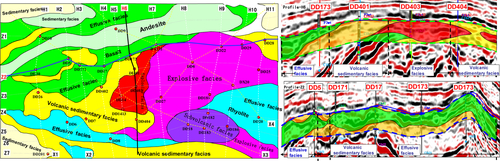
In the acidic volcanic rocks of the Yingcheng Formation in the Songliao basin, for example, the volcanic edifices are mainly of three types: volcaniclastics, lava, and combined lava-volcaniclastics. Based on their types and distribution characteristics within the volcanic edifices, the overall distribution pattern of the lithofacies pattern is established (Figure 4.1) [16] as follows: The horizontal facies succession is characterized, from proximal to distal locations relative to the crater, by volcanic conduit facies (extrusive facies and subvolcanic facies) → explosive facies → effusive facies → volcanic sedimentary facies; whereas the vertical facies succession is represented, in ascending order, by subvolcanic facies → volcanic conduit facies → explosive facies → effusive facies → extrusive facies → volcanic sedimentary facies. In general, the complexity of lithofacies types decreases with increasing distances from the crater.
2 Vertical distribution characteristics
In general, three vertical distribution patterns or trends can be recognized in the volcanic rocks: weakening-upward sequence, strengthening-upward sequence, and alternating sequence.
1) Weakening-upward sequence
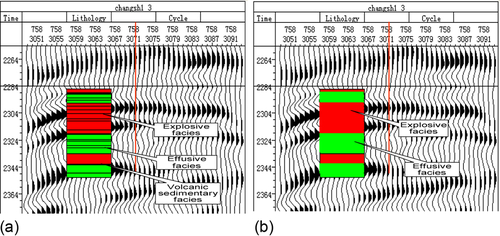
The eruption energy weakens gradually, with explosive facies developed first, followed by effusive facies (Figure 4.2). The explosive facies comprises, in ascending order, a succession of fallout subfacies, hot base surge subfacies, hot debris flow subfacies, and splash subfacies. The effusive facies consists of, in ascending order, a succession of the lower subfacies, middle subfacies, upper subfacies, and top subfacies. This lithofacies model is typical of acidic volcanic rocks.
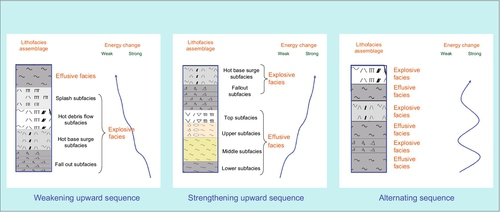
2) Strengthening-upward sequence
The eruption energy increases gradually, with effusive facies developed first, followed by explosive facies (see Figure 4.2). In ascending order, the effusive facies is comprised of a succession of lower subfacies, middle subfacies, upper subfacies, and top subfacies, whereas the explosive facies comprises a fallout subfacies and hot base surge subfacies. This lithofacies pattern is characteristic of neutral-basic volcanic rocks.
3) Alternating sequence
The eruption energy alternates between strong and weak, indicating unstable eruption energy, resulting in explosive facies alternating with effusive facies (see Figure 4.2).
3 Horizontal distribution characteristics
With increasing distances from the crater, volcanic facies can be divided laterally into three lithofacies belts: crater facies, proximalcrater facies, and distal crater facies:
1) Crater facies
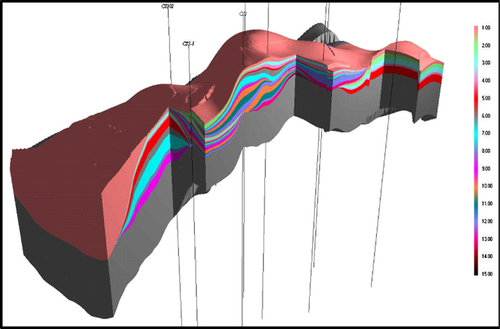
This facies is characterized by alternations of explosive facies, effusive facies, extrusive facies, volcanic conduit facies, and subvolcanic facies, with rapid changes in various lithofacies and complex stacking patterns or superposition relationships (Figure 4.3).

2) Proximal crater facies
This facies comprises mainly effusive facies and explosive facies, with a large thickness, relatively stable distribution, good continuity, and a primary paralaminar vertical superposition relationship (see Figure 4.3).
3) Distal crater facies
This facies consists of explosive facies, effusive facies, or volcanic sedimentary facies, with simple lithology, small thickness, stable distribution, good continuity, and predominantly laminar distribution (see Figure 4.3).
4.2 Research challenges and technical solutions
4.2.1 Research challenges
The formation of volcanic facies is controlled by multiple factors such as magma properties, eruption modes, transportation mechanisms, paleogeomorphology, and diagenetic processes [17–19], which lead to challenges for their identification and prediction because of petrogenetic complexity and various lithofacies with rapid facies change. The challenges can be summarized as follows:
1. There are many types of volcanic facies with complex mechanisms of petrogenesis, which translates to multiple schemes of facies identification and classification. For cored intervals, each lithofacies is identified based mainly on its lithological, textural, and structural markers. However, there is no one-to-one corresponding relationship between volcanic lithofacies and volcanic lithology, texture, and structure. Systematic analysis is needed by taking into consideration the location of cored intervals in the volcanic edifice. For noncored intervals, volcanic facies are identified based mainly on geophysical logging data, but logging data are affected by many factors such as borehole environments, logging instruments, and geological changes, which can be interpreted in multiple ways. It is thus difficult to identify and classify volcanic facies accurately.
2. Challenges in the prediction of volcanic lithofacies are due to rapid changes in volcanic facies and subtle differences in seismic reflections between different lithofacies, without clearly traceable interfaces. Compared with sedimentary rocks, the formation of volcanic rocks is characterized by rapid accumulation. Volcanic rocks inside the same volcanic edifice are generally syngenetic, resulting in largely homogeneous lithological compositions, similar density and acoustic velocity between different lithofacies, and hence minimal differences in seismic reflection characteristics between different lithofacies. Moreover, rapid changes of volcanic lithology and thickness are reflected also by the presence some thin-layer lithofacies, which are usually difficult to recognize due to the lower vertical resolution of seismic data, leading to a low accuracy of lithofacies prediction. In addition, the superposition relationships between volcanic facies are complicated, often lacking consistent, identifiable, and continuously traceable interfaces between adjacent lithofacies, posing further challenges for identifying and delineating volcanic facies.
3. Challenges in characterization of volcanic facies as a result of the complex shapes, scales, and superposition relationships and various types of facies sequence combination. Volcanic facies have multiple types, complicated shapes, significant differences in scales, and complex facies sequence combination relationships. Characterization of volcanic facies using outcrop data is restricted by the completeness of exposure and the workload of outcrop research; characterization of volcanic facies based on seismic data is influenced by the impact of seismic data on the resolution of lithofacies and subfacies; characterization of volcanic facies with dense well grid data is restricted by the location of dense well grids and the acquisition of coring, logging, and performance data. Furthermore, volcanic lithofacies change rapidly with poor facies sequence integrity and complex assemblage relationships. This makes it challenging to characterize the geometric parameters of volcanic facies.
4.2.2 Technical solutions
Volcanic lithofacies in single wells and cross sections can be identified by taking into consideration the characteristics and prediction difficulties of volcanic facies by using the classification scheme of rock types and lithology identification, volcanic facies markers, and analysis core, wireline log, and seismic data. The planar (2D) and spatial (3D) distribution patterns of lithofacies are predicted by establishing the corresponding relationships between lithofacies and seismic facies. Volcanic lithofacies are quantitatively characterized by systematically analyzing outcrop, seismic, and dense-grid well data to reveal the shape, scale, and superposition relationships of volcanic facies (Figure 4.4). The main concepts and approaches are as follows:
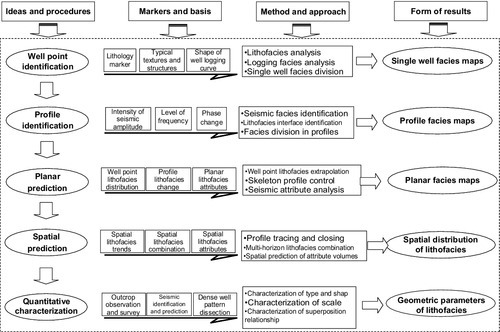
1. Lithological classification and identification markers are distilled to define the typical textures, structures, and log curve shapes of volcanic facies and to identify the locations of volcanic edifices and lithofacies in single wells.
2. Through seismic calibration based on single-well lithofacies, the seismic facies pattern of volcanic lithofacies is established; volcanic lithofacies are identified according to seismic reflection characteristics in skeletal profiles, based on well point constraints and seismic facies patterns.
3. The planar distribution of volcanic lithofacies is predicted based on the identification of single-well facies and profile facies, under the guidance of the lithofacies pattern, and through well point extrapolation, skeleton profile control, and seismic attribute analysis.
4. A skeletal profile network is established for the entire study area, and the spatial distribution of lithofacies is revealed through lithofacies tracing, multihorizon lithofacies linkage, and extraction of lithology-sensitive seismic attribute volumes.
5. The shape, scale, and superposition relationships of volcanic facies are characterized by systematically integrating outcrop, seismic, and dense-grid well data.
4.3 Single-well identification and classification
4.3.1 Identification markers
As the foundation for single-well facies recognition and division, the identification markers for volcanic lithofacies are established on the basis of petrogenetic analysis, incorporating lithological, textural, and structural characteristics, and log responses of different volcanic lithofacies.
1 Geological markers
1) Explosive facies
Magma contains a large number of volatiles and exerts tremendous pressure on surrounding rocks. Its explosion within surrounding rocks results in the accumulation of volcaniclastic materials of various sizes. The explosive facies may be formed in any volcanic phases, but it is mostly found in the lower part of acidic eruption cycles and in the upper part of basic eruption cycles. The typical lithology of explosive facies consists mainly of volcanic agglomerate, volcanic breccia, tuff, and welded breccia (Figure 4.5), with corresponding lithological textures. Typical structures include graded beddings and ballistic trajectory drop-pebble structure. The explosive facies comprises four subfacies, including, in ascending order, the fallout, hot base surge, volcaniclastic flow, and splash subfacies. Different subfacies have different petrogenetic, lithological, textural, and structural characteristics (Table 4.2).
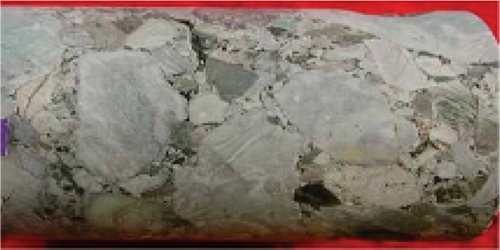
Table 4.2
Subfacies and Geological Marks of Explosive Facies
| Facies | Subfacies | Genesis | Typical Lithology | Typical Textures | Typical Structures |
| Explosive facies | Splash subfacies | Formed as a result of local retraction and accumulation of magmatic melt and surrounding rocks carried by the lava during its upwelling near the crater | Breccia lava, tuff lava | Welded breccia texture, welded tuff texture | Deformed rhyolitic structure |
| Hot debris flow subfacies | Formed through mixture of hot debris and magma debris with volatiles flowing on surface, driven by subsequent ejecta and gravity, through chilling, cementation, and compaction | Welded tuff containing crystal fragments, vitric fragments, magmatic fragments, and lithic fragments | Welded tuff texture | Graded beddings, volcanic glass lineation, and matrix support | |
| Hot base surge subfacies | Formed by gas-solid-liquid multiphase system through degassing driven by gravity, transported as suspension near the surface and then lithification via gravity deposition and compaction | Tuff containing crystal fragments, vitric fragments, and magmatic fragments | Crystalline tuff texture | Parallel beddings, cross beddings, regressive sand wave beddings | |
| Fallout subfacies | Formed by solid volcanic debris and plastic ejecta, driven by volcanic degassing and free fallback to surface and compaction | Agglomerate, volcanic breccia, volcanic tuff | Agglomerate texture, breccia texture, tuff texture | Particle supported normal graded beddings, ballistic trajectory drop pebbles |

2) Effusive facies
This facies forms during the middle period of a volcanic eruption cycle, from magmatic melt containing crystallized material and syngenetic breccia driven by the propulsion of subsequent ejecta and its own gravity to flow on the surface, followed by gradual chilling and lithification. Effusive facies is commonly found in acidic, neutral, and basic volcanic rocks, characterized by rocks derived from various magma with vesicular and rhyolitic structures. In this lithofacies, the typical textures are spherulitic, aplitic, and vitreous, and typical structures are rhyolitic, vesicular, amygdaloidal, and lithophysa (Figure 4.6). The effusive facies comprises four subfacies, including, in ascending order, the lower, middle, upper, and top subfacies (Table 4.3).
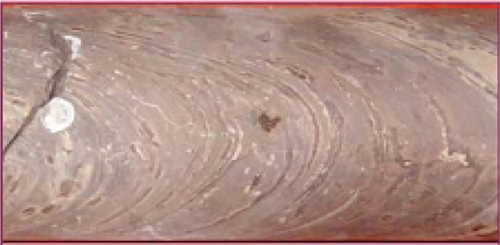
Table 4.3
Subfacies Types and Geologic Marks of Effusive Facies
| Facies | Subfacies | Genesis | Typical Lithology | Typical Textures | Typical Structures |
| Effusive facies | Top subfacies | Formed during magmatic melt flow; in contact with air; rapid lithification and chill; compression and crushing by subsequent magmatic melt | Breccia lava | Autoclastic texture, welded breccia texture | Deformed rhyolitic structure |
| Upper subfacies | Formed during magmatic melt flow through chilling, cementation, and compaction of upper magmatic melt, with best-developed primary vesicles | Vesicular structure lava | Spherulitic texture, aplitic texture | Vesicular structure, amygdaloidal structure, and lithophysa structure | |
| Middle subfacies | Formed during magmatic melt flow through chilling, cementation, and compaction of middle magmatic melt; this is a relatively dense lithofacies belt | Rhyolitic structure lava | Aplitic texture, porphyritic texture | Rhyolitic structure | |
| Lower subfacies | Formed during magmatic melt flow through chilling, cementation, and compaction of lower magmatic melt | Aplitic rhyolitic structure and syngenetic breccia bearing lava | Vitreous texture, aplitic texture, porphyritic texture | Blocky or discontinuous deformed rhyolitic structure |

3) Extrusive facies
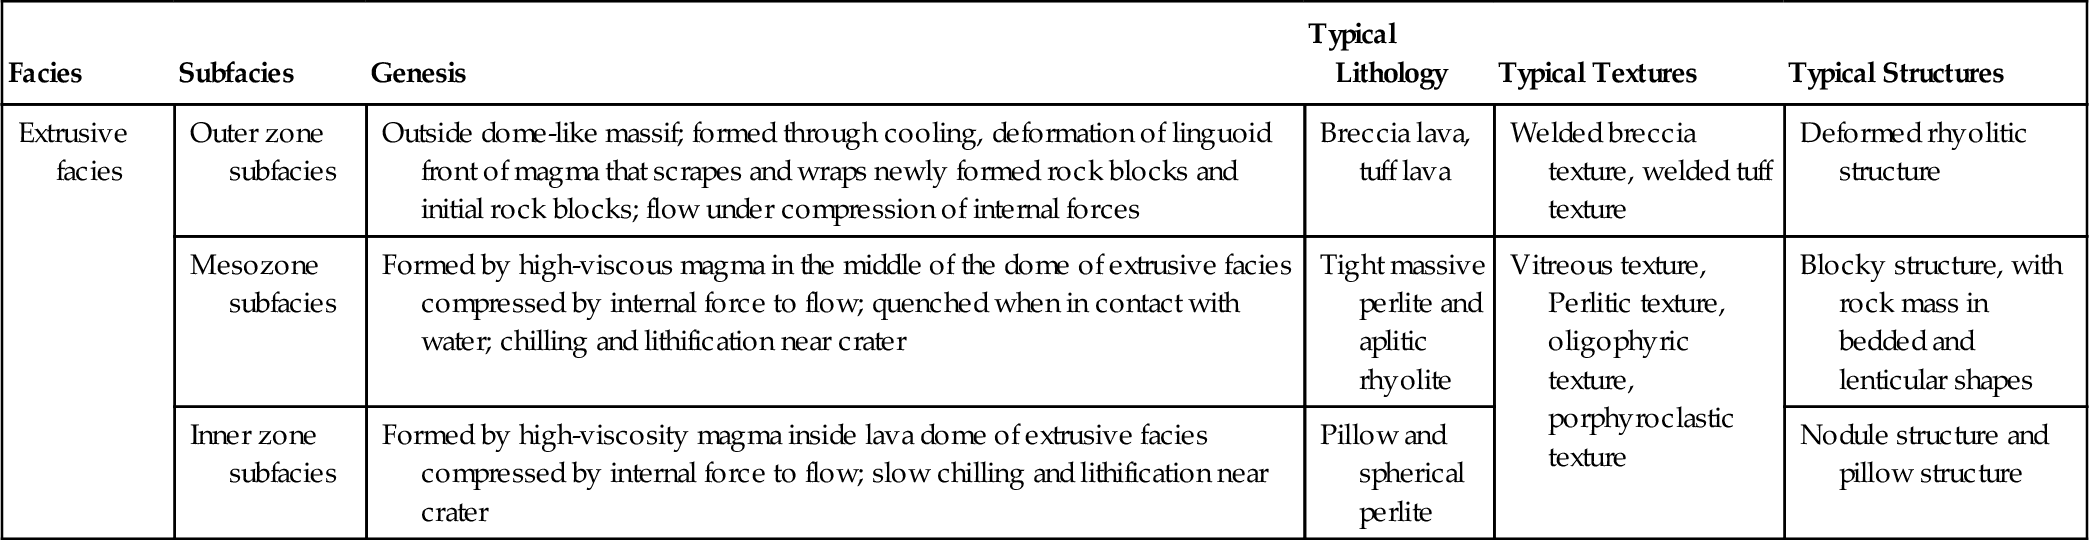
Extrusive facies forms in the later period of volcanic activity cycle and comprises blocky volcanic massifs formed near the crater when high-viscosity acidic and neutral magma is quenched by water or quickly chilled in the air while being compressed by internal forces to flow out of the surface. The extrusive facies is mainly domed in shape, with perlite being the predominant lithology. Its typical rock textures are perlitic and vitreous, and the typical structures are dominated by nodules and pillows (Figure 4.7). From inside out, the extrusive facies can be divided into three subfacies, namely the inner zone, mesozone, and outer zone (Table 4.4).
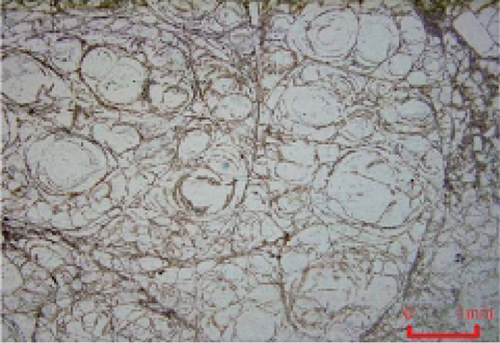
Table 4.4
Subfacies Types and Geological Marks of Extrusive Facies
| Facies | Subfacies | Genesis | Typical Lithology | Typical Textures | Typical Structures |
| Extrusive facies | Outer zone subfacies | Outside dome-like massif; formed through cooling, deformation of linguoid front of magma that scrapes and wraps newly formed rock blocks and initial rock blocks; flow under compression of internal forces | Breccia lava, tuff lava | Welded breccia texture, welded tuff texture | Deformed rhyolitic structure |
| Mesozone subfacies | Formed by high-viscous magma in the middle of the dome of extrusive facies compressed by internal force to flow; quenched when in contact with water; chilling and lithification near crater | Tight massive perlite and aplitic rhyolite | Vitreous texture, Perlitic texture, oligophyric texture, porphyroclastic texture | Blocky structure, with rock mass in bedded and lenticular shapes | |
| Inner zone subfacies | Formed by high-viscosity magma inside lava dome of extrusive facies compressed by internal force to flow; slow chilling and lithification near crater | Pillow and spherical perlite | Nodule structure and pillow structure |
4) Volcanic conduit facies
A volcanic conduit facies is located in the lower and near the center parts of the volcanic edifice, comprising volcanic rocks retained and backfilled in the volcanic conduit in the process of the upward transportation of magma to the surface. This facies accumulates throughout the volcanic cycle, but only the products of later activities are preserved. In a volcanic conduit facies, cryptoexplosive breccia is the lithological marker (Figure 4.8), characterized by cryptoexplosive breccia, autoclastic, porphyritic, and cataclastic textures and a dendritic vein structure. From inside out, the volcanic conduit facies can be identified into two subfacies: the volcanic neck subfacies and cryptoexplosive breccia subfacies (Table 4.5).

Table 4.5
Subfacies and Geologic Marks of Volcanic Conduit Facies
| Facies | Subfacies | Genesis | Typical Lithology | Typical Textures | Typical Structures |
| Volcanic conduit facies | Cryptoexplosive breccia subfacies | Formed when volatile-enriched magma intrudes fractured rock belts, and explodes in subsurface due to pressure release; or magma encounters ground water, leading to cryptoexplosion due to release of volatiles and pressure | Cryptoexplosive breccia | Cryptoexplosive breccia texture, Autoclastic porphyritic texture, Cataclastic texture | Cylinder, laminar, vein, dendritic, and fracture filling shaped |
| Volcanic neck subfacies | Formed in late stage of volcanic eruption; magma fails to erupt due to decrease of internal pressure, and becomes chilled inside volcanic conduit; rock layers near crater collapse due to thermal subsidence; cementation by continuously surging and cooling magma | Lava and breccia / tuff lava and welded breccia / tuff | Porphyritic texture, Welded texture, Breccia tuff texture | Ring or radial joint |

5) Subvolcanic facies
Subvolcanic facies forms in the same stage or the later stage of volcanic eruption cycles and is the result of slow chilling and crystallization of the lava intruding into the surrounding rocks. This facies is often located near the volcanic conduit in the form of sills, laccoliths, stocks, dikes, and veins. A subvolcanic facies typically has porphyritic and xenolith structures (Figure 4.9) and can be classified into three subfacies from inside out: the inner zone, mesozone, and outer zone subfacies (Table 4.6).
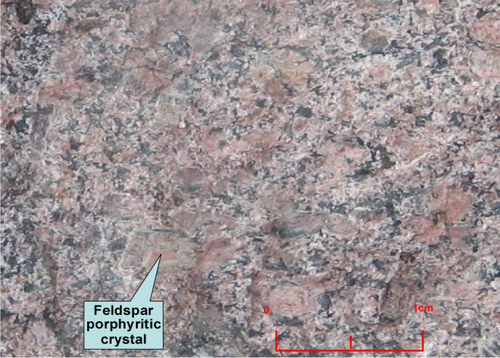
Table 4.6
Subfacies and Geological Marks of Subvolcanic Facies
| Facies | Subfacies | Genesis | Typical Lithology | Typical Textures | Typical Structures |
| Subvolcanic facies | Outer zone subfacies | Formed in the same stage or late stage of the volcanic eruption cycle, when the linguoid front of intruding magma chills; earlier or neogenic rocks become deformed, scaped, and wrapped; flow under compression of internal forces | Xenolith- bearing subvolcanic rock | Welded breccia texture, welded tuff texture | Xenolith structure |
| Mesozone subfacies | Formed in the same stage or later stage of the volcanic eruption cycle; high-viscous intruding magma compressed by internal force to flow; some parts of magma undergo cooing, crystallization, and compaction within surrounding rocks | Subvolcanic rock | Porphyritic texture | Chilled margin structure, platy flow structure, linear flow structure | |
| Inner zone subfacies | Crystalline texture | Columnar joint, tabular joint |

6) Volcanic sedimentary facies
Volcanic sedimentary facies consists mainly of clastic deposits between volcanic rocks. It often co-occurs with volcanic rocks but may not be present in every phase of volcanic activities. The clastic components of volcanic sedimentary facies contain a large amount of volcanic rock debris, and various types of sedimentary volcanic rocks and volcanic sedimentary rocks are developed in this facies with terrigenous clastic textures, rhythmic beddings, and planar beddings (Figure 4.10). This facies can be divided into three subfacies: xenoclast-bearing, retransported, and coal-bearing tuff subfacies (Table 4.7).
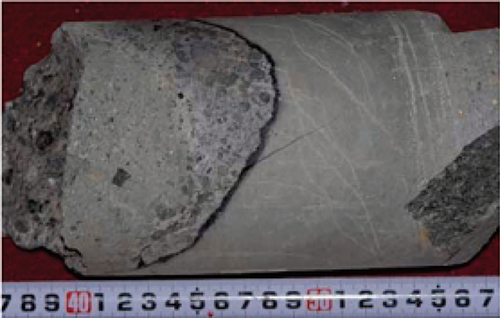
Table 4.7
Subfacies and Geologic Marks of Volcanic Sedimentary Facies
| Facies | Subfacies | Genesis | Typical Lithology | Typical Textures | Typical Structures |
| Volcanic sedimentary facies | Coal- bearing tuff subfacies | Tuffaceous volcanic debris between volcanic rocks interbedded with peat-enriched beds; coal-forming swamp environment. | Volcanic tuff interbedded with coal beds or intercalated with coal lines | Terrigenous clastic texture | Rhythmic beddings, horizontal beddings |
| Retransportation subfacies | Formed by volcaniclastic deposits reworked by water current. | Bedded volcaniclastic rock/tuff | Terrigenous clastic texture | Cross beddings, trough beddings, graded beddings, block structure | |
| Xenoclast- bearing subfacies | Formed primarily by volcanic debris, probably with additional terrigenous clastics | Volcanic tuffaceous glutenite containing xenoclast | Terrigenous clastic texture | Cross beddings, trough beddings, graded beddings, blocky structure |

2 Logging response characteristics
1) Explosive facies
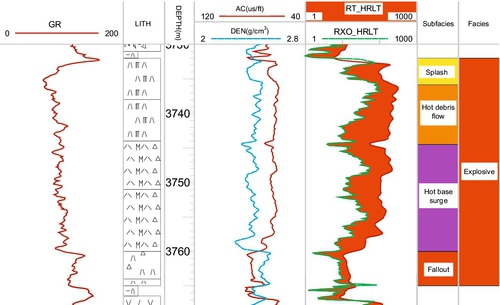
The logging curves of a complete explosive facies assemblage is characterized by an overall composite pattern of serrated or microserrated box shapes or bell shapes ~ funnel shapes. The log curve of different subfacies in the explosive facies are different: (1) the fallout subfacies is commonly characterized by high interval transit time, low density and low resistivity, and its logging curve is often serrated in shape; (2) the hot base surge subfacies is characterized by mid-low interval transit time, medium-high density and medium-high resistivity, with its log curve having a microserrated shape; (3) the hot clastic flow subfacies typically shows low interval transit time, high density and high resistivity, and its log curve is generally smooth, microserrated in shape; and (4) the splash subfacies is characterized by high interval transit time, low density and low resistivity, and its log curve often has a serrated shape (Figure 4.11).
2) Effusive facies
The logging curve of effusive facies generally has a smooth, from microserrated box to bell shape. The log response characteristics of different subfacies of the effusive facies are as follows: (1) the lower subfacies is characterized by high interval transit time, low density and low resistivity, and its log curve is often microserrated in shape; (2) the middle subfacies is characterized by low interval transit time, high density and high resistivity, and its log curve is relatively smooth, microserrated in shape; (3) the upper subfacies has an increased porosity, characterized by high interval transit time, low density and low resistivity, and its logging curve often has a micro-serrated shape; and (4) the top subfacies is characterized by high interval transit time, low density and low resistivity with various pores and fractures, and its logging curve ranges from microserrated ~ serrated bell to digitate (Figure 4.12).

3) Extrusive facies
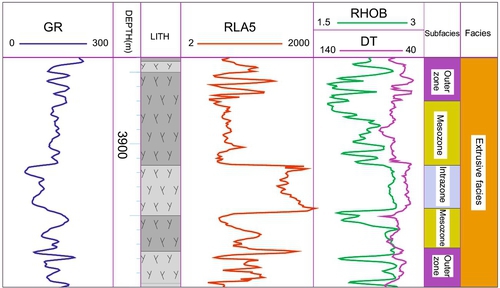
The logging curve of extrusive facies generally has a serrated box shape, and the log response characteristics of its different subfacies are quite different: (1) the outer zone subfacies, usually contains xenolith and volcanic debris, characterized by high interval transit time, low density and low resistivity, with its log curve having a serrated shape; (2) the mesozone subfacies is characterized by high interval transit time, low density and low resistivity, and its log curve is often micro-serrated; and (3) the inner zone subfacies has a relatively consistent composition and texture, as well as a fairly dense lithology, characterized by low interval transit time, high-low density and high resistivity, and a typically micro-serrated logging curve (Figure 4.13).
4) Volcanic conduit facies
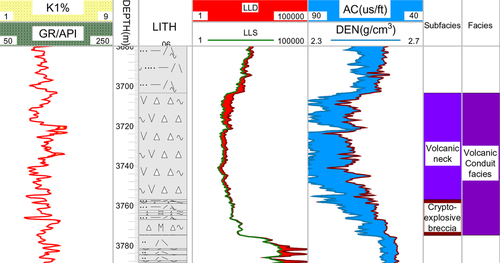
The lithologies, rock textures, and rock structures of different subfacies of the volcanic conduit facies are different, as reflected by their logging response characteristics. The constituents of the cryptoexplosive breccia subfacies are mixed, characterized by medium-high density, medium-high resistivity and medium-low interval transit time, with a serrated logging curve. In comparison, the volcanic neck subfacies with a consistent lithology is characterized by low density, low resistivity and high interval transit time, and its log curve usually has a smooth box shape (Figure 4.14).
5) Subvolcanic facies
The logging curve of subvolcanic facies is generally microserrated box or bell shaped. The outer zone subfacies is often characterized by low density, high interval transit time and low resistivity, with serrated logging curve; the mesozone subfacies shows a fairly high density and resistivity as well as low interval transit time, and its logging curve is micro-serrated ~ smooth in shape; and the inner zone subfacies is characterized by high density, low interval transit time and high resistivity, and a smooth logging curve (Figure 4.15).

6) Volcanic sedimentary facies
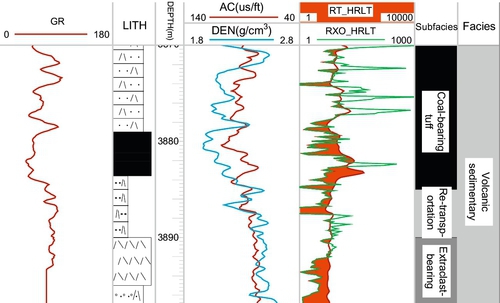
Volcanic sedimentary facies often shows a composite pattern of serrated ~ serrated-digitate shape or funnel shape ~ bell shape in log curves. The xenoclast-bearing subfacies is characterized by high interval transit time, low density and low resistivity, and a microserrated logging curve; the retransported subfacies typically has high interval transit time, low density and low resistivity, and serrated logging curve; and the coal-bearing tuff subfacies is characterized by high interval transit time, low density and high resistivity, and a serrated-digitate logging curve (Figure 4.16).
4.3.2 Single-well facies identification
Lithofacies identification in single wells are based on the geological settings of volcanic edifices penetrated by the drill hole, in combination with single-well lithological identifications using geological and logging markers, to establish a foundation for profile facies identification and lithofacies prediction.
1 Determination of lithofacies settings in single wells based on volcanic edifice distribution
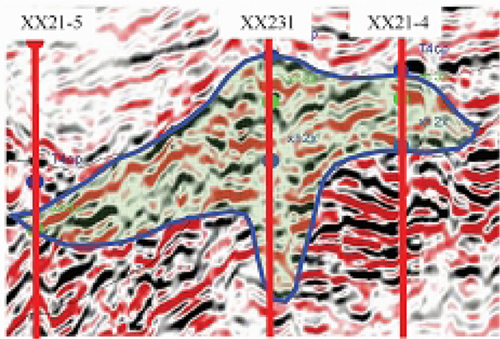
The types of lithofacies in different parts of the volcanic edifice are different. The analysis of lithofacies settings based on the position of the volcanic edifice penetrated in a single well is the foundation for the appropriate identification of lithofacies. The volcanic conduit facies or subvolcanic facies, for example, is only developed near the conduit of the volcanic edifice; the extrusive facies is often seen near the crater; the explosive facies occurs primarily near the crater, the effusive facies is mostly developed in the limb of the periclinal structure of the volcanic edifice; and the volcanic sedimentary facies is usually distributed in a topographic low between volcanic edifices. The volcanic facies settings can be ascertained according to the position of the volcanic edifice where the well is located. As shown in Figure 4.17, Well XX231 is located near the volcanic conduit of the volcanic edifice and is penetrated mainly by the volcanic conduit facies; Well XX21-5 is located at the margin of the volcanic edifice and is encountered chiefly by the volcanic sedimentary facies and distal explosive facies; in comparison, Well XX21-4 is located on the limb of the volcanic edifice, where the effusive and some explosive facies are encountered.
2 Lithofacies identification and division in cored interval
Analysis of lithofacies settings in single wells can be combined with the available core data and information on rock types, texture, and structure characteristics to identify volcanic lithofacies and subfacies and to calibrate logging facies.
1) Lithofacies identification in cored intervals
One of the important steps in volcanic lithofacies study is the description of available cores, whereby the lithology, texture, and structure of volcanic rocks are investigated to identify volcanic facies. In Figure 4.17, Well XX21-4 was drilled on the limb of the volcanic edifice, and the core from interval 3847.08 to 3878.35 m can be divided into four segments: interval 3847.08 to 3851.60 m is composed of offwhite rhyolitic brecciated lava with welded breccia texture and vesicular structure, and the breccia color and composition are similar to those of the lava. This segment was formed by flowing magma that compressed, crushed, and consolidated the top rock blocks; interval 3851.60 to 3864.41 m consists of gray rhyolite with rhyolitic structure, formed during the flowing process of lava; interval 3864.41 to 3869.35 m comprises gray rhyolite-syngenetic breccia with well-defined breccia geometry, but its color is darker than that of the lava, indicating that this segment was formed by magma that captured rock blocks from early formations during the flowing process; interval 3869.35 to 3878.35 m is composed of grayish purple, crystalline, welded tuff with both volcaniclastic, and welded textures (Table 4.8).
Table 4.8
Core Characteristics of 3847.08 ~ 3878.35 m in Well XX21-4
| Depth | Lithology | Color | Texture | Structure | Core Photo |
| 3847.08–3851.60 m | Rhyolitic breccia lava | Offwhite | Welded breccia texture | Vesicular structure |  |
| 3851.60–3864.41 m | Rhyolite | Gray | Aplitic texture | Rhyolitic structure | 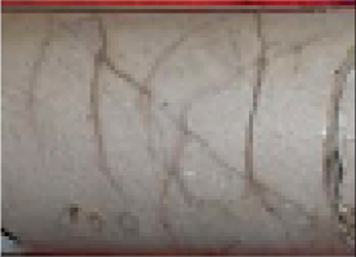 |
| 3864.41–3869.35 m | Rhyolite | Gray | Syngenetic breccia bearing texture | Deformed rhyolitic structure |  |
| 3869.35–3878.35 m | Crystal35ne welded tuff | Gray purple | Welded tuff texture, volcaniclastic texture | Volcanic glass orientational arrangement | 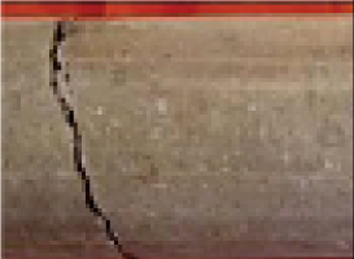 |

According to the core analysis, therefore, two segments can be recognized in the lithofacies of this interval. The lower crystalline welded tuff from 3869.35 to 3878.35 m formed from volcanic eruption with medium energy and should be classified as an explosive facies; the upper rhyolite-syngenetic breccia, rhyolite with rhyolitic structure, and breccia lava in the 3847.08 to 3869.35 m interval represent an internal lithological assemblage of effusive petrogenesis and should be classified as an effusive facies.
2) Subfacies classification of cored intervals
Based on lithofacies identification, subfacies can be further divided according to their lithology, rock textures and structures, and vertical assemblage relationships. For example, each subfacies of an explosive facies has different debris sizes and welded textural strengths, whereas each subfacies of an effusive facies has different vesicular and rhyolitic structures. The pillows and orbicular perlites of the extrusive facies are only developed within the mesozone and inner zone subfacies, whereas cryptoexplosive breccia of the volcanic conduit facies is only developed within the cryptoexplosive breccia subfacies. The lower portion of the 3847.08 to 3878.35 m cored interval in Well XX21-4 is crystalline welded tuff (3869.35 to 3878.35 m), with a welded textural grade between those of hot base surge and splash subfacies, which has the typical characteristics of hot clastic flow subfacies; in the upper portion, there are rhyolite and syngenetic breccia, with rhyolitic structure, which, according to the volcanic facies markers and internal subfacies assemblage characteristics, correspond to the top, middle, and lower subfacies of the effusive facies, respectively (Figure 4.18).

3) Establish logging facies patterns of different lithofacies through log calibration
Geophysical logging data are calibrated according to the classification of lithofacies and subfacies in cored intervals. Logging facies patterns for different lithofacies and subfacies are established through analysis of vertical assemblage relationships and logging responses to lithofacies and subfacies, which serve as the foundation for lithofacies identification in noncored intervals.
3 Identification and classification of lithofacies in noncored intervals
Volcanic facies and subfacies in noncored intervals are identified on the basis of lithofacies setting analysis and lithological identification, using mud log and wireline log data, as well as lithological characteristics and logging facies patterns of volcanic lithofacies.
1) Lithofacies identification
Volcanic facies are determined based on the results of lithofacies setting analysis and lithological interpretations. Because volcanic rocks are characterized by rapid facies change and complex facies sequence combinations [20], it is difficult to achieve an accurate division of lithofacies based solely on wireline logs. It will be necessary, therefore, to ascertain the types of volcanic facies based on the results of lithofacies setting analysis and lithological interpretations. For example, Well DD172 encountered the limb of the volcanic edifice, and the rock massif occurrence here has a predominantly wedged shape. According to the lithofacies distribution model, therefore, it is determined tentatively that this part probably represents an effusive facies or explosive facies. The mud log and lithological interpretations from wireline logs suggest that this well encountered mainly basalt and vesicular basalt, then basaltic breccia lava, basaltic welded breccia, sedimentary tuff, and mudstone, which point to the development of a primary effusive facies, and a secondary volcanic sedimentary facies, with minor explosive facies, probably developed locally (Figure 4.19).
Lithofacies are classified and associated according to logging curve shapes and vertical changes. The lithological identification of volcanic rocks is ambiguous, and the corresponding relationship between lithology and lithofacies is not unique. Therefore, single-well lithofacies need to be classified and associated according to the amplitudes, shapes, smoothness, and vertical changes of log curves. For example, the log curve for Well DD172 generally has a minor-serrated box or bell shape, characteristic of effusive facies, whereas the basaltic breccia lava and basaltic welded breccia generally correspond to the upper part of a box-shaped or bell-shaped curve and form part of the lithology association in the top subfacies of an effusive facies.
Therefore, according to the lithological and logging facies characteristics, seven lithofacies belts can be identified in Well DD172, including five minor-serrated box-shaped or bell-shaped curve segments corresponding to the effusive facies and two serrated curve segments corresponding to the volcanic sedimentary facies (see Figure 4.19). Among the five effusive facies belts, the log curve characteristics of the effusive facies at different segments are different: segments ![]() and
and ![]() largely show a box shape, segments
largely show a box shape, segments ![]() and
and ![]() a bell shape, and segment
a bell shape, and segment ![]() is transitional between box and bell shapes.
is transitional between box and bell shapes.
2) Subfacies division
Within the volcanic facies, subfacies are identified on the basis of the shape, variation of smoothness, and vertical association relationships of log curves.
In segment ![]() of Figure 4.19, for example, the log curve is divided into four subsegments: the lower segment has low density and low resistivity values, the middle segment has high density and high resistivity values, the upper segment has slightly lower density and resistivity values than the middle, whereas the top segment has low density and low resistivity, and the primary lithologies corresponding to these four subsegments are basalt-syngenetic breccia, tight basalt, vesicular basalt, and basaltic breccia lava, respectively. For this reason, Segment
of Figure 4.19, for example, the log curve is divided into four subsegments: the lower segment has low density and low resistivity values, the middle segment has high density and high resistivity values, the upper segment has slightly lower density and resistivity values than the middle, whereas the top segment has low density and low resistivity, and the primary lithologies corresponding to these four subsegments are basalt-syngenetic breccia, tight basalt, vesicular basalt, and basaltic breccia lava, respectively. For this reason, Segment ![]() in Well DD172 can be divided into four subfacies: the lower, middle, upper, and top.
in Well DD172 can be divided into four subfacies: the lower, middle, upper, and top.
4.4 Profile identification
Profile facies are the basis for investigating lithofacies paleogeography [21]. Based on single-well facies identification, seismic data can be calibrated using logging data, and seismic facies patterns of different lithofacies of volcanic rocks can be established. On the basis of the analysis of the volcanic edifice and massif and the seismic facies patterns of different lithofacies, profile facies of volcanic rocks are identified according to volcanic facies interpretation in single wells and the seismic reflection characteristics between wells.
4.4.1 Seismic response characteristics
Different lithofacies have different internal architectures and different seismic responses. Seismic data can be calibrated based on logging data, and then seismic response models of different lithofacies can be established.
1 Explosive facies
The overall sorting of volcanic debris in the explosive facies is relatively poor with mixed grain sizes, with rapid facies change along a plane. The seismic profiles mostly show chaotic reflection characteristics of medium-weak amplitudes, relatively high frequencies, medium-poor continuity, and hummocky or wedge shapes (Figure 4.20).

2 Effusive facies
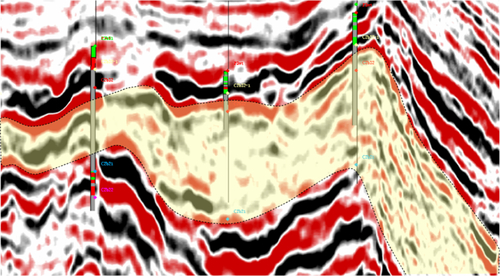
The lava within an effusive facies has good continuity and fairly consistent distribution. The seismic profiles mostly show seismic reflection characteristics of medium-strong amplitudes, medium-low frequencies, and relatively good continuity, parallel-subparallel seismic reflection configuration, with predominantly bedded and lenticular shapes (Figure 4.21).

3 Extrusive facies
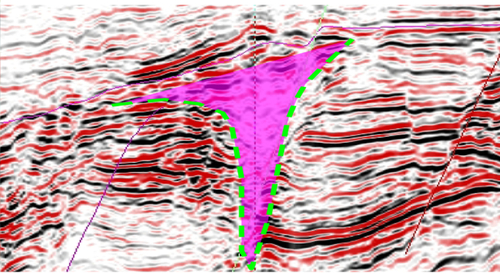
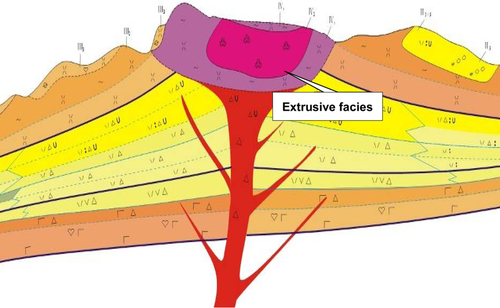
Located in the upper part of the volcanic conduit, this facies comprises the extruded bodies in regular mound, dome, cone, or bell shapes, formed by highly viscous lava that gushes out of relatively narrow conduits or fractures. The seismic profiles show chaotic seismic reflection characteristics of medium-weak amplitudes, medium-high frequencies, and poor continuity, with an umbrella-like pattern radiating from the center in the bottom (Figure 4.22).

4 Volcanic conduit facies
This facies is formed by magma retained and backfilled in the volcanic conduit, and mostly in subvertical columnar shape with a mixture of volcanic rock constituents. The seismic profiles mostly show chaotic reflection characteristics of weak amplitudes, high frequencies, and poor continuity, and in nearly upright columnar shape (Figure 4.23).
5 Subvolcanic facies
This facies comprises mostly sills, laccoliths, stocks, dikes, and veins. The constituents of its outer zone subfacies are mixed, whereas its mesozone and inner zone subfacies have consistent constituents and structures. The seismic profiles typically show chaotic reflection characteristics of strong reflection in the top and bottom parts, and weak amplitudes, medium-high frequencies, and discontinuity inside, and have irregular lenticular reflection shapes (Figure 4.24).

6 Volcanic sedimentary facies
This facies is represented mainly by overlap fills, often in bedded shapes, and with relatively good sorting of internal volcanic debris. The seismic profiles are characterized by parallel-subparallel reflection characteristics of strong reflection on the top and bottom, and medium-weak amplitudes, medium-high frequencies, and moderate continuity inside (Figure 4.25).
4.4.2 Profile facies identification
Profile facies of volcanic rocks are identified by tracing their top and bottom boundaries based on single-well facies identifications, well-seismic calibration, changes in seismic reflection characteristics, and interwell events of different lithofacies.
1 Calibrating profile facies based single-well facies
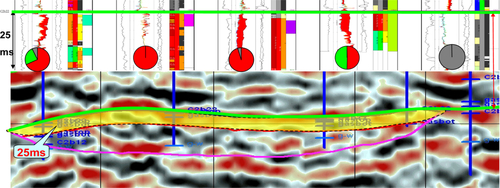
The resolution of single-well lithofacies identification is usually high, but the resolution of seismic data is low. As a result, when a single-well lithofacies is used for seismic calibration, the single-well data need to be properly coarsened based on the dominant lithofacies of the target layer. As shown in Figure 4.26, a large number of thin interbeds of volcanic sedimentary facies are developed in the volcanic formation encountered by Well CC1-3, but these thin interbeds are unidentifiable in seismic profiles. After coarsening treatment, six facies become recognizable in this well from top to bottom, hence good corresponding relationships are established with seismic profile reflection characteristics.
2 Profile facies identification
The types, shapes, distributions, and superposition relationships of volcanic lithofacies in profiles are analyzed and the traceable scopes of different lithofacies are determined by applying seismic facies patterns based on the volcanic facies divisions in single wells and constrained by the changes in seismic reflection characteristics between wells.
3 Profile facies tracing
Constrained by the internal structure of volcanic rocks and following the technical approach of boundary tracing (e.g., from big boundaries to small boundaries, from distinct boundaries to blurry boundaries), the volcanic facies boundaries are traced in succession, and volcanic facies in profiles are identified (Figure 4.27).

4.5 Planar prediction
Volcanic facies can reveal the spatial distribution of volcanic rocks and the petrogenetic relationships between different lithological assemblages. Based on the identification of single-well facies and profile facies, therefore, seismic facies can be predicted through the correlation and extrapolation of single-well facies, skeletal network control of profile facies, and well-seismic combination techniques; ultimately, the planar distribution of volcanic facies can be revealed.
4.5.1 Planar facies prediction based on single-well facies
The planar distribution of volcanic facies can be predicted reliably through well correlation and extrapolation between wells using the results from single-well facies identification, based on sufficient data from closely spaced wells.
1 Analysis of interwell distribution of lithofacies through interwell correlation
Constrained by the internal architecture of volcanic rocks, the lithofacies characteristics and interwell changes in each eruption period are ascertained and the range of lithofacies distribution in each eruption period is predicted through interwell correlations.
2 Analysis of planar distribution of lithofacies by extracting single-well lithofacies information for each eruption period
The lithofacies information (e.g., types, thicknesses) of volcanic rocks in each eruption period is extracted from wells and projected onto a plane, and the characteristics of lithofacies change are analyzed on the plane. As shown in Figure 4.28, the lithofacies in each eruption period are proportionally projected onto the planes, and the planar distribution characteristics and trends of lithofacies variation are analyzed. The results will serve as the foundation for establishing a planar lithofacies distribution model.

3 Establishing the planar lithofacies distribution model
Guided by the volcanic facies pattern, a planar lithofacies distribution model is established according to the shape of the volcanic edifice, the position of the volcanic conduit, and the characteristics of planar lithofacies distribution, which will provide guidance for predicting lithofacies distribution in different subzones.
4 Determining lithofacies boundaries to predict their planar distribution
Lithofacies boundaries are determined by extracting single-well subzone lithofacies thicknesses, with reference to the interwell and planar distribution models, to further predict the planar distribution of volcanic facies. For the superposed parts of lithofacies, relevant transition lithofacies belts, such as the eruptive-volcanic sedimentary facies transition belt, should be classified based on the lithofacies characteristics of their surrounding rocks (see Figure 4.28).
4.5.2 Predicting planar facies patterns based on profile facies
Based on seismic reflection profile identification and the established skeletal profile network that can effectively control the study area, as well as the constrained distribution pattern of volcanic edifices and volcanic massifs, the thickness variation of lithofacies is analyzed, the lithofacies boundaries are determined, and the planar distribution of volcanic facies is predicted. The prediction of planar facies distribution patterns based on profile facies can be realized through the following three steps.
1 Constructing a skeletal profile network that covers the entire study area
To effectively predict the lithofacies distribution across the study area, 22 skeletal profiles are constructed within Well Block DD17, including 11 profiles in the NE direction, 7 profiles in the EW direction, and 4 profiles in the NE-SW direction, which effectively control the planar distribution of volcanic facies in the study area (Figure 4.29).
2 Identifying profile facies, analyzing the distribution of lithofacies, and estimating the thickness variation of lithofacies
The variation characteristics of volcanic facies are analyzed in succession on the profile, and the traceable extent and interwell changes of different lithofacies are determined based on single-well lithofacies division for well points or seismic response models and seismic event variations of volcanic facies between wells. As shown in Figure 4.29, the distribution and variation trends of volcanic facies in profile are ascertained through profile facies identification.
3 Determining lithofacies boundaries to predict their planar distribution
By projecting the profile lithofacies distribution onto the plane, the lithofacies boundaries are determined and the lithofacies distribution is predicted based on lithofacies patterns, interwell lithofacies changes, and the variation trend of lithofacies thickness.
4.5.3 Predicting planar facies distribution based on seismic facies
Apparently different lithofacies have different seismic responses and seismic attributes. Based on single-well identification and profile identification, therefore, the planar distribution of volcanic massifs is ascertained by systematic analysis of seismic attributes and especially lithofacies-sensitive attributes, planar identification, and comprehensive prediction.
1 Analysis of sensitive attributes of lithofacies
Seismic attributes include a wealth of information on subsurface rock formations such as lithology, petrophysical properties, and fluid properties. In different eruption areas, the types of seismic attribute sensitive to volcanic facies are different. In volcanic facies analysis using seismic attributes, therefore, it is necessary to correlate and prioritize different seismic attributes and determine the sensitive seismic attributes according to their geological characteristics and seismic responses.
In the DD gas field case study, attributes such as waveform classification and root mean square (RMS) amplitude can be considered good reflections of volcanic facies characteristics. The explosive facies is typified by relatively tight lithology, poorly developed pores and fractures, characterized by seismic reflections of strong amplitude, low frequency, and high RMS amplitude; the effusive facies shows chaotic reflection characteristics of weak-strong amplitudes, medium-high frequencies, discontinuity, and medium RMS amplitude values; and the volcanic sedimentary facies seismically shows seismic reflections of medium-weak amplitudes, medium-high frequencies, good continuity, and low RMS amplitude.
2 Extraction of attributes
Volcanic lithofacies prediction has stringent requirements on seismic attributes, especially on the selection of the reference surface and time window. The basic principles are (1) select the geological interface with well-defined geological significance as the reference surface; (2) determine the time window size according to the position and thickness of the target layer. When studying the distribution of volcanic facies in various periods, for example, it is preferable to use the top and bottom contacts of different volcanic periods as the boundaries to extract seismic attributes; when studying the lithofacies distribution in gas zones, it is necessary to determine the boundaries based on the distribution and thicknesses of gas zones.
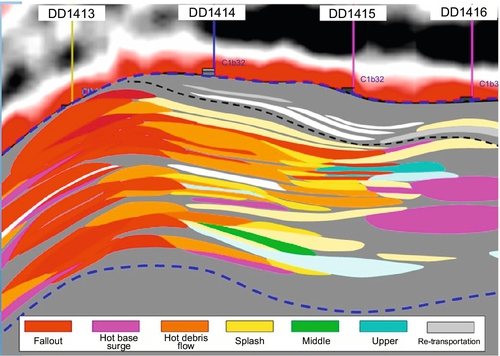
The volcanic gas zones in Well Block DD are located mainly within the range of 100 m depth below the top of volcanic rocks, and the seismic attributes are generally extracted from the 40- to 50-ms time window beneath the top of the volcanic rock body. In comparison, the volcanic gas zones in Well Block XX are located mainly within the range of 150 m in the top part of each volcanic edifice, and the seismic attributes are generally extracted by opening a 60- to 70-ms time window downward from the top of volcanic edifices. Figure 4.30 shows a case study on the extent of planar distribution and changes of the explosive facies within 50 m in the upper part of Well DD14. It is determined that the target layer in the seismic profile corresponds to the formation of 23 ms downward from the top of the volcanic edifice; therefore, seismic attributes are extracted by opening a 25-ms time window downward from the top of the volcanic edifice, and the characteristics of planar distribution and changes of the explosive facies are thus ascertained.
3 Planar prediction
1) Analysis of single attributes
This technique refers to the use of a single sensitive seismic attribute to predict the planar changes of lithofacies. Guided by the volcanic facies distribution model, lithofacies distribution is predicted according to the changes of attribute values and by calibrating the single-well lithofacies division against seismic attributes.
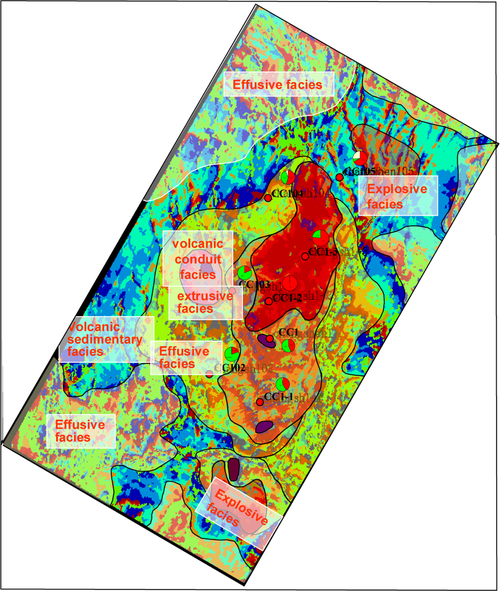
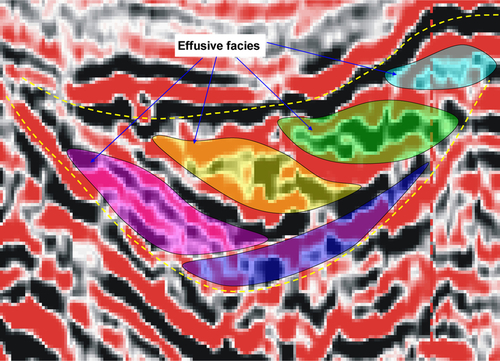
Figure 4.31 illustrates the planar distribution of lithofacies predicted through waveform classification attributes in CC gas field. The red, yellow, orange, pink, dark brown, and blue areas stand for different waveform characteristics and reflect different lithofacies types, respectively. In particular, the red areas stand for explosive facies regions, the yellow areas for effusive facies regions, the orange areas for mixed explosive and effusive facies, the pink areas for extrusive facies, the dark brown areas for volcanic conduit facies, and the blue areas for volcanic sedimentary facies. In Figure 4.32, different RMS amplitude values also reflect the distribution of different lithofacies.

2) Combined prediction of multiple attributes
Different seismic attributes reflect different geological formations and, therefore, the prediction of volcanic facies distribution from a single attribute can lead to multiple interpretations. The combined analysis determined by integrating multiple attributes can effectively reduce the uncertainty in prediction results. The principle is to give different weight values to different attributes according to their corresponding relationships to volcanic facies, and the weight values are converged to obtain a comprehensive attribute distribution map.
Figure 4.33 is the lithofacies planar distribution map of the CC gas field derived from comprehensive prediction from waveform classification, RMS amplitude, and instantaneous phase attributes. Subsequently drilled wells have verified these prediction results, whereby the planar distribution characteristics of lithofacies in the CC gas field have been identified reliably.

4.6 Spatial prediction
4.6.1 Profile tracing closure technique
To predict the 3D spatial distribution of lithofacies, the tracing and closing of volcanic facies boundaries are carried out based on the seismic facies patterns, by establishing a skeletal profile network that can effectively control the study area, with constraints by volcanic edifices and massifs. When applying this technique, the usually rapid change of volcanic facies and significant lateral changes in their thicknesses pose challenges in seismic identification and tracing of each lithofacies.
4.6.2 Integrative technique for lithofacies analysis by stratigraphic slicing
Volcanic rocks are often formed in multiple periods and accordingly seismic attributes within volcanic massifs are extracted in terms of the eruption periods. On the basis of the planar prediction of lithofacies at individual periods, the spatial distribution characteristics of lithofacies are revealed according to the results of single-well lithofacies and profile facies identifications.
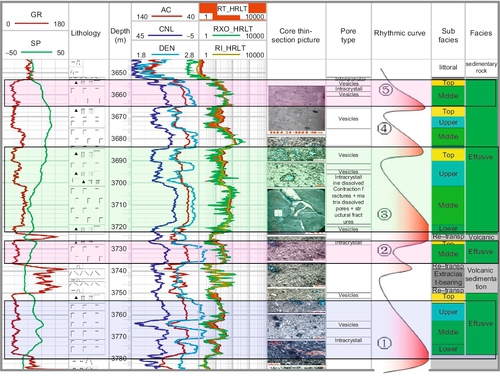
This technique is explained herein using the case study in the #YC2 5 volcanic massif in Block CC1. Vertically, the YC2 5volcanic massif encountered in Well CC1 can be separated into three vertically stacked volcanic eruption periods. Interval 3550 to 3587.6 m is composed mainly of tuff and crystalline tuff, formed as a hot debris flow subfacies and fallout subfacies of the explosive facies; interval 3587.6 to 3811.0 m consists of various rhyolite and autoclastic brecciated lava, formed as the top, upper, middle, and lower subfacies of the effusive facies; interval 3811.6 to 3852.5 m comprises welded tuff, rhyolite, and welded breccia, interbedded with volcanic breccia, accumulated as alternating effusive facies and explosive facies.
Within the #YC2 5 volcanic massif, the planar distribution of lithofacies in each of the three eruption periods is predicted using the attribute analysis technique. As shown in Figure 4.34, the explosive facies are mainly developed in the top part of the #YC2 5 volcanic massif, and the effusive facies in a nearly south-north (SN)-trending area to the east of Well CC1 and to the west of Well CC1-3; the effusive facies are mainly developed in the middle part, and the lithologies in Wells CC1 and CC1-2 include rhyolite, vesicular rhyolite, and autoclastic brecciated lava, with multiple effusive facies; the lower part is characterized by alternating explosive and effusive facies. The drilling results have since revealed multiple lithologies such as rhyolite, welded tuff, volcanic breccia, autoclastic brecciated lava, and so on.
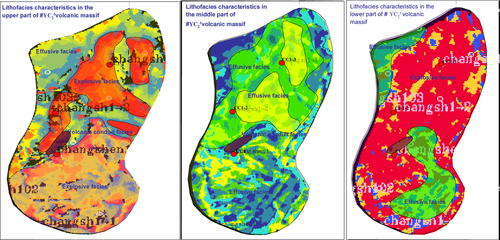
The spatial changes of volcanic facies are determined systematically on the basis of planar distribution predictions of lithofacies in each period, in combination with information on vertical changes of lithofacies in wells and in different periods. The #YC2 5 volcanic massif corresponds to a crater between Well CC1 and Well CC1-2; the lithofacies analysis shows that neither the explosive nor the effusive facies of the #YC2 5 volcanic massif has the characteristics of inherited development vertically, its upper and lower parts being composed mainly of explosive facies and the middle part of effusive facies. The favorable facies belt is the effusive facies in the middle of the volcanic massif, and the favorable zone is the effusive facies regions to the east of Well CC1-2 and the region near the volcanic conduit between Well CC1 and Well CC1-2.
4.6.3 Technique for 3D attribute volume analysis
This technique extracts the spatial attribute parameters of lithofacies and reveals their distribution patterns by applying 3D attribute volumes sensitive to volcanic facies and establishing attribute classification criteria for different lithofacies. There are primarily four steps in this technique: (1) establishing the volcanic facies classification criteria for seismic attributes through sensitivity analysis, (2) extracting various sensitive attributes within the 3D space using the volume attribute extraction technique, (3) extracting 3D space data points of various volcanic facies according to the classification criteria and combining them based on their spatial locations, and (4) performing superposition and systematic analysis based on the prediction results of multiple attributes to achieve a comprehensive prediction of the spatial distribution of volcanic facies.
4.7 Characterization of volcanic facies
Characterization of the shapes, scales, and superposition relationships of volcanic facies and delineation of the distribution of volcanic facies are conducted based on volcanic facies identification, using outcrop, seismic, and dense well grid data.
4.7.1 Characterization of volcanic facies geometry (shape)
1 Characterizing volcanic facies geometry from outcrop data
Field outcrop investigation is an important step for volcanic facies study, as it is the most intuitive, accurate, and reliable approach to acquire data. The process of characterization consists of the following four steps.
1) Profile selection
Proper profiles are selected through geological surveys and regional geological analysis. The volcanic gas reservoirs of the Songliao basin are located mainly in the volcanic rocks of the Yingcheng Formation; 37 volcanic outcrop profiles (approximately 3 km long, covering an area of approximately 13 km2) of the formation located at Shichangcun, Huangtu’aizi, in the Yingcheng Coal Mine and the Santai regions in the east of the basin have been selected for this study.
2) Lithofacies identification
On the basis of the selected lithofacies profiles, the lithofacies of the type localities are identified and the profiles calibrated with reference to the typical rock types, textures, and structure marks of outcrop profiles.
The study involves 1886 field photos and 878 samples, with the following results: at the outcrops, the Yingcheng Formation consists of vesicular rhyolite, volcanic breccia, agglomerate, perlite, and cryptoexplosive breccia, with perlitic and cryptoexplosive breccia textures, and rhyolitic to lithophysa structures. This indicates the presence of volcanic neck subfacies and cryptoexplosive breccia subfacies of the volcanic conduit facies; fallout subfacies and hot debris flow subfacies of the explosive facies; lower, middle, and upper subfacies of the effusive facies; inner zone subfacies of the extrusive facies; and xenoclast-bearing subfacies of the volcanic sedimentary facies.
3) Mapping profile and planar facies
Identification of volcanic profile facies and planar mapping of volcanic facies distribution are based on volcanic facies markers, in combination with data on crater position, volcanic edifice distribution, change in volcanic sequence boundaries, and pinchout patterns of volcanic massifs, as well as ground-truthing measurements, trenching, and drilling data (Figure 4.35).
4) Characterizing volcanic facies shape/geometry
The volcanic lithofacies of the Yingcheng Formation in the Songliao basin consists mainly of explosive and effusive facies, with different facies showing different shapes and other characteristics.
1. Shape of explosive facies. The explosive facies comprises mainly volcanic breccia (fallout subfacies), crystal welded tuff (hot clastic flow subfacies) and bentonite layers (fallout subfacies), and occasionally drop-pebble volcanic bombs. This facies typically has a wedge-shaped geometry but can be mound-shaped locally. The outcrops at the Yingcheng Coal Mine are the most typical of such geometry.
2. Shape of effusive facies. The effusive facies is characterized by tight massive basalt (lower subfacies), vesicular basalt (upper subfacies), and tight massive dacite (lower subfacies). This facies mainly has a bedded geometry (Figure 4.36), as is typified by the volcanic outcrops in the Santai area.

3. Shape of volcanic conduit facies. This facies is represented primarily by mauve basaltic agglomeratic lava (volcanic neck subfacies) and cryptoexplosive breccia (cryptoexplosive breccia subfacies). This facies is unique in having a columnar or dendritic morphology (Figure 4.37). It is characterized by the main profile in Guanmashan, Shichangcun.
4. Shape of volcanic sedimentary facies. Member Ying-I shows polygenetic conglomerates of volcanic sedimentary facies with good sphericity and poor sorting, comprising mainly debris of rhyolite, basalt, quartzite, and metamorphic rocks, as well as quartz (chert) and feldspar phenocrysts. The matrix is mostly sedimentary rocks. The volcanic sedimentary facies in this region is composed mainly of sedimentary tuff (xenoclast-bearing subfacies of volcanic sedimentary facies), having a bedded morphology. This facies is typified by the main profile in Guanmashan, Shichangcun.
5. Shape of extrusive facies. The extrusive facies outcrop at Huangtu’aizi is composed mainly of perlite (inner zone subfacies), but its morphology is not shown incompletely. The extrusive facies in the outcrop at Guanmashan contains perlite and brecciated lava, forming a cut-drape relationship with the explosive and effusive facies sequences. It has a flat top and steep sides, showing an umbrella- or mushroom-like geometry (Figure 4.37). This facies geometry is best represented in the Huangtu’aizi region.
2 Characterizing volcanic facies geometry using seismic data
The shapes of volcanic facies are effectively characterized through seismic profile identification as well as planar and spatial prediction, guided by the geological models derived from outcrops.
1) Volcanic facies geometry in profile
In the studied profiles, the explosive facies is primarily mound shaped, the effusive facies wedge shaped or bedded, the volcanic sedimentary facies bedded, the extrusive facies umbrella-like, the volcanic conduit facies subvertically columnar, and the subvolcanic facies usually lenticular or wedge shaped (Figure 4.38).

2) Volcanic facies shapes in plan view
The explosive facies are distributed around the crater and appear mostly in sheet or potato shapes in plan view; effusive facies are distributed outside the explosive facies and appear mostly in straps; the volcanic sedimentary facies occur in topographic lows and commonly appear as embayment or straps; the volcanic conduit facies is primarily rounded or elliptical; and the subvolcanic facies primarily has an elliptical outline (Figure 4.39).

4.7.2 Characterizing volcanic facies size
1 Characterization of lithofacies size using outcrop data
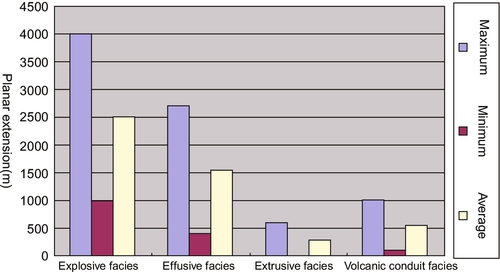
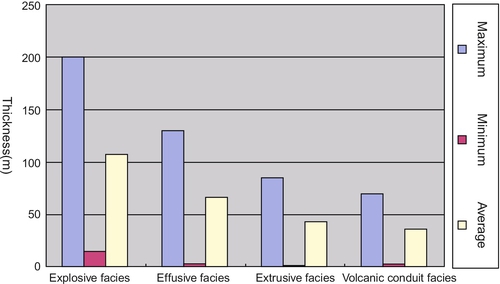
Field surveys revealed rapid lateral and vertical changes in the volcanic facies of the Yingcheng Formation in the Songliao basin. The explosive and effusive facies have the largest size, whereas the extrusive facies is the smallest. The explosive facies has a planar extension of 1000 to 4000 m and a vertical thickness of 15 to 200 m; the effusive facies has a planar stretch of 400 to 2700 m and a vertical thickness of 3 to 130 m; the extrusive facies has a planar extension of 3 to 600 m and a vertical thickness of 1 to 85 m; and the volcanic conduit facies has a planar extension of 110 to 1000 m and a vertical thickness of 3 to 70 m (Figures 4.40 and 4.41).
2 Characterization of lithofacies size using seismic data
Guided by the geological models derived from outcrops, the planar extent and vertical thicknesses of volcanic facies can be effectively characterized using seismic profile identification as well as planar and spatial prediction.
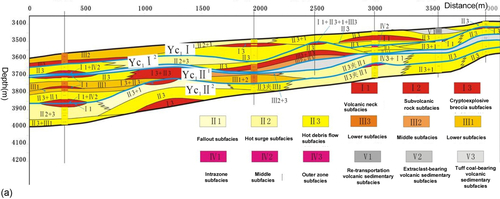
In the case study of Well Block XSS2, the volcanic facies in Well Block XSS changes rapidly with significant variations of thicknesses, with the explosive and effusive facies having the largest size (Figure 4.42).
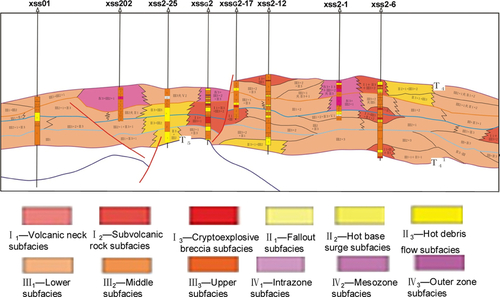
The lateral extent of explosive facies has a range of 700 to 3100 m and a vertical thickness of 70 to 140 m; the lateral extent of effusive facies ranges from 500 to 4000 m and has a vertical thickness of 70 to 400 m; the lateral extent of extrusive facies ranges from 400 to 1200 m and has a vertical thickness of 50 to 150 m; and the lateral extent of volcanic conduit facies ranges from 700 to 1300 m and has a vertical thickness of 50 to 150 m (Figures 4.43 and 4.44).


Dense well grid data contain abundant geological, logging, and performance information and are important for volcanic facies investigations. The main steps of characterizing volcanic facies size with dense well grid data include the following:
1. Select a well block with close well spacing, and divide volcanic facies in all single wells based on lithofacies markers.
2. Combine the positions of volcanic edifices and massifs in the well block through interwell correlation to analyze the lithofacies distribution between wells.
3. Calibrate seismic data using geophysical logging data to trace profile facies, extract the extent and thicknesses of different lithofacies, and determine the association relationships between lithofacies under the constraint of seismic event changes, interwell reference of seismic reflection characteristics, and lithofacies variation trends.
4. Predict planar distribution of lithofacies based on single-well lithofacies division at well points or constrained by seismic attributes, as well as distribution of volcanic edifices and massifs between wells.
Volcanic massifs in Well Block XX1 are formed from multistage eruptions with multiple craters, the sizes of volcanic massifs being relatively small, and of mainly explosive facies and minor effusive facies. The lithofacies are relatively small in scale. The lateral extent of explosive facies is 200 to 800 m, and vertical thickness is 60 to 120 m; and the lateral extent of effusive facies is 300 to 1200 m, and vertical thickness is 45 to 100 m (Figure 4.45).

4.7.3 Characterizing superposition relationships of volcanic facies
The superposition relationships among volcanic facies are controlled by factors such as volcanic eruption mode, paleogeomorphology, lithofacies type, and magmatic melt volume. These relationships reflect the superposition, migration and change of volcanic rocks during its formation and evolution. The spatial superposition patterns of volcanic facies are generally classified into four types: alternating, imbricated, parallel, and isolated.
1 Alternating superposition
This superposition relationship results from frequent changes in volcanic facies and is the predominant superposition relationship of volcanic facies. The alternation occurs mainly near the crater, reflecting the development of volcanic facies during different periods stacking on one another. It is characterized by a single lithofacies forming multiple, superimposed lithofacies belts (Figure 4.46).
2 Imbricated (unilateral) superposition
This type is developed mainly in explosive and effusive facies formed by acidic lava, with erupted material accumulating near the crater. The explosive facies initially accumulates near the crater. As the accumulation space decreases, it migrates gradually away from the crater zone and shows a reversed imbricating superposition relationship, with the low parts superposed on high parts (Figure 4.47). The effusive facies begins by accumulating in the low parts due to magmatic melt filling. As the filling raises up, it migrates gradually closer to the crater zone, resulting in a normal imbricating superposition relationship, with the high parts superposed on low parts (Figure 4.48).

3 Parallel superposition
This relationship occurs mainly in effusive facies of neutral and basic lava and volcanic sedimentary facies. After volcanic lava surges out of the surface from the crater, it accumulates near the crater and shows a nearly bedded morphology. The lava of various eruption periods is superposed on one another vertically to form a nearly parallel superposition relationship (see Figure 4.48).
The volcanic debris of volcanic sedimentary facies from various eruption periods is transported and sorted by water currents, showing parallel and subparallel distribution characteristics in the stratigraphic succession, with a predominantly parallel superposition (Figure 4.49).

4 Isolated superposition
This type is developed mainly in subvolcanic, volcanic conduits, and extrusive facies and is characterized by unconformable contact between the lithofacies and surrounding rocks that lack associated lithofacies. In addition, isolated superposition may also occur in the limb of a volcanic edifice, where unstable slope may slide and collapse due to an excessive accumulation of volcanic deposits (Figure 4.50).

4.8 Technological applications and effects
The volcanic facies identification and prediction technology has been applied to determine the shapes, scales, and superposition relationships of volcanic facies; to reveal the physical properties of different lithofacies; to guide reservoir prediction; and to provide facies control constraints for geological model building.
4.8.1 Revealing lithofacies distribution and predicting favorable facies
Different volcanic facies have different diagenetic mechanisms so that different pore-fracture associations are developed during their diagenetic process, ultimately leading to a different accumulation capacity for different lithofacies [22]. Accordingly, favorable petrophysical properties are found in the top and upper subfacies of the effusive facies, the splash and fallout subfacies of the explosive facies, and the outer zone and mesozone subfacies of the subvolcanic facies (Figure 4.51). With the volcanic facies distribution pattern as a guidance, the distribution characteristics of favorable lithofacies belts can be determined through lithofacies identification and prediction, which will facilitate the prediction of effective reservoirs and improve the accuracy of reservoir prediction.

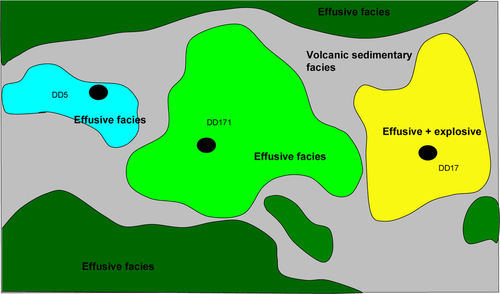
In the case study on the volcanic gas reservoir in Well Block DD17, for example, the basalt, basaltic breccia lava, basaltic welded breccia, and sedimentary tuff of effusive facies are interbedded with each other, and the reservoirs are developed mainly in the top and upper subfacies of effusive facies. Because the wave impedance of the reservoir in this gas field is similar to that of sedimentary tuff, the inversion method cannot be used to identify reservoirs effectively. Planar prediction of volcanic facies revealed the distribution characteristics of favorable facies belts (effusive facies) in this well block (Figure 4.52) and provided a basis for predicting favorable reservoirs. These interpretations have since been validated by drilling results.
4.8.2 Ascertaining the spatial distribution of lithofacies and providing facies control constraints for geological model building
Volcanic lithology and lithofacies change rapidly, with correspondingly strong reservoir heterogeneity. Therefore, it is difficult to depict the complex architecture of volcanic rocks using the modeling methods based on conventional structural constraints. In the CC1 gas field case study, 3D framework and lithofacies modeling has been achieved based on architectural analysis, lithofacies identification, and prediction of volcanic rocks, constrained by volcanic edifices, volcanic massifs, and volcanic facies (Figure 4.53). These models have helped improve the validity of the volcanic geological model and depict the architectural characteristics of volcanic rocks objectively.