
Chapter 2
Set Up and Improve Usage of Key Web Analytics and Testing Tools
Before you can begin to optimize your website, you first need to arm yourself with and make better use of web analytics and website testing tools. These will help you measure and analyze the performance of your website and then test new versions to help improve it. Without making effective use of these tools, your optimization efforts will be blinded, inefficient and usually end with disappointing results.
Chapter Contents
- Week 1: Learn the Importance of and Set Up an Analytics Tool
- Week 2: Find Your Conversion Rate, Success Metrics, Benchmark, and Set Targets
- Week 3: Learn the Importance of and Set Up a Website Testing Tool
Week 1: Learn the Importance of and Set Up an Analytics Tool
For the first week in this book, you will focus on the growing importance of web analytics tools, the website data they provide, and the key role they play in helping optimize websites. You will also learn about various web analytics tools available to you and how to set up goals and segments within these tools to maximize the insights you will gain from them.
Monday: Understand the Need for Web Analytics Data to Help Website Optimization Efforts
First you need to learn the importance of web analytics and their key relationship with website optimization efforts, as you are essentially blinded without having access to and usage of them.
In order to truly begin optimizing your website, you first need to understand your current website performance; for example, how visitors interact with it, the amount of sales or leads it generates, and the trends that are occurring on it. The best and easiest way to gather this important information about your website is to set up a web analytics tool on it to collect web analytics data about the usage of it. In other words, you are using this analytics tool to gather visitor click stream data that reveals such things as where your visitors come from, where they arrive on your website, what they look at and click on, and where they leave.
Having this website analytics data and insight is essential for your website optimization efforts for the following four key reasons:
Even with the rise in the understanding of and need for web analytics over the last five years, web analytics are often still neglected, with far too many online marketers thinking that just having a web analytics tool in place is good enough and as a result don’t make much use of these tools.
There have also been several great new tracking technologies appearing in recent analytics tools, but unfortunately, many companies don’t know about these or how to best implement them.
As a result of these factors, many online businesses’ web analytics tools gather only basic, inaccurate, or incomplete web analytics data. This leads to decisions being made from inaccurate and misleading data, which then leads to sub-par or even negative website optimization efforts.
Even if you know you have a good web analytics implementation, your web analytics reporting and analysis may not actually be providing good insights for two common reasons. You may just be grinding out very basic high-level reports that don’t offer much insight, and/or you may be overanalyzing your website data and therefore making it very hard to form actionable insights about it. Therefore, next week you’ll learn about best practices for the key metrics and reports that you need to focus on.
Tuesday: Select a Web Analytics Tool for Your Website
Next, you need to evaluate the different web analytics tools and vendors that are currently available and select one to use on your website. With the recent popularity and importance in web analytics over the last five years, you probably already have a web analytics tool installed on your website, but you need to make sure that it uses newer analytics technologies and that it provides the depth of data you need. Therefore, it’s important to quickly review the most common web analytics tools available, and hopefully discover some better ones that will help you gain greater level of insight into your website.
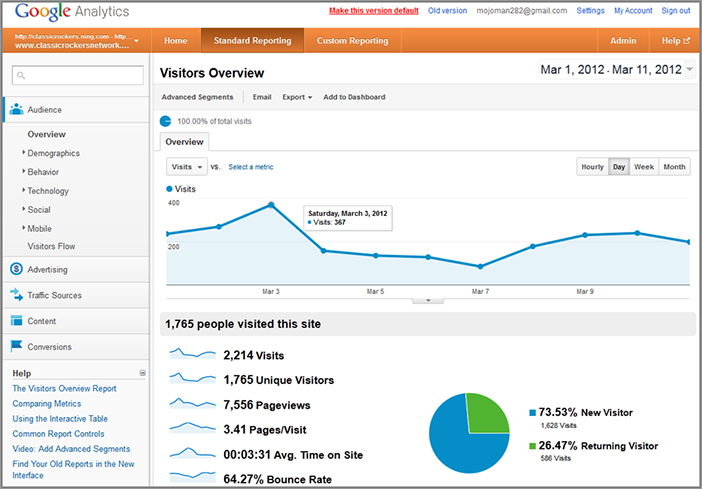
First of all though, you need to make sure you are using a modern onsite JavaScript-based analytics tool like Google Analytics that tags all of your pages to gather web analytics data. Surprisingly, some traditional companies still rely on older log file–based web analytics tools that track every file and image server call (like Webalizer or AWstats) instead of just tracking page- and visitor-based events. These have proven to be a very ineffective and misleading way of measuring web analytics in comparison to the newer JavaScript-based tools.
You should also avoid relying on a panel-based analytics tool like the one offered by comScore (www.comScore.com) to measure your website performance. This is because panel-based tools only provide you high-level metrics and don’t enable you to analyze more in-depth visitor behavior patterns and obtain visitor insight. They also are based on sample data, much like how TV ratings work, so they aren’t as accurate as JavaScript-based tools like Google Analytics.
Free and Budget Web Analytics Tools
Figure 2-1: Screenshot of Google Analytics
Other budget web analytics tools that you could also consider are Woopra (www.woopra.com) and Yahoo Analytics (web.analytics.yahoo.com).
Enterprise-Level Web Analytics Tools
Figure 2-2: Screenshot of Adobe SiteCatalyst
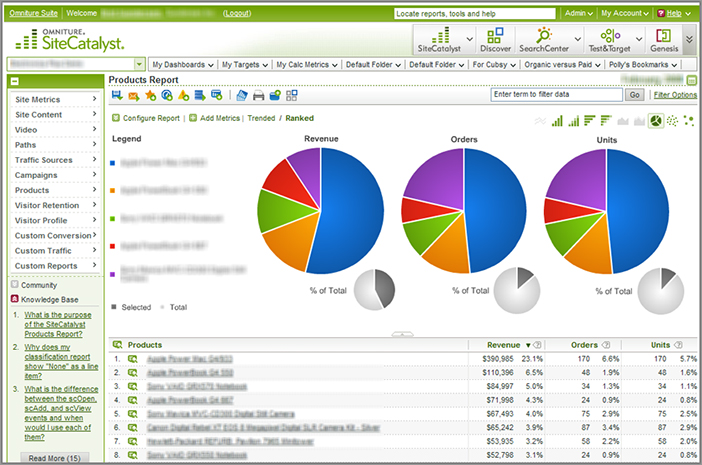
If you are currently using a web analytics tool that is not JavaScript tagging-based like these ones listed here, I definitely recommend you implement one of these and make it your main source of website metrics.
Other Things to Consider When Evaluating a Web Analytics Tool
While feature set and monthly cost are very important factors, there are a number of other things you should consider before choosing a web analytics vendor. First, you should understand the level of support and consulting that is included in the price of the tool, because this can vary hugely between the tool vendors. Having this official support can be particularly helpful when setting up the tool and customizing it on your website to make optimal use of its features and reach its full tracking potential.
Second, many of these vendors vary in terms of their implementation costs, so if you have a complicated website with particularly complex web analytics needs, I suggest you factor that into your decision and shop around in more detail.
Next, I suggest that you look at how well each tool integrates with the other web marketing tools or offline data sources you currently use or plan to use (like CRM or testing tools), because linking these together can help provide you even greater insight into your website performance. Tool integration can be costly if the web analytics tool doesn’t link well with the tools you currently own, which is a good reason to use a vendor with several other web marketing tools like Adobe.
And last, but by no means less important, you should remember to not spend your entire analytics budget on the tool, because you will need to reserve a good part of this to invest in growing your web analytics team and their expertise. Without this expertise with the tool, it will be very hard for you to create insight for use in your optimization and testing plans. In fact, the analytics guru Avinash Kaushik, author of Web Analytics: An Hour a Day (Sybex, 2007), goes so far as to state that there should be a 90/10 split in analytics funding, with 10 percent spent on the tools and 90 percent spent on web analytics personnel to help interpret and build insights from the data.
Wednesday: Implement Your Web Analytics Tool and Test to Make Sure It’s Working Correctly
Once you have selected the web analytics tool you want to use, you need to implement it on your website. Today you will learn more about this.
First of all, if you don’t consider yourself a web analytics expert, you are going to need help from a web analyst to implement it. If you don’t have a web analyst available in your company, you should try and hire one to help with this implementation, or get consulting help from your web analytics tool vendor or third-party vendor. You will also need to get help from your IT department to actually implement the tags on your website.
Obtaining this help with the analytics tool implementation is particularly important, because there is a much greater chance of mistakes being made if you try and implement it with limited web analytics knowledge or help. Not getting this help usually results in a negative knock-on effect on your ability to gain insights for improving your website optimization efforts.
Once you have implemented your web analytics tool, you need to perform quality assurance (QA) on it to see if the data is accurate and coming in as expected. If you had assistance implementing the tool, you would ideally use the same person to help perform QA on the data. Think of this as a means to prevent the garbage-in, garbage-out (GIGO) syndrome, meaning that if you don’t have very good data coming in, you are not going to get very good data coming out of the tool to make good insights.
If you don’t do a good job of QA on your web analytics data, you may end up gathering inaccurate data about your website and therefore unwittingly be making bad website decisions or damaging your ability to form reliable insights needed for your website optimization efforts.
Luckily, there are a number of tools that automate the checking of analytics code on each of your pages for web analytics tags, including a great one called WASP(www.wasp.com). In particular, you need to check that the analytics data is coming in correctly on the key pages of your website; for example, the shopping cart and checkout flow if you have an e-commerce website, or the lead capture pages if you have a lead generation website.
One of the key things you need to check for and improve is the names of your pages coming into your web analytics tool and ensure that each of your pages uses a good naming convention. Having this better page naming convention in place makes it much easier for you to interpret and understand your analytics data in the long run and leaves less room for error. The key for this good naming convention is to always make sure your page names have clarity and context. For example, instead of just using your product name for pages, you should also include the section that the page belongs in (for example, Electronics). You should also make sure that the name of the page is understandable without needing to look it up first.
Here are examples of good and bad page names:
Other important things to check in your tool are that your traffic sources are coming in to it correctly, including your search engine keywords being driven to your website. To do this, consult your web analytics tool help to find these reports and make sure that you are seeing data that you would expect.
Thursday: Know How to Set Up Your Website Conversion Goals
Setting up website conversion goals in your web analytics tool helps you understand what constitutes success for your online business and enables you to track the success of your website optimization efforts. If you don’t set up any goals, you will be left in the dark regarding the impact of your efforts. Although you won’t actually be setting these conversion goals until next week, it’s important to first realize the importance of them and how to set them up in your analytics tool.
Before you set up your conversion goals, it’s important that you fully understand what your key conversion goals are and what constitutes success for your website. Surprisingly, many online businesses don’t have a firm understanding of their high-level conversion goals or don’t know how to measure or track them. Some web analytics tools (such as Adobe SiteCatalyst) use the term conversion events instead of conversion goals. However, both of these terms mean essentially the same thing: a method that enables you to measure your website goals by how many visitors convert for them.
Types of Website Conversion Goals and Success Metrics
To help you understand what your high-level conversion goals are likely going to be for your website, Table 2-1 lists some basic examples of conversion goals for five major website types. This table also gives you an indicator of how you set up each goal in an analytics tool.
Table 2-1: Website goals
| Website Type | Conversion Goal | Goal to Set Up in Your Tool |
| E-commerce | Product order | Order completion page |
| Lead generation | Generation of a lead | Form completion/thanks page |
| Media/brand websites | More ads seen/more ad revenue | Page views per visit is at least 5 |
| Blog | Newsletter signup | Newsletter signup thanks page |
| Community | Member signup | New member confirmation page |
However, please note that these conversion goals will vary depending on what your website offers and its unique value proposition, and you may also have multiples of them. Therefore you need to evaluate what constitutes conversion success for your website (usually these will be tied to your main business objectives) before selecting your high-level conversion goals.
Setting Up Conversion Goals in Basic Web Analytics Tools
Setting up these important conversion goals varies between web analytics tools. In basic tools like Google Analytics (and other tools should have a similar process), you simply need to go to the analytics settings for your website and add in a conversion goal. To do this in Google Analytics, click Add Goal, name your conversion goal, and enter the URL of the corresponding page that defines success (the goal URL). For example, if you are selling products, the page that defines success is your order completion page.
You should also include the page URLs for intermediary steps of the conversion flow (called Goal Funnel in Google Analytics), because this will help you measure when and how often your visitors abandon within key series of your pages like a shopping cart or registration process. Figure 2-3 shows an example of an e-commerce goal setup, including intermediary steps.
Figure 2-3: Setting up a goal in Google Analytics
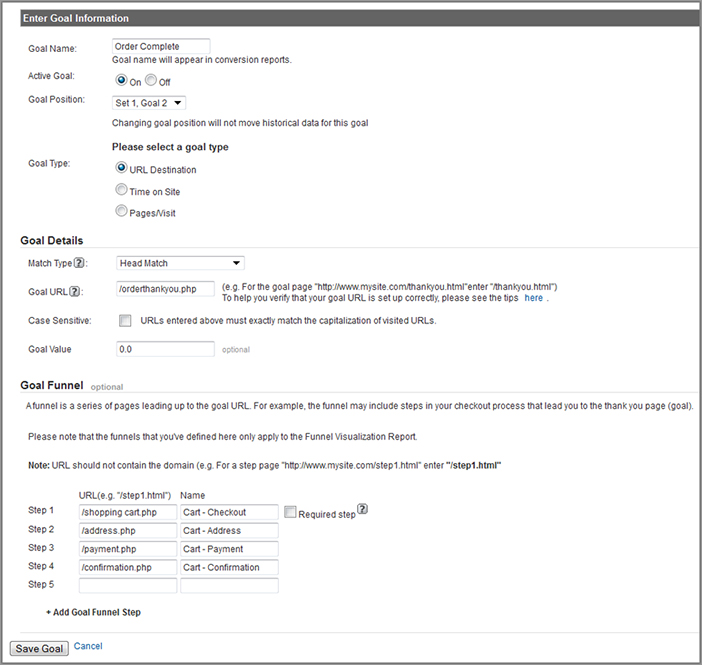
If you have the type of website that doesn’t have specific page-based conversion goals, such as media websites, there is also an option to choose one of a few other goal measurements like Time On Site or Pages/Visit (shown in Figure 2-3 under Goal Type).
However, one of the disadvantages of using this type of basic tool is that it’s hard to track complex conversion goals that are not page-based, such as button clicks or interactions with dynamic and interactive page elements. You may be required to do some custom technical work in order to implement these correctly.
One of the advantages of using basic analytics tools like these to track conversion goals though is that you don’t usually need to tag your pages with code for the success goal, because the tool simply tracks it by load of the page that defines success. This can often ease the testing implementation burden on your IT department as well.
Setting Up Conversion Goals or Events in Enterprise Tools
To set up these conversion goals in enterprise tools like Adobe SiteCatalyst, although you get more flexibility in what conversion goals you can track, unfortunately much more of a technical effort is needed to set them up.
First, for every conversion goal that you want to track on your website, you need to create a new goal (or event) variable in your tool, with the name of the corresponding conversion goal (for example, registration). Then you need to tag the code for this variable onto the page that defines success (for example, your registration confirmation page). Most good enterprise web analytics tool vendors will help you set these up correctly.
After you have set up and tagged your conversion goals or events on your website, you need to make sure they are coming in correctly to your web analytics tool. To do this, complete a conversion goal on your website and see if it shows up by checking your goals report or pulling in the conversion event metric into a traffic report.
As mentioned at the beginning of this section, you don’t have to actually decide on, set up, or test your specific website conversion goals yet—these things will be covered in detail for each type of major website next week. However, at this point, you should hopefully understand the importance of establishing conversion goals for your website, and how to set them up in your web analytics tool.
Friday: Set Up Key Segments of Visitors to Monitor and Target
It’s important to understand that website traffic patterns and conversion rates can often vary significantly, depending on key characteristics of different groups of your visitors. This can vary depending on the quality and type of your visitors (for example, their intent or demographics), and where they have arrived from. For example, your newsletter visitors may behave very differently than first-time visitors arriving from a search engine keyword. If you don’t set up these groups of visitors, you won’t be able to gather insights that may be influencing your conversion rate and optimize them. An example of this insight might be that your overall site conversion rate is 4 percent, but your paid search visitors group might only convert at 1 percent, bringing down your average for the website, thus meaning that group needs more immediate optimization attention.
Not only is it important to understand and monitor these differences, but you can also leverage these different groups of traffic in your testing tools by targeting different content to each of them, helping provide more relevant content to them. This increased content relevancy for your visitors will then improve the chances of them converting. Doing this targeting also really helps to personalize what your groups of visitors see on your website, rather than having a “one-size-fits-all” approach. This visitor targeting will be covered in more detail in Chapter 3 to help you get much more juice from your optimization efforts.
In order to monitor and optimize these important groups of visitors and the effects they have on your conversion rates, you need to set up several segments of visitors in your analytics tool. Think of these segments as visitors that share common characteristics: for example, how they got to the site, how many times they have been here before, or if they have purchased anything from the site before.
Most web analytics tools (including Google Analytics) feature the ability to create and analyze visitor segments on the fly, which is extremely powerful for monitoring key segments in real time. (Adobe SiteCatalyst users will have to upgrade to version 15 to get this real-time feature.)
Table 2-2 lists some of the key visitor traffic segments that you should set up in your web analytics tool (depending on what type of website you have).
Table 2-2: Basic visitor traffic segments
| Visitor Traffic Segment | Definition |
| Repeat Visitors | A visitor who has come to your website more than once |
| Loyal Visitors | A visitor who has come to your website at least three times a month |
| Registered Visitors | A visitor who has previously registered on your website |
| Repeat Purchase Visitors | A visitor who has previously bought from your website more than once |
| Loyal Purchase Visitors | A visitor who has previously bought more than three times from your website |
| Newsletter Visitors | A visitor who has arrived at your website from one of your newsletters |
| Google Search Visitors | A visitor who has arrived from a Google organic search |
| Bing Search Visitors | A visitor who has arrived from a Bing organic search |
| Paid Search Visitors | A visitor who has arrived from clicking on a paid search listing |
| Facebook Visitors | A visitor who has arrived from Facebook |
| Twitter Visitors | A visitor who has arrived from Twitter |
| Affiliate or Partner Visitors | A visitor who has arrived from one of your affiliate or partner sites |
| Multiple Purchase Visitor | A visitor who has purchased more than two times before |
Table 2-3 lists some more-advanced examples of traffic segments that you should set up, monitor, and target (again depending on your website type) and the purpose for setting them up. These will often require some extra code to set up, particularly when setting up segments that involve detailed information from visitors (like knowing exactly what they have purchased previously). Please see the help section of your analytics tool to set up advanced visitor traffic segments like these.
Table 2-3: Examples of advanced visitor traffic segments
| Visitor Traffic Segment | Description and Purpose |
| Goal Conversion Visitors | Depending on whether your visitors convert for your goals or not, they will often act a lot differently. This segment enables you to track these types of visitors and is great for understanding what causes them to sign up as well as to target them. |
| Visitors by Work/Non-work Hours | Your website may attract different types of visitors at different times of the day. This traffic segment enables you to target visitors based on what time they typically come to your website. |
| Visitors by Day of Week | Your website may attract different types of visitors on different days of the week. This traffic segment enables you to target visitors based on what day they typically come to your website. |
| Visitors by Geographic Region | Your website may attract visitors from different countries or regions. This traffic segment enables you to target content to visitors based on which region they are coming from to increase engagement and conversions. |
| Visitors at Different Phases of Signup or Purchase Process | If your visitors don’t complete a signup or purchase process (for example, a shopping cart checkout, or a quote for something), you can target these visitors and show them content that persuades them to finish the process. |
| Registered Visitors Who Have Specific Demographics | You can segment and target registered visitors who represent demographics that are of particular interest to you, for example by different age group or income level. As long as you can pull this information from their account, you can segment these visitors to show them different content to increase engagement and conversions. This is a very advanced visitor segment to set up and target. |
| Visitors Who Have Purchased Specific Things | Depending on what your visitors have previously purchased, you can target different content to them to increase engagement and conversions—for example, to make sure they don’t see promotions for products already purchased, and to show related or upsell items to what they have purchased previously. This is often the most advanced type of visitor segment to target. |
- Operating System (for example, Windows versus Mac)
- Browser (for example, Firefox versus Internet Explorer)
- Screen Resolution (for example, 1024 × 768 versus 800 × 600)
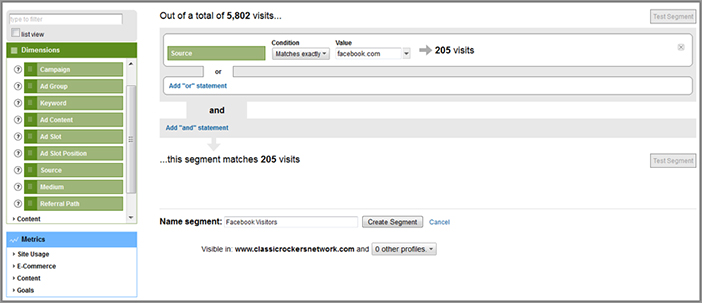
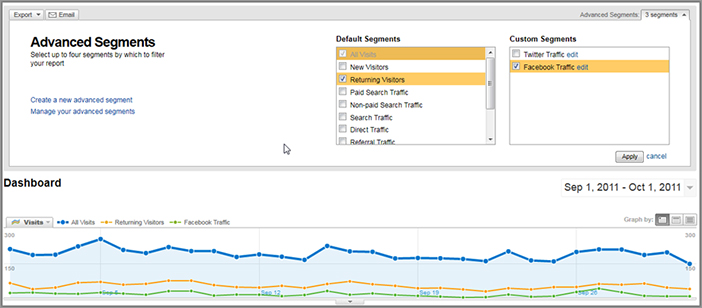
Setting these visitor traffic segments up varies depending on which analytics tool you have. Some of these tools (such as Google Analytics) allow you to set up segments based on rules that you create (for example, by particular search engines or which sections they visit), and other tools already have the most common visitor segments set up for you (such as the basic traffic segments listed in Table 2-2). Setting up segments related to your specific website goals requires that you have adequate conversion goal tracking set up, as you learned yesterday. As an example, Figure 2-4 shows the steps needed to set up a Facebook visitors segment in Google Analytics.
Figure 2-4: Example of setting up a visitor traffic segment in Google Analytics.
If you have a web analyst or analytics consultant available to you, I suggest that you get help from them to set these up. If you don’t have this type of help available and want to get more details on setting these visitor segments up for your particular web analytics tool, please review the help section in your analytics tool.
The next thing you need to do is to check that these visitor segments appear to be working correctly. To do this, simply navigate to your newly created segment (often by using a drop-down navigation menu at the top of your reports) and check some reports to see if your newly filtered segment makes sense. For example, in your Google search visitor segment, you can check your search engine reports to make sure that only traffic is arriving from this search engine and no others.
Figure 2-5 shows an example of a traffic report with two different visitor traffic segments in relation to all visits (returning visitors and Facebook visitors).
Figure 2-5: Example of a report containing visitor traffic segments in Google Analytics
After you have ensured that your visitor traffic segments are showing up correctly, you can focus on improving the performance and targeting of these segments (which you’ll learn about later in this book).
Week 2: Find Your Website Conversion Rate, Success Metrics, Benchmark, and Set Targets
This week, you’re going to focus on gauging how your website is currently performing in terms of conversion rates and success metrics. This is very important to do because it helps reveal what metrics and areas of your website need the most improvement and helps you set benchmarks and then targets to try and achieve.
Rather than only relying on your website’s overall conversion rate metric as a barometer of your website’s performance, you also need to use other success metrics to understand the root cause of your website’s performance and better diagnose issues. It’s much easier to optimize the performance of success metrics than it is to try and find and fix problems with your overall website conversion rate.
These success metrics usually have a direct correlated impact on your overall website conversion rate, and improving these metrics will usually raise that rate. For example, by reducing your shopping cart abandonment rate (which is a key success metric for e-commerce websites), you will also increase your website’s overall conversion rate.
Let’s start by discussing a few basic success metrics that can indicate how well your website is faring, no matter what type of website you have.
Monday: Check Your Current Traffic Levels and Set Targets
Today, you will check your most basic success metric, and that is your current website traffic levels. This is good to monitor because a well-optimized website is likely going to result in more repeat visitors (often equating to a greater amount of monthly unique visitors), and also increased usage when visitors are on your website (increasing your page views).
To check your current traffic levels, simply log on to your web analytics tool and run some simple reports to find the following high-level traffic metrics:
Next, you need to set a target to grow your traffic, and ideally you should set a target to grow your traffic by 20 percent over the next six months.
Tuesday: Check Your Website’s Overall Conversion Rate and Set Targets
Next you will learn about the simplest yet most important metric to help you understand the performance of your website and how well optimized it is. This is your website’s overall conversion rate. This is a great basic indicator of how many visitors are converting for any of your website goals out of the total that visit your website. This is usually also directly tied to the profitability of your online business.
In order to calculate your website’s overall conversion rate, use the following formula to find the relevant metrics in your web analytics tool:
Your Website’s Overall Conversion Rate =
(Number of website conversions - number of website visitors) × 100
The other reason why it’s so important to monitor and track this high-level conversion metric is because through your optimization efforts, you might end up optimizing a key success metric such as registration rate. That’s great, but at the same time, you might unknowingly reduce your total website conversion rate. And at the end of the day, you really should be aiming to improve all your success metrics as well as the overall conversion rate of your website, not just focus on improving one stand-alone success metric.
To help you apply this calculation to your website, a unique website conversion can be in the form of orders or leads generated for example. You should also add together the values for multiple types of conversion goals if your website has more than one—for example, leads generated plus registrations generated—because both of them may be conversion goals for your website.
Unfortunately, many web analytics tools don’t make it very easy to find this overall conversion rate, but many allow you to create a custom metric that you can pull into reports. For example, in fully customizable tools like Adobe SiteCatalyst, you can easily create a calculated metric and pull it into any report, but unfortunately, it’s much harder to do in basic tools.
Next you need to set a target for this metric. However, first it’s very important to realize that this overall website conversion rate will be unique to your website. It’s often useless and problematic to compare it to other industry conversion rates and can set unrealistic goals (as you’ll see in more detail toward the end of the week). Instead, just set a target to beat your current overall website conversion rate. Realistically, you should be able to beat your current rate by more than 2 or 3 percent over the next few months if you start to implement and test the best practices found through the rest of this book. While that may not sound a lot, that small increase can have a huge impact on increasing revenue for your online business.
And as discussed in the introduction to this week, while this is a very simple general barometer website performance metric, there are more revealing and more specific success metrics to help you optimize your overall website conversion rate. You’ll learn how to use these success metrics during the rest of this week.
Wednesday: Check Your Repeat Visit Rate and Set a Target
Another basic and very important success metric to check is your website’s repeat visit percentage rate. This identifies the number of your visitors that come back more than once in relation to the total number of visitors to your website.
The reason why this metric is so important to understand, monitor, and optimize is because the more your visitors come back to your website the better. This is because they are usually more engaged if they return, and as a result, they’re usually more likely to convert for your conversion goals in the future, and usually convert quicker than first-time visitors do. Therefore, overall a high repeat visit is a great sign of an engaging, well-converting website.
It’s also much cheaper to get visitors to come back to your website rather than generating new visitors for it. If you have a basic tool like Google Analytics, the best way to check your repeat visit rate on your website is to pull up the New vs. Returning Report, and simply look for the percentage of returning visitors metric. If you need to work this out manually in other tools that don’t have this built-in report, you just need to find the number of repeat visitors to your website, divide that by the number of total visitors to your site in the same timeframe, and then multiply by 100 to get a percentage. Once you understand how to find your repeat visit percentage rate, log on to your analytics tool and find the last 90 days’ average for your repeat visit rate. Jot this number down somewhere so you can refer to it later.
Next, you need to set a target of what you would like your repeat visit percentage to be. A realistic goal would be at least 20 percent, because most websites that don’t do a good job of attracting repeat visitors would have less than 10 percent repeat visit rate. Remember though, just as with your overall website conversion rate, there is no perfect repeat visit rate—this will vary by your website type and what your unique value proposition is. The main thing is to increase your current repeat visitor rate, hopefully by at least 5–10 percentage points.
In Chapter 8 you will revisit this topic in much more detail and learn best practices to specifically help increase your repeat visit rate.
Thursday: Find Specific Success Metrics for Your Website Type and Benchmark
Rather than just relying on and focusing on improving your overall website conversion rate, today we are going to focus on finding multiple micro-level success metrics for your website. These much more granular metrics help you diagnose and measure your optimization efforts better.
This is crucial because if you only focus on one single conversion indicator, you are likely to be missing out on crucial insights that would help you optimize your website even further. For example, you may have a really high checkout completion rate, but this doesn’t mean as much if your top entry pages have a really high bounce and you aren’t managing to get very many people to your shopping cart, let alone try and convert them.
These success metrics are also very important to use when you start running tests to optimize your website. This is because in testing tools they are used as the main way to define and determine testing success for each test you run.
You should also realize that while there are many types of website success metrics, they also vary depending on the type of website that you have. For example, e-commerce websites are going to have much different success metrics than a community website. Therefore, you need to understand the key success metrics specific to the type of website you have, and begin monitoring them to understand the success of your optimization efforts.
These success metrics can be broken down into primary success metrics and secondary success metrics, depending on the importance of them to your website’s primary business purpose, and you should ideally be working to improve your primary ones first.
In the following success metrics tables, find the website type that best matches yours, and note the key primary and secondary success metrics that you will need to benchmark and monitor. This will give you a great head start for understanding which success metrics you need to monitor and improve. Ideally, you want to try and improve each of the success metrics for your type of website, not just one or two of them (for reasons mentioned earlier).
E-commerce Website Success Metrics
These types of websites are ones that focus on selling single or multiple products (for example, Staples.com and Amazon.com).
| Success Metric | Definition | Importance |
| Shopping Cart Abandonment Rate | Percentage of visitors who start but don’t complete your shopping cart flow | Primary |
| Product Visits to Cart Additions | Percentage of visitors to product pages who add an item to their shopping cart | Primary |
| Products Per Order | Average number of products per order | Primary |
| Total Site Order Conversion Rate | Total number of orders total website visitors × 100 | Primary |
| Profit Per Order | Average revenue per order – operating cost per order | Primary |
| Average Order Value | The average monetary value of an order | Secondary |
| Average Number of Visits until Purchase | The average number of visits it takes before someone orders a product | Secondary |
Lead-Generation Website Success Metrics
These types of websites are ones that focus on generating leads like sales leads signups (for example, Cars.com and BankofAmerica.com).
| Success Metric | Definition | Importance |
| Signup Form Completion Rate | Number of visitors who visit the signup form page and complete it | Primary |
| Total Site Lead Conversion Rate | Total number of leads total site visitors × 100 | Primary |
| More Info Request Rate | Average number of visitors requesting more information (e.g., white papers, demos, guides, etc.) total visits × 100 | Primary |
| Average Number of Leads Per Day | The average number of leads generated on your site per day | Secondary |
| Average Number of Visits until Lead Generated | The average number of visits it takes someone to sign up to your lead generation form | Secondary |
Service Website Success Metrics
These types of websites are similar to an e-commerce website, but they focus on selling services instead of products and have different success metrics. Examples include Monster.com and ConstantContact.com.
| Success Metric | Definition | Importance |
| Service Signup Flow Completion Rate | Percentage of users who start and complete your service order flow pages | Primary |
| Exit Rate for Your Service Signup Page | Visitors who leave your signup page without starting the signup process (exits visits × 100) | Primary |
| Total Site Service Signup Conversion Rate | Total number of signups total site visitors × 100 | Primary |
| More Info Request Rate | Average number of visitors requesting more information (e.g., white papers, demos, guides, etc.) total visits × 100 | Primary |
| Service Demo Video Interaction | Average number of visitors who complete watching your service demo video total visits × 100 | Secondary |
| Average Number of Signups Per Day | The average number of signups on your site per day | Secondary |
| Average Number of Visits until Service Ordered | The average number of visits it takes someone to sign up to purchase your service | Secondary |
| Self-Service Support Completion Rate | The number of visitors who visit and successfully use the self-service FAQ and online help section. | Secondary |
Media and Brand Website Success Metrics
These types of websites usually rely on advertising for revenue and often do not have any major success metrics; instead, they have many secondary success metrics that all combine to determine overall website success. Many of these success metrics are related to improving visitor engagement. Examples include Coke.com and ESPN.com.
| Success Metric | Definition | Importance |
| Page Views Per Visit for Site or Site Sections | The average number of pages seen per visitor each time they visit | Secondary |
| Average Time Spent | The average time a visitor spends on your website | Secondary |
| Newsletter or RSS Feed Signup Rate | Newsletter or RSS signups total site visitors × 100 | Secondary |
| Average Ad Revenue Per Page | The average amount of advertising revenue generated per page | Secondary |
| Average Ad Revenue Per Visitor | The average amount of advertising revenue generated per visitor | Secondary |
| Subscription Signup Rate | Total number of subscribers total site visitors × 100 (this could be for a magazine or premium content) | Secondary |
| Average Time Spent Watching Video | The average time that visitors spend watching videos on your website (good sign of engagement) | Secondary |
| Average Number of Comments Per Item | The average number of comments per article, photo, or video on your website (good sign of engagement) | Secondary |
| Average Usage of Refer-a-Friend and Social Tools | The average number of usages of refer-a-friend and social tools like Facebook and Twitter | Secondary |
Community and Social Networking Website Success Metrics
These types of websites are ones that are heavily reliant on member signup and engagement (for example, LinkedIn.com and Facebook.com).
| Success Metric | Definition | Importance |
| Average Number of New Registered Users Per Day | The number of new registered users per day on your website | Primary |
| Registration Form Completion Rate | Number of visitors who visit the registration form page and complete it (completions visits × 100) | Primary |
| Page Views Per Visit | The average number of pages seen per visitor each time they visit | Secondary |
| Average Time Spent | The average time a visitor spends on your website | Secondary |
| Average Number of Site Contributions Per User | The average number of contributions a visitor makes on your website (like comment or rate something) | Secondary |
| Average Usage of Refer-a-Friend and Social Tools | The average number of usages of refer-a-friend and social tools like Facebook and Twitter | Secondary |
Blog Website Success Metrics
These types of websites usually rely on advertising for revenue and often do not have any major success metrics; instead, they have many secondary success metrics that all combine to determine overall website success. Examples of these are TechCrunch.com and ProBlogger.com.
| Success Metric | Definition | Importance |
| Page Views Per Visit | The average number of pages seen per visitor each time they visit | Secondary |
| Average Time Spent | The average time a visitor spends on your website | Secondary |
| Newsletter or RSS Feed Signup Rate | Newsletter or RSS signups total site visitors × 100 | Secondary |
| Average Ad Revenue Per Page | The average amount of advertising revenue generated per page | Secondary |
| Average Ad Revenue Per Visitor | The average amount of advertising revenue generated per visitor | Secondary |
| Average Number of Comments Per Article | The average number of comments per article, photo or video on your website (good sign of engagement) | Secondary |
| Average Usage of Refer-a-Friend and Social Tools | The average number of usages of refer-a-friend and social tools like Facebook and Twitter | Secondary |
Additional Success Metrics to Monitor for Any Kind of Website
There are also several other good success metrics that you can use for any type of website. Here is a list of some that you can use:
- Bounce rate of your homepage (more on this in a later week)
- Task completion rate (more on this later in a later week)
- Exit rate of your top entry pages (more on this in a later week)
- Repeat visit rate (as discussed earlier this week)
- Lifetime value of visitors and conversions (for information on how to calculate this complex value, visit http://blog.kissmetrics.com/how-to-calculate-lifetime-value)
Friday: Set Targets for Your Success Metrics
After you have determined the success metrics for your type of website and benchmarked their current levels, you need to set targets for each of them. Realistic improvements of these should definitely be achievable after you have implemented the website optimization best practices and tests in this book.
However, you are probably looking for some guidance in what your conversion rate and success metrics should ideally be, and this is a common question in the website optimization world. Unfortunately, you won’t find that in this book for one major reason.
This is because there is no “perfect” conversion rate or “perfect” number for your success metrics. These can vary hugely, not only by the type of website, but sometimes even for websites of the same type. It all depends on your website’s business model and value proposition. For example, two websites may sell the same products, but one may place more value on getting registered users and marketing to them while the other may offer free shipping. Both of these value propositions can influence conversion rates and success metrics very differently.
And you shouldn’t pay attention to or worry about what you read on optimization and analytics blogs that say you should have X percent or Y percent high conversion rate or specific success metric results. Such sweeping statements about what these should be are way too subjective and simplistic, and they can get you in trouble by influencing you to set unrealistic and unobtainable goals.
Instead, as mentioned earlier for other basic conversion metrics, the most important thing to focus on is to improve upon your current success metrics. Ideally, you should try and beat them by at least 10–20 percent, which should definitely be achievable after implementing and testing many of the best practices in this book. It’s also very important to continually improve your conversion rates and success metrics even if you beat these initial targets. Another important thing to emphasize is that you should reward yourself and others involved for helping to achieve your success metric targets (and overall conversion rate targets). Even a simple gift certificate given to people who contributed to hitting targets can go a long way to building a better testing culture at your organization, which is a topic that will be discussed in more detail in week 4.
Week 3: Learn the Importance of and Set Up a Website Testing Tool
The next thing you need to do is to set up a website testing tool, because this is going to be one the most important tools to help you improve your website’s conversion rates and success metrics. A testing tool will enable you to experiment with elements on your website and see what resonates with your visitors and converts them to your goals the most effectively. Without a testing tool, it will be hard to run effective, measurable tests on your website, and it will take you much longer to improve your conversion rates.
Monday: Understand the Importance of Having a Testing Tool
Today you will learn why it’s so important to have a website testing tool in order to be successful with your optimization efforts.
Prior to the popularity of website testing tools, companies often did testing in an unofficial manner with no official tool. This was often done purely by just running one website version for a set period of time followed by running another version for another set period of time and then comparing the difference.
Unfortunately many website companies still do this and don’t understand the many disadvantages of testing not using an official website testing tool. You will now learn the reasons why it’s so important to use one.
First, there are several technical challenges if you try and test with no tool. For example, it is much harder to serve up the different versions of test content over the same time period without technical challenges or inconsistent visitor experiences. This gets significantly harder to do as soon as you start trying to segment and target your visitors with different content, which as you will learn about in Chapter 3, is an essential part of any successful optimization program. And if you just simply test two different variations one after the other, you will run into issues of potentially different sources and quality of traffic during those different test periods, affecting conversion rates and your ability to analyze the test effectively.
Second, without a testing tool it is very hard to run analysis on test results to discover a statistically significant winner, and determine the conversion lift over the default and other test versions. Without this statistical analysis of test version performance, often suboptimal winning tests get pushed live, and worse still can have a negative impact on conversion rates and the visitor experience. This functionality is built into all testing tools and enables you to make better and more accurate analysis of your test results and optimization efforts.
And last, without using a testing tool it is often going to be much riskier and costlier when developing and launching website changes, just in case it doesn’t work as well as expected. Instead of doing this and hoping that the changes work well, testing using a tool helps mitigate these costs and risks. This is because using a testing tool gives you much more control over only testing specific elements of pages, lowering the percentage of traffic that you test, and makes it much easier and quicker to turn off a test if it is not doing very well.
Tuesday: Familiarize Yourself with the Available Website Testing Tools
With the recent rise in understanding the importance of website testing, there’s been a huge growth in the number and diversity of website testing tools that are available, each with different costs and different benefits. This is great for online marketers and analysts who were previously stuck with only a few basic website testing tools, or had to rely on an in-house built tool.
There are three types of testing tools that you will now learn about, including the advantages and disadvantages of each.
Free Basic Testing Tools
Free testing tools have very limited functionality and very little support and consulting but are often very simple to use, so they are ideal for a company that is beginning down the website testing and optimization path. Currently there is only one major free website testing tool, Google Website Optimizer.
Mid-level Testing Tools
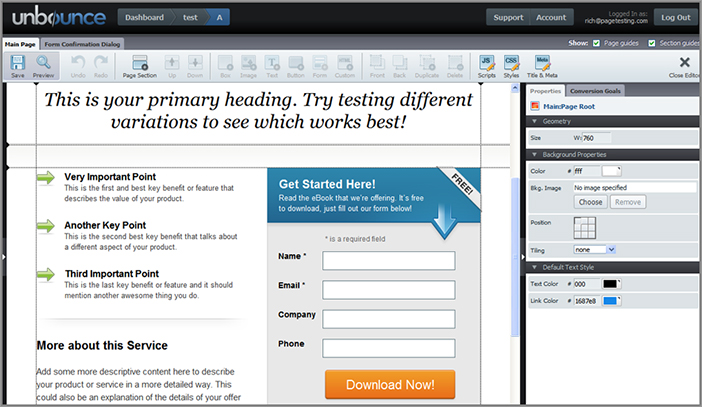
These mid-grade testing tools are perfect for an online business that wants expanded features of its testing tool, without considerable expense. Most of the tools are aimed at marketing executives who value the ability to simply and visually create tests.
Figure 2-6: Screenshot of Visual Website Optimizer
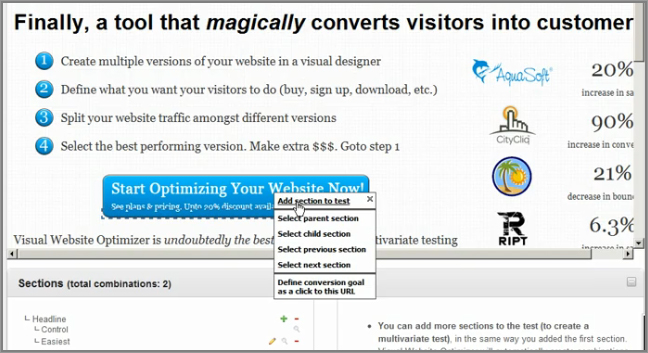
Figure 2-7: Screenshot of Unbounce
Enterprise Testing Tools
These testing tools offer advanced functionality and flexibility as well as full support and consulting to help with test implementation and test strategy. However, because of these advanced features, these tools can often be very expensive and many companies will need to build a case for needing these tools (more on this subject in Chapter 3).
Wednesday: Determine a Budget and Understand Possible Technical Barriers for Tool Selection
Today you are going to learn about two essential things that you need to do before you actually choose a website testing tool. First, you need to try and determine a testing budget so you know which of the testing tools you can afford, and then you need to understand potential technical issues and barriers that may influence your tool selection.
Build a Case for a Good Testing Tool Budget
The more testing budget you can obtain, the better testing tool you can start using, and the better results you will get from your testing and optimization efforts.
You will often need to build a case to senior management to obtain a higher amount of testing budget, and the best way to do this is to create a short presentation to review with them. In order to make this presentation most effective, it should highlight the anticipated return on investment from using the testing tool in the first year, the potential higher conversion rates, and most importantly for these senior level staff, the associated increase in revenue from these improved conversion rates (even presuming a basic 2-percent lift will usually get some great increases in revenue).
Your presentation should also highlight potential pages for testing on your website, particularly ones associated with key conversion flows such as your shopping cart or signup pages. Including screenshots of page issues and reports showing pages with high bounce rates will help too. Ideally though, you should wait until you read this whole book and gather test ideas from it to put in your presentation.
If you have trouble convincing senior management of this in your first attempt, then you could try getting help from an external consultant to analyze your website for potential tests and bring them in to make a presentation. Senior management are quite often more likely to trust and believe an expert from a testing and optimization company as opposed to someone within the company who has a vested interest in this project.
Another strong case that you should make is to start with at least a mid-level testing tool. This is because even though Google Website Optimizer is great and free, you will soon outgrow that tool’s limited functionality, which means you will have to implement and learn another tool, which can be costly.
Last, it’s important to remember to allocate at least 50 percent of your testing budget toward obtaining testing personnel. Without trained power users who know how to make best use of the tool and what to test, you will be wasting money on the advanced functionality of enterprise level tools, because you won’t know how to use them effectively.
Understand Technical Barriers for Tool Selection
Other than determining a good budget for your web analytics tool, the most important thing to consider is the potential technical barriers when trying to use your testing tool. This is because one of the biggest obstacles to an effective testing program is an internal one, and this is your information technology (IT) department. They often have the power to quash any plans that involve making extensive frequent changes to your website, which of course is needed for any long-term testing plan.
The best way to help reduce the potential negative impact of an uncooperative IT department is to involve them early on in your plan for testing, particularly when choosing and implementing a testing tool.
First, you should share with them the presentation that you gave to senior management, so they can understand the reasons why you are trying to run tests. You should then find someone in the IT department to help you evangelize your testing efforts to senior IT members; ideally someone who is well respected in that department and fairly senior.
Next, you need to work with them to understand how much effort is needed to technically deploy the testing tool programming code that is necessary to begin testing on your website. As previously mentioned, the technical requirements can vary between the tools, and some are easier to work with than others.
Another thing you should work on with your IT team is picking a testing tool that can integrate well with your website platform and CMS (content management system).
Technical Warning Signs and Barriers to Overcome
There are also numerous internal technical and IT warning signs that you need to address early. If left unresolved, these issues can severely hinder your ability to test quickly and effectively and may even hamper your ability to implement a testing tool and make it work.
- Long website release cycles that will prevent you from adding new code for test elements on pages in a frequent manner. Ideally, you should have at least a couple of website release versions per month, not a couple per year.
- Old legacy website and CRM platforms that are hard to integrate testing code into. I suggest you make a case for upgrading the platform, or try testing on pages that are not housed on old platforms (such as paid search landing pages that can be hosted on separate platforms).
- Areas of the website that IT claims are technically off-limits for testing. The IT department often has sacred grounds on the website where they don’t let anyone test, and these should be overcome early on. Gaining buy-in and advocates from the IT department is a great way to try and overcome this.
Once you have armed yourself with the information and help you need to decide on a testing tool, pull the trigger and start the service with your chosen tool. Tomorrow, you’re going to implement your tool and set up a test campaign.
Thursday: Implement Your Testing Tool, Setup, and QA Test Campaigns
The next thing you need to do is to actually work with your tech department to implement your testing tool and make sure it is set up correctly and working as expected. If you have chosen a more expensive and robust tool, you will also need to get consultant assistance from the testing tool vendor to help you set up the tool and first campaigns. As discussed yesterday, you may have to try and overcome some challenges when trying to add the code to your website.
The first thing you usually need to do is to log on to your testing tool and set up a dummy test campaign that involves changing something very simple, such as an image or some text. Don’t forget to give your test a good name that describes your test, because a good naming convention is important when reviewing current and historical tests.
Most website testing tools have a fairly good intuitive user interface that actually steps you through this test creation process, including helping you specify the variations of the page elements that you want to test.
Once you have created this first test in the tool, the tool will usually inform you of the JavaScript code that you need to place on your website in order to run the test. This usually involves placing at least three different pieces of code on your web pages. The first is a small JavaScript snippet that references an external file for your overall test settings and acts as the main controller of the test. This code usually goes in the head section of your website pages. You can think of this code as a traffic cop who decides which traffic participates in the test and which doesn’t, depending on whether it meets the test’s requirements and rules or not.
The second type of code that you need to install are scripts that determine which elements of your web page content you want to test, such as headlines, buttons, or images. For example, in Google Website Optimizer, these code elements are called sections, and in Adobe Test&Target, they are called mBoxes.
The third and last code script that you need to add to your website is the conversion script on your web page that defines success for your test (for example, a “thank you for registering” page). This conversion script triggers whenever someone participating in the test sees this conversion goal page and is essential for determining which tests are performing the best. Therefore, it is critical that you add this last part of test code to your website.
Next you need to perform QA (quality assurance) on your dummy test campaign to see whether it is working as expected and not breaking anything. Performing this QA can be quite a long and laborious task, so you should get help from your IT department to do this.
QA efforts should include checking the test on all the major browsers (currently Internet Explorer, Firefox, and Chrome) as well as on mobile platforms.
You will also need to make your testing tool work on a QA server because this enables you to test and check your tests without the risk of your visitors seeing any issues that might arise. One of the more common issues to look for is called flicker, which is when a page loads first, and then the content changes seconds later to show the alternate test version.
Friday: Understand Web Testing Tool Terminology, Concepts, and Reports
After you have selected your tool and have it up and running successfully, there are some key terms, concepts, and reports that you will need to understand before embarking on your testing and optimization journey.
The Difference between A/B Testing and Multivariate Testing
The two most common website tests are A/B tests and multivariate tests. It is important that you understand the differences between these tests, their advantages and disadvantages, and when to use each type of test. The core difference between these testing approaches is that multivariate tests allow you to test multiple elements simultaneously with much greater ease and speed than using an A/B test.
A/B Testing
A/B tests are the simplest type of website test and are usually the easiest to set up. As a result of this, many people new to website testing will learn and use these first. This basic form of testing can be run in any testing tool, regardless of the level of the tool.
Here are the pros and cons of using A/B tests for your optimization efforts:
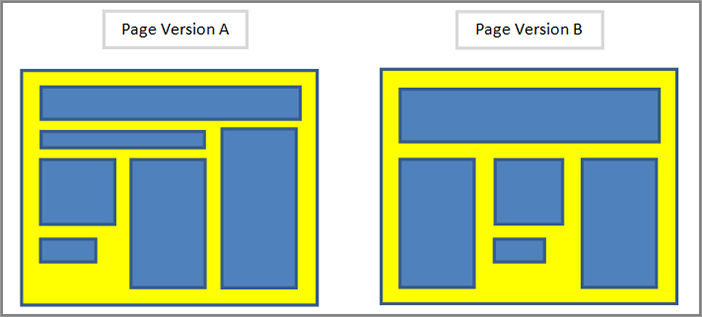
Most online marketers start off using this more basic form of testing before evolving into needing more complex testing types like multivariate tests (which are described next). Figure 2-8 shows an example of two different styles of pages being tested against each other in an A/B test, with different layouts of modules, banners, and images.
Figure 2-8: Example of two different A/B test pages
Multivariate Testing
Multivariate tests (MVT) are designed to allow you to test many page elements simultaneously with greater speed and ease.
To help you test potentially hundreds of different combinations of elements for multivariate tests more quickly, most testing tools use the Taguchi statistical method (also known as fractional factorial testing) to come up with a representative sample of test content combinations, rather than having to test each combination.
Some tools like Google Website Optimizer actually test all the different combinations of elements simultaneously (called full factorial testing), but this takes significantly higher amounts of traffic and longer periods to get significant test results. Some tools actually give you the option to test using both of these types of multivariate methodology.
Here are the pros and cons of using MVT for your optimization efforts:
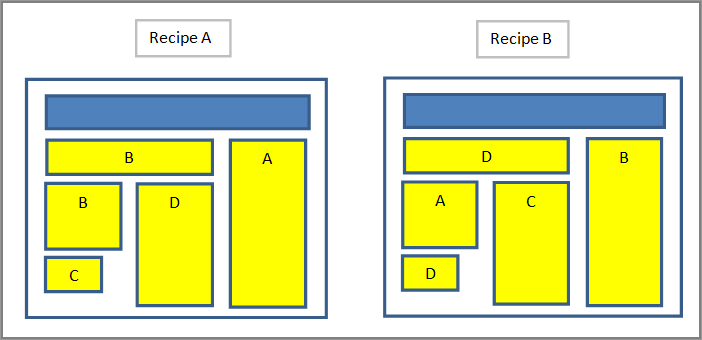
Figure 2-9 shows two different recipes of page elements (annotated with different letter versions for each module) on one page that can be tested simultaneously in a multivariate test to find the best-performing combination of elements.
Figure 2-9: Examples of multivariate test recipes for one page
The Control or Default Content and Challenger Versions
Everything that you test on your website needs to be tested against what is currently being shown on your website. This original version of your content is called the control or default content, and this is pitted and tested against a challenger content variation of it to see which performs better for conversion. For example, if you are testing a signup button on your website, the version that is currently on your website is the control version, and the versions that you want to test against it are the challenger versions.
Page Sections, Offers, mBoxes, and Similar Test Elements
These are the names for the actual elements and sections of your website that get tested. In your website testing tool, you create names for each of the elements on your page that you want to test—for example, a product image, a submit button, or a headline.
When setting up the names of these test elements on your pages, it’s important that you use good naming conventions. This makes it much easier to analyze a test, particularly one that has many elements being tested at once (such as a complex multivariate test). It also helps you understand what was tested previously when you’re looking back at historical tests.
A good naming convention to use for a test element would be PageName_ElementName, or SiteName_PageName_ElementName if you are testing multiple websites simultaneously. Using underscores between words as shown here helps make the names easier to read.
Here are a few examples of good naming conventions:
Recipe or Experience
These testing terms are found in multivariate tests, and both basically mean the same thing. Each recipe or experience contains different variations of each of the elements you are testing, and your multivariate test will contain several of these (depending on how many elements and variations you are testing)
When you set up a multivariate test using the Taguchi method, the tool automatically creates a representative set of recipes (or experiences) and tells you which element variations you need to place in each recipe. Here is an example of two recipes:
Depending on how many elements you are testing per page, and how many variations of each element you are testing, this will result in a different number of recipes (or experiences) that the tool has to automatically create for testing. In Chapter 3 you will learn more about best practices for creating recipes that will get you results quicker.
Test Results Reporting Terms
To help you understand your website test results, this section defines a few of the most common terms and how to interpret them.
Conversion Lift or Observed Improvement
This is one of the key things you need to understand when analyzing the performance of your tests. The term conversion lift is usually found in most test results reports and is an indicator of which test versions (or recipes) gained lift over the original version you are testing against. In Google Website Optimizer, this is referred to as observed improvement.
This conversion lift is usually displayed in the form of a percentage to indicate the strength of the conversion lift over the original (or default) content.
In advanced testing tools, you can configure which success metric this conversion lift is based on. For example you can change it from “products ordered” to “average order value,” and you will often get different results depending on what success metric you are using to define conversion lift.
You will learn how to interpret conversion lift results in much more detail in Chapter 3.
Confidence
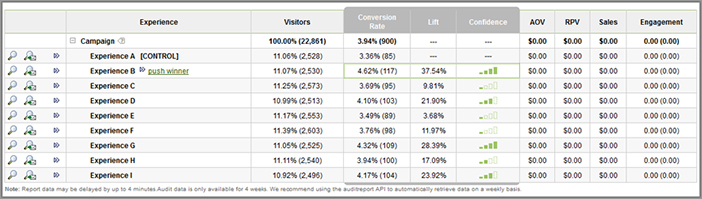
Another key term you need to understand in your test results reports is confidence. As each test version (or recipe) gathers visits and conversions on your website, the tool begins to determine whether enough statistical significance data has been gathered to make the data valid; in other words, whether there is enough confidence that the result is valid. This is important because some test versions may get high conversion lift, but not enough supporting data has come through yet to determine statistical significance, and therefore, the confidence level regarding the accuracy of the test result is low.
This confidence level is visually shown in different ways depending on what testing tool you use. Usually, it is shown on a report as a color graphic (such as a bar chart), with green indicating confidence and red (or no color) indicating no confidence.
Ideally, you want to pick a winner that has high confidence (80 percent confidence in the least); otherwise, you may end up pushing something live that will actually lower your conversion rates in the long run. Figure 2-10 illustrates how confidence is shown in the Adobe Test&Target testing tool.
Figure 2-10: Confidence column in Test&Target
Element Contribution or Relevance Rating Reports
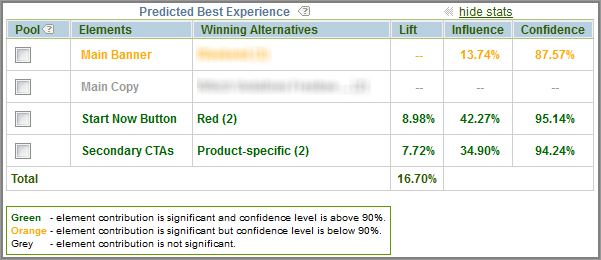
This is a common report for multivariate tests that you should look at to understand which elements of your test most impacted conversion rates. The Element Contribution or Relevance Rating Report helps in that it shows you all of the test elements broken down separately, thus enabling you to see which of your test elements had the greatest single impact on conversion rates. It also shows the confidence level of the influence for each element. Figure 2-11 shows an example of this element contribution report in Test&Target, which highlights the “predicted best experience” for each element being tested.
Figure 2-11: Element Contribution Report in Test&Target
The main use of this report is to understand which of the page elements in your multivariate test would be good candidates for further testing to improve your conversion rates even further (iteration-based testing). You will learn more about this and all best practices for testing in Chapter 3.