Suggested Reading
• Alford, A: The Effects of the set of comparable firms on the accuracy of the price earnings valuation method. Journal of Accounting Research 30, 1993.
• Ansoff, H: Corporate Strategy, McGraw-Hill, 1965.
• Anuff, Joey and Gary Wolf: Dumb Monday: Adventures of a Day Trader. New York: Random House, 2000.
• Armen, A and Allan, WR: University Economics, 3rd ed., Wadsworth Publishing Company, 1972.
• Associated Press: World Currencies Roiled by China Currency Talk. People’s Daily Newspaper, May 11, 2005.
• Basso, Thomas: Panic-Proof Investing. John Wiley & Sons Inc, 1994.
• Bergen, K: New Opportunities, but Dangers Still Lurk for Many Investors. Chicago Tribune, 1999.
• Brett, M: How to Read the Financial Pages. Random House Business Books, 2003.
• Brigham, E: Essentials of Management Finance, 3rd ed., Chicago Dryden Press, 1983.
• Britzuis, O: South African Company Practice, Juta & Co, 1988.
• Browne, Andrew: How a News Story, Translated Badly, Caused Trading Panic. The Wall Street Journal, May 12, 2005, p. A1.
• Buckman, R: These Days, Online Trading Can Become An Addiction. The Wall Street Journal, 1999.
• Cambridge University Economic department: Ricardo, D—Principles of Political Economy and Taxation, Cambridge University Press, 1962.
• Carter, John: Mastering the Trade. McGraw-Hill, 2005.
• Chicago Economic department: FA Hayek, Capitalism and the Historians, University of Chicago Press, 1954.
• Chicago Economic department: Ludwig von Mises, Human Action, 3d ed., Henry Regnery Co, 1966.
• Conway, M and Behle, A: Professional Stock Trading: System Design and Automation, Acme Trader LLC, 2003
• Costello, M: Day-Trading Gurus Tell All. CNNFN -The Financial Network, 1998.
• Douglas, M: Disciplined Trader—Developing Winning Attitudes, New York Institute of Finance, 1997.
• Elder, A: Trading for a Living—Psychology, Trading Tactics, Money Management, John Wiley & Sons, 1993.
• Emshwiller, J: Inside the Wild & Wooly World of Internet Stock Trading. HarperBusiness, 2000.
• Ernst & Whinney: Preparing a Business Plan: A Guide for the Emerging Company, Ernst & Whinney, 1982.
• Farley, A: The Master Swing Trader, MacGraw Hill, 2000
• Farrell, Christopher A: Day Trade Online. John Wiley & Sons Inc, 2001.
• Gordon, M: Day-Trader Misled. The Detroit News, 1999.
• Gough, L: How the stock market really works, Prentice Hall, 1997.
• Hamilton, W: The Day-Trading Craze: Whose Crisis is This? Los Angeles Times, 1999.
• Helmkamp, John: Principles of Accounting, John Wiley & Sons,1982.
• Hyuga, Takahiko: UBS to Return Money from Tokyo Trading Error. Bloomberg News, International Herald Tribune, Thursday, December 15, 2005.
• IMF Research Department: World Economic Outlook, IMF, 2010.
• JSE Ltd’s South Africa Listing Requirements, Butterworths, 2002.
• Jurik, M: Computerized Trading: Maximizing Day Trading and Overnight Profits. USA: Penguin, 1999.
• Kahn, Michael: Technical Analysis Plain and Simple: Charting the Markets in Your Language. 2nd Edition. Financial Times Prentice Hall, 2006.
• Lefèvre, E: Reminiscences of a Stock Operator, John Wiley & Sons, 1994.
• Leland Bach, G: Economics, 6th ed., Prentice-Hall, Inc., 1968).
• Link, M: High Probability trading, MacGraw Hill, 2003.
• Macfie, D: Measuring share performance, Pitman Publishing, 1994.
• Magliolo, J: Become Your Own Stockbroker. Zebra Press, 2005.
• Magliolo, J: The Millionaire Portfolio. Struik Zebra Press, 2002.
• McGregors: Privatisation in South Africa, Juta & Co, 1987.
• Millman, Gregory J: The Day Traders: The Untold Story of the Extreme Investors and How They Changed Wall Street Forever. New York: Times Business, 1999.
• Moffett, Sebastian: Japanese Economic Growth May Not Translate to Stocks. The Wall Street Journal, January 6, 2006, p. C14.
• MoneyWeek: “What Was Your Worst Day at Work? Not as Bad as This...” December 9, 2005.
• Orley, MA, Jr: A Pedestrian’s Guide to Economics. Oklahoma State University Press, 1994.
• Owen F: Understanding Exchange Rates. Federal Reserve Bank of Cleveland, 1998.
• Peters E: Chaos and Order in the Capital Markets. John Wiley & Sons, 1992.
• Peters E: Fractal Market Analysis, John Wiley & Sons, 1994.
• Reilly, F & Brown K: Investment Analysis & Portfolio management, Harcourt, 2000.
• Reisman, G: Capitalism—A Treatise On Economics, Jameson Books, 1996.
• Richardson, P: Globalisation and Linkages: Macro-Structural Challenges and Opportunities. OECD Economic Studies, 1997.
• Robinson, G: Strategic Management Techniques. Butterworths, Canada, 1986.
• Samuelson, Paul: Is Real-World Price a Tale Told by the Idiot of Chance? Review of Economics and Statistics, 58(1), 1976, pp. 120–23.
• Schwager, Jack: Market Wizards: Interviews with Top Traders. HarperCollins Publishers, 1990.
• Section 21: Alternative Exchange Listing Requirements, AltX, 2003.
• Sexton, D & Kasarda, J: The State of the Art of Entrepreneurship, KWS-Kent, 1992.
• Silver, David: A Venture Capital: The Complete Guide for Investors. John Wiley & Sons 1985.
• Sraffa, P: The Works and Correspondence of David Ricardo, Cambridge University Press, 1962.
• Stuart Mill, J: Principles of Political Economy, Fairfield, 1976.
• The Tokyo Stock Exchange: Japan Securities Clearing Corporation. Settlement of Shares of J-Com Co., Ltd. December 12, 2005.
• The Tokyo Stock Exchange: Summary of Report on Service Improvements and Report on the Overall System Inspection. January 31, 2006.
• Touche Ross: A Guide to Business Growth, Touche Ross & Co, 1986.
• Weiss, J: A Framework for Strategic Planning to Support Strategic Management. Chase Manhattan Bank, 1980.
Area |
Ratios |
Calculation of Ratio |
Solvency |
General solvency check |
[(Fixed assets + investments + current assets) ÷ (Long-term loans + Current liabilities)] × 100 |
Liquidity |
Current asset ratio |
Current assets ÷ Current liabilities |
Quick ratio (Acid test) |
(Current assets − Stock) ÷ Current liabilities |
|
Stock to working capital ratio |
(Stock ÷ Net current assets) × 100 |
|
Defensive interval ratio |
Defensive assets ÷ Projected daily operating expenses |
|
Profitability |
Profit margins |
(Any profit figure ÷ Turnover) × 100 |
Return on shareholders’ equity |
(Attributable profits ÷ Shareholders’ funds) × 100 |
|
Return on net assets |
(Attributable profits ÷ Net assets) × 100 |
|
Return on capital employed |
(Operating income ÷ Capital employed) × 100 |
|
Efficiency |
Stock turn |
Group turnover ÷ Average stock |
Accounts receivable days |
Accounts receivable ÷ (Turnover ÷ 365) |
|
Accounts payable days |
Accounts payable ÷ (Turnover ÷ 365) |
|
Leverage |
Debt:Equity (Gearing) |
[(long- and short-term loans + Overdraft − Cash) ÷ Ordinary shareholders’ funds] × 100 |
Proportional debt ratio |
Long-term loans ÷ Total assets |
|
Ordinary shareholders’ interest |
(Ordinary shareholders’ funds ÷ Loans) × 100 |
|
Long-term debt to capital employed |
(Long-term loans ÷ Capital employed) × 100 |
|
Interest cover |
Pre-tax income ÷ Interest paid |
|
Average interest rate |
(Interest expense − Accounts payable) ÷ Liabilities |
|
Gross cash flow to total debt ratio |
[Gross cash flow (Prior dividends) ÷ Loan] × 100 |
|
Cash flow to assets |
Cash from Operations ÷ Total assets |
|
Investment performance ratios |
Earnings per share |
(Attributable profit ÷ Issued ords) × 100 |
Dividend per share |
(Dividends payable ÷ Issued ords) × 100 |
|
Dividend cover |
Earnings per share ÷ Dividend per share |
|
Earnings yield |
(Earnings per share ÷ Share price) × 100 |
|
Dividend yield |
(Dividend per share ÷ Share price) × 100 |
|
Yearly dividend per share ÷ EPS |
||
Price:Earnings ratio |
Inverse of earnings yield |
|
Price earnings growth (PEG) |
Price:Earnings ÷ Company’s projected year-over-year earnings growth rate |
|
Book value per share |
(Shareholders’ equity − Preferred stock) ÷ Average outstanding shares |
|
Debt/Asset ratio |
Total liabilities ÷ Total assets |
Explanation of Porter’s Five Forces Analysis
Porter’s five forces model is used to analyze a particular environment of an industry, with the focus on:
• Competitive rivalry
• Power of suppliers
• Power of buyers
• Threats of substitutes
• Threat of new entrants.
The above factors are variables that influence a company within the industry in which it operates.
Explanation of PESTEL Analysis
PESTEL analysis stands for Political, Economic, Social, and Technological analysis and focuses on macro-environmental factors that affect a business, as follows:
• Political and labor factors that influence economic development.
• Economic factors, such as monitory and fiscal policies have major influence on how businesses operate and entrepreneurs’ strategic decision-making processes.
• Social factors and trends affect the demand for a company’s products and how that company operates.
• Technological factors include R&D activity, automation, technology incentives, and the rate of technological change.
• Environmental factors include ecological and environmental aspects such as weather, climate, and climate change, which may especially affect industries such as tourism, farming, and insurance.
• Legal factors include discrimination, consumer, antitrust, employment, and health and safety laws. These factors can affect how a company operates, its costs, and the demand for its products.
IPO Valuation Methodology
The valuation process takes the following two-stage approach:
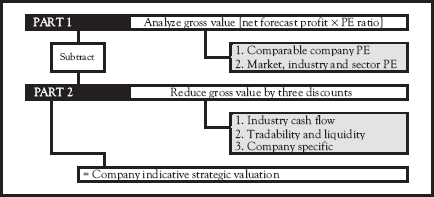
Stage One: Determining Gross Value
This stage determines which price earnings ratio to use, based on industry norms and comparable listed companies. Analysis of price earnings ratios includes:
• Industry norms:
![]() Overall index, which reflects the overall state of the market within which the company to be listed operates.
Overall index, which reflects the overall state of the market within which the company to be listed operates.
![]() The industrial index, which reflects the industrial component of the market.
The industrial index, which reflects the industrial component of the market.
![]() The small cap index, which reflects how smaller SMEs are doing as listed companies.
The small cap index, which reflects how smaller SMEs are doing as listed companies.
![]() Assessment of the PEER-listed companies.
Assessment of the PEER-listed companies.
![]() Outline of industry discount rate: listed vs. unlisted companies.
Outline of industry discount rate: listed vs. unlisted companies.
The final assessment (as to which price earnings ratio to use) is based on industry research and appraisal, which includes:
• Regional analysis of the market.
• Followed by an assessment of the IPO; financials and market potential.
Stage Two: Discounts
Once a comparable gross value is determined, it is then discounted in three phases; as follows:
• Industry cash flow. This is an industry assessment.
• Tradability/liquidity discounts (listed to unlisted).
• Specific company-related discount issues.
• Data and methodology. This assessment and valuation draws from a wide variety of small and medium sector data that could be accessed. These include information from available statistics databases, reserve or federal banks, trade and industrial policy strategies dataset, and enterprise surveys.
Business Consultants International (BCI)—A Cape Town-based corporate research and finance house—also makes use of case studies and mini-surveys relating to the IPO and related industries. It should be noted that this valuation stresses that there are difficulties in accessing small and medium enterprise sector data.
With regards to the methodology, standard survey data analysis techniques are applied. These include descriptive analysis of the data and correlation techniques.
As such company profile, corporate events and environmental influences (politics, economics, business, and technology) are taken into account to determine factors that could negatively or positively influence a share-price valuation of the IPO.
The aim is to establish a fair and realistic value that is based on market, sector, and company specific research. The intention is to assess the company relative to comparable exchange-listed companies. This is only the start and this gross value needs to be discounted to include risk-free rates, liquidity, tradability, and director or owner (company specific) issues.
Part 1: Finding a Fair and Realistic Price Earnings
• Step 1: BCI assesses all listed companies’ price earnings. The aim is to find the one that is the most comparable to the company being valued. Price earnings are determined by comparing companies of similar size, track record, growth prospects, and risk profile.
• Step 2: Step 1 is followed by an assessment of all share, industrial, and sector indices. These provide a solid indication of whether the relative company is too high, too low, or fair.
• Step 3: The final stage is to choose the minimum and maximum price earnings. This will calculate the gross value.
Part 2: Discounting Gross Value
Calculated as follows:
Discount 1: Industry cash flow

In many instances, IPOs do not have steady historic cash flows; not enough or, at least, not established. To make matters worse, many SMEs do not have enough statistics to conduct a thorough discounted cash flow analysis and valuation. Without such statistics, it is not realistic to use discounted cash flow methods as an indicator for conducting valuation.
However, if an indicative gross value is used, this can be discounted by an industry cash flow. The aim is to find an indicative value as most of these companies do not have substantial assets—not enough to produce a value.
Discount 2: Liquidity and tradability
The next step is to take account of the desire or potential desire of staff, colleagues, directors, and the public in general to acquire shares in the IPO. Experience in international negotiations suggests that this discount can range between 25 and 40 percent, depending on issues outlined in the following text. BCI uses the worst-case scenario and a 40-percent discount is used.

Discount 3: Company specific
The final discount accounts for the strength and weaknesses of the directors and owners of a company. However, once the company has been sold (as a whole or in part) or listed, the influence of the previous owners fades. The discount is thus small, between 7 and 10 percent.
Summary: Valuing an IPO is not a precise science and can vary depending on the type of business and the reason for coming up with a valuation. There are a wide range of factors that go into the process—from the book value to a host of tangible and intangible elements. In general, the value of the business will rely on an analysis of the company’s cash flow. In other words, its ability to generate consistent profits will ultimately determine its worth in the marketplace.
Business valuation should be considered a starting point for buyers and sellers.
The economy of the United States is the largest in the world. At $18 trillion, it represents 25 percent of the global economy (24.3 percent), according to the latest World Bank figures.
• US = 24.3 percent
• China = 14.8 percent
• Japan = 5.9 percent
• Germany = 4.5 percent
• UK = 3.9 percent
• France = 3.3 percent
• India = 2.8 percent
• Italy = 2.5 percent
• Brazil = 2.4 percent
• Canada = 2.1 percent
China follows, with $11 trillion, or 14.8 percent of the world economy. Japan is at third place with an economy of $4.4 trillion, which represents almost 6 percent of the world economy. European countries take the next three places on the list: Germany at fourth position, with a $3.3 trillion economy; the UK at fifth with $2.9 trillion; and France at sixth with $2.4 trillion.
India is at seventh place with $2 trillion, and Italy at eighth with an economy of over $1.8 trillion.
Ninth place goes to Brazil, with an almost $1.8 trillion economy. And at tenth is Canada, with an economy of over $1.5 trillion.
Many experts suggest openly that the United States will not dominate world economies in the next decade. China’s economy grew by 6.7 percent in 2016, compared with America’s 1.6 percent, according to the IMF and consequently is catching up.
Test 1: Are You a Trader?
How the following answers apply to you
A: The statement never applies to you. |
B: The statement rarely applies to you. |
C: The statement sometimes applies to you. |
D: The statement often applies to you. |
E: The statement always applies to you. |
Add your score and review your profile.
Score |
Indicates |
+80 |
• Score indicates that ideas of trading may be inconsistent with the daily stresses of trading. • R eevaluate ideas about trading through a process of systematic elimination of all negative misconceptions about trading. |
60 to 80 |
• Score indicates a longer-term business outlook for trading. • In fact, if you choose to trade, perhaps you should consider developing a style suited toward duration trades of 3 to 8 weeks. |
40 to 60 |
• Ideal make-up to be trader. • An aggressive personality that can handle the emotional swings of this business. |
20 to 40 |
• Score indicates that you are too short term in your time horizon, which may lead to indecisiveness. • You may need to develop an effective system of trading that you believe in. |
−20 |
• Score indicates you may be too extreme for trading. • You may need to work on analysis and outlook before succeeding as a trader. This can be done through goal setting and achievement plans. |
Test 2: Determine Your Trading Beliefs
Many new traders underestimate the learning curve; especially with the advent of online trading. Too many simply do not accept that they will not make a profit the first year. In fact, any expectation of making money has the danger of undermining both discipline and your own prescribed trading strategy.
State which of the following are true and which are false.
• The main motivation for trading is to make money.
• All traders must be able to handle extreme risk.
• One of the keys to being a good trader is to know yourself.
• Ego is an important trait for traders. Otherwise you won’t have enough nerve to place a trade.
• W hen you trade, you must make your trading decisions based on prices, technical analysis, and your designated strategy.
• Focus on letting your profits run. In the end, profits will make up for any losses.
• It is crucial to make as many trades as possible every day.
• Losing trades teaches you more than your winning trades.
• The more you lose, the more you should trade. This is the way to overcome losses.
• Every trader should find and use an indicator or methodology that will apply virtually every time. This system will help to raise chances of success.
• Making a profit on virtually all your trades is a realistic goal.
• Trading with stops is a hassle; they take you out of the market too soon.
• The biggest challenge for many traders is selling a losing trade.
• W hen you’ve had a big day, you must withdraw some of your profits from your account to reward yourself.
• If you’ve had a string of profitable trades, you must look to increase your trade size.
Test 3: Level of Skill
If you do not know the answers to the following questions, it means that you have a longer learning curve. It does not mean that you are not suited to being a trader.
How do I know which stocks to buy?
• What determines a stock’s price?
• What is a bear market?
• What is a blue chip?
• What is a bull market?
• What is a dividend?
• What is a margin account?
• What is a market crash?
• What is a penny stock?
• What is a share?
• What is a small-cap stock? Mid-cap? Large-cap?
• What is an NAV?
• What is insider trading?
• What is a bear trade?
• What is the ask price?
• What is the bid price?
• What is the DCM board?
• What is the Dow Jones or the DJIA?
• What is the JSE main board?
• What is the Nasdaq?
• What is the PE ratio?
• What is the S&P 500?
• What is the VCM board?
• When is an open cry system?
Test 4: Profile Your Objectives
The following questions will help you to set up the objective statement in your trading plan.
Please answer the following questions.
• What annual rate of return do you want?
• Do you want to speak to portfolio managers or dealers when you trade?
• Can you handle the stress of speaking to a portfolio manager or dealer every trading day?
• Do you have the patience for long-term trading?
• What kind of personality do you have?
• Do you need lots of action?
• Do you need to be control of market orders (make decisions) all the time?
• Can you take advice from a financial mentor while you gain experience in trading?
• What trading books have you read, which top traders do you most admire and why?
• Would you insist that a portfolio manager or dealer copy their style of trading?
Remember that up to 90 percent of traders are on the losing side of every trade taking place in global markets. So maybe if many of these losers trade in the opposite direction, they will all have the perfect system to become unbelievably wealthy.