
Technical Indicator Wisdom 13
The maximum retracement is usually two-thirds.
Why Technical Analysis?
Let’s start by frightening you. Look at the following statement and ask yourself if any of it makes any sense…
… there are many categories of technical studies, including trend-following, fading and oscillators and include signals such as moving averages, convergence, divergence, directional movement indices, stochastic, commodity channel indices, and put-call ratios.
Now ignore the above and let’s bring a semblance of order in the process of analysis and technical triggers by keeping variables simple and logical.
I believe that technical studies are essential to trading, but used independently of fundamental analysis limits the scope of a trader’s understanding of the current price at the expense of a more general market and economic overview.
For example, take Company A’s RSI reading:
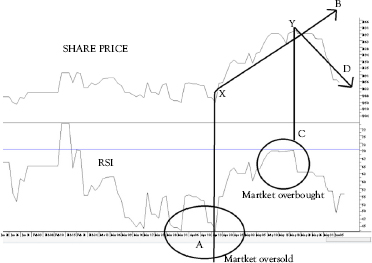
The value of the RSI is always a number between 0 and 100.
• A low number indicates a more oversold market
• A high value indicates a more overbought market.
So, when Company A’s RSI hits the oversold position (A), the share rises (X - B), but when it hits the overbought position (C), it falls (Y - D). It would be wonderful if that always happened. Yet, while the information is without doubt useful for traders, it would be even more so if used in conjunction with fundamentals.
Then the trader would have pertinent and crucial trading information such as length of a trend and a definable price target.
What are Technical Triggers?
Quite simply, technical analysis is the study of combined investor and trader sentiment and behavior and its effect on the current price of securities. The information to conduct technical analysis is derived from price histories of financial instruments, together with time and volume data. These variables enable technical systems to form graphs which traders use to forecast trends and price action.
Technical Analysis vs. Fundamental Analysis
Fundamentalists believe that the value of securities is best assessed by investigating complex financial statements, quality of directors and key management, and specially earnings and growth rates. They follow intricate patterns of analysis to make forecasts on securities in line with global markets and often relative to economic cycles.
Today, many analysts concentrate on company fundamentals, monitoring company trends and assessing how these could influence investors’ and traders’ perception of current and future share prices. This behavior is collectively called market or investor sentiment.
These volumes assert that investor sentiment should be the final filter to determining entry and exit levels.
Example: In late 2015 while commissioned by a major motoring company in Europe, I found my analysis peculiar and I started to doubt myself. This company’s turnover had increased from $1 billion to $3 billion within a three year period and profits had more than doubled. Yet the share price stayed at the 300 cent level during this entire period.
How could that happen?
Further and more in-depth analysis highlighted that investors simply did not trust management or the figures in the financials. Market sentiment was negative and a higher share price was not going to happen.
Therefore, while fundamental analysis highlights crucial corporate trends and technical analysis identifies trend patterns, investor sentiment holds the key to whether prices will actually move.
This volume adopts the stance that fundamental and technical analyses are mutually inclusive. In fact, these two systems can be used in reverse. Traders can use technical analysis to identify securities with potential positive trends and then use fundamental analysis to filter out those that do not meet your predetermined strategies. If more traders used both systems to determine what and when to buy or sell securities, many would be more successful.
Basic fundamental analytical concepts were covered in the previous chapters. Now, let’s do the same for technicals, which can be applied as follows:
Tools:
• A filter tool to identify potential investments.
• A timing tool to determine more accurately entry and exit points.
Questions:
• Plot the trend and assess how often these patterns occur.
• Set out the major support and resistance levels.
• Superimpose the share price to major support and resistance levels.
• What is the correlation between the share, its sector index, and the overall market?
• Assess whether important reversal patterns take place and how often.
• Highlight moving averages.
• Are momentum triggers positive or negative and do they confirm the stock’s current movement?
• Check that the share is liquid, i.e., does it trade at least 400,000 times a week.
By answering the above questions, traders will eliminate securities that are weak, so that they can concentrate on those that offer potential.
Not a Perfect Science
At a glance, traders can assess, analyze, and identify entry and exit levels in an instant. There is this vast and incredible amount of complex price and prices movement information that they use effortlessly to trade world markets.
Can it really be that easy?
Below are some ways in which technical analysis simply fails. I have witnessed such events and can attest that such financial disasters could have been avoided if fundamentals had been part of the mix.
Stated differently: Unpredictable events cause securities to move in unpredictable ways. The following are some basic reasons to support the combined use of technicals and fundamentals.
• Political events: Any political event can move markets. News that former President Mandela was ill in 1995 created havoc in South Africa, while Iran’s declaration that they had intensified their nuclear program fueled the fall of the U.S. dollar in 2007.
• Economic data: Some of the most sought after economic reports include employment data, GDP reports, manufacturing surveys, and major budget speeches.
• Natural disasters: Disaster that is perceived to influence production supply can move markets contrary to any technical forecast.
• Terrorism: Any act of terrorism can affect securities, in unpredictable ways. Notably, the U.S. Towers attack in 2001 and the London, Paris and Spanish attacks.
• War: Any conflict can affect securities, especially if deemed to negatively influence supplies, such as the Northern African conflicts in 2011; disruptions of oil production saw oil prices rocket to above $120/bl.
Chapter 14 highlights how to combine fundamentals and technical analysis.