
Introducing Analytical Methods
Technical Indicator Wisdom 12
A minimum retracement is usually one-third of the prior trend.
Over the past 20 years in stockbroking I have heard the argument that fundamental analysis doesn’t need technical triggers to make trading decisions. Then technical analysts are adamant that all events and factors that make up fundamentals are already in the share price, thus there is no need for fundamentals.
The Use of Fundamental Analysis
This argument for and against is tedious.
Let’s first look at the basis of fundamental analysis, followed by technical.
Fundamental analysis is usually equated with in-depth analysis of economic variables, including statistics, qualitative, and quantitative analysis. We can go further and say that this form of analysis requires some accounting knowledge as you have to assess companies’ financial statements. Without doubt, the above cover a vast array of information, including environmental and corporate reports, new legal and statutory regulations, and stockbroking schedules.
Fundamental analysis is therefore the study and use of the four environmental factors of economics, politics, business, and technology to assess and forecast influencing variables which will affect future price movements.
In fact, you have to take the above-stated environmental factors and apply them to global markets, regional areas, and country-specific sectors. Then, in addition to geographic analysis, you have to apply that analysis to macro-economic (GDP, inflation, unemployment, etc.) and micro-economic levels (company analysis).
To relate the above to a trader’s specific needs, fundamental analysis provides him or her with knowledge on how general market conditions could influence price action. The importance of fundamental analysis is thus the ability of the trader to understand how certain issues influence others, such leading and lagging indicators in both economic and stockbroking spheres. Remember that all news (good or bad) renders a reaction from investors and speculators alike. Then there are the strange reactions by speculators to news not being released: no specific report has been released, but the anticipation of such a report is so great that speculators move markets.
From a global perspective, if your county’s economy is solid, the more foreign businesses and investors will invest in your country and stocks will ultimately rise. So, as the economy improves, interest rates are raised to control growth and inflation, which makes securities more attractive. In order to get their hands on these assets, traders and investors have to buy which results in the value of the shares increasing.
The Importance of Technical Triggers
Technical analysis is defined as the use of price and price history to identify current and potential trends in securities and general markets.
The theory is that a trader can look at the price graph of a share and—using a number of historical patterns (set out as triggers) identify trends caused by buyer and seller behavior. These behavior patterns enable traders to potentially forecast price movements on the basis that technical analysts believe that all market information is already reflected in a share’s price. Therefore, patterns are a reflection of sentiment movement which creates patterns and trends. Traders can follow these patterns to make entry and exit decisions.
For instance, if a share’s price traded within a defined support and resistance level in the recent past, traders can assume that historical price levels should continue in the near future. Another way of looking at this statement is to say that investors and traders tend to react in similar ways to specific events.
In the following graph, two simple resistance and support levels are highlighted; as follows:
• Support Lines: CD and GH
• Resistance Lines: AB and EF
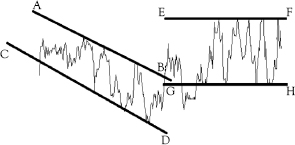
The assumption is that a share will bounce between AB and CD (or EF and GH).
I believe that the real lure of technical analysis is the instant graphic appeal, enabling traders to easily visualize trends and thus trading opportunities. The important thing is that novice traders understand technical concepts before they try to implement them. They use weird and wonderful terms like Fibonacci, Elliot Wave, and MACD which form part of the appeal for novice traders.
Chapter 13 continues to discuss technical analysis and the use of triggers.