AU 329: Analytical Procedures1
AU-C 520: Analytical Procedures
AU EFFECTIVE DATE AND APPLICABILITY
| Original Pronouncement | Statements on Auditing Standards (SASs) 56 and 96. |
| Effective Date | These standards currently are effective. |
| Applicability | Audits of financial statements in accordance with generally accepted auditing standards (GAAS). |
NOTE: Some of the guidance provided in this Statement might be useful in other engagements in which analytical procedures are normally applied, such as reviews of interim information or examinations of prospective financial information, even though it is not required to be applied in those engagements.
|
AU-C EFFECTIVE DATE
SAS No. 122, Codification of Auditing Standards and Procedures, is effective for audits of financial statements with periods ending on or after December 15, 2012. AU-C 520 does not change extant requirements in any significant respect.
AU DEFINITIONS OF TERMS
Analytical procedures. Analytical procedures consist of evaluations of financial information made by an auditor of plausible and expected relationships among both financial and nonfinancial data. They range from simple comparisons (the current year with the preceding year) to the use of complex models involving many relationships and elements of data (regression analysis).
A basic premise underlying the application of analytical procedures is that plausible relationships among data may reasonably be expected to exist and continue except as particular conditions (specific unusual transactions or events, accounting changes, business changes, random fluctuations, or misstatements) cause changes.
AU-C DEFINITION OF TERM
Source: AU-C 520.05
Analytical procedures. Evaluations of financial information through analysis of plausible relationships among both financial and nonfinancial data. Analytical procedures also encompass such investigation as is necessary of identified fluctuations or relationships that are inconsistent with other relevant information or that differ from expected values by a significant amount.
OBJECTIVES OF AU SECTION 329
Introduction
The term “analytical review procedures” was introduced in the official auditing literature in 1972. Such procedures were used in practice well before then and were commonly referred to as ratio and trend analysis and comparisons. The auditor’s reliance on substantive tests may be derived from:
Analytical procedures are now required in the planning and final review stages of an audit. The primary motivation for the requirement is that analytical procedures are effective in identifying misstatements and alerting the auditor to the possibility of certain types of material fraud.
OBJECTIVES OF AU-C SECTION 520
AU-C Section 520.03 states that
the objectives of the auditor are to
Planning the Audit
The objective of using analytical procedures in planning the audit is to increase the auditor’s understanding of the client and identify specific audit risks by considering unusual or unexpected balances or relationships in aggregate data. Specifically, the objective is to identify the existence of unusual transactions and events, and amounts, ratios, and trends, that might identify matters that have audit planning ramifications.
Overall Review
The objective of using analytical procedures in the overall review of the audited financial statements near the completion of the audit is to help the auditor in assessing the validity of the conclusions reached during the audit, including the opinion on the financial statements.
Substantive Tests
The section does not require the auditor to use analytical procedures as a substantive test (see “Fundamental Requirements”). The auditor may, however, use these procedures as a substantive test. When used as a substantive test, the objective of analytical procedures is to accumulate evidence supporting the validity of a specific account balance assertion. For example, the results of applying an average interest rate to average debt outstanding would provide evidence supporting the amount of interest expense.
FUNDAMENTAL REQUIREMENTS
Planning the Audit
The auditor is required to use analytical procedures in planning the audit. The purpose of analytical procedures at this stage of the audit is to assist the auditor in planning the nature, timing, and extent of the auditing procedures that will be used to obtain evidence in support of specific account balances or classes of transactions.
Overall Review
The auditor is required to use analytical procedures in the overall review of the audited financial statements. The results of this review may indicate that additional audit evidence may be needed.
Substantive Tests
The auditor may use analytical procedures to obtain evidential matter about particular assertions related to account balances or classes of transactions. When used for this purpose, analytical procedures are substantive tests.
- Was the data obtained from independent sources outside the entity?
- Are the data sources in the entity independent of those who are responsible for the data being audited?
- Was the data developed under a reliable system with adequate controls?
- Was the data subject to audit testing in the current or prior year?
- Were the expectations developed from data using various sources?
The auditor should document all of the following when an analytical procedure is used as the principal substantive test for an assertion:
- The expectation and factors considered in its development, when the expectation is not readily determinable from the existing documentation.
- Results of comparing the expectation to the recorded amounts or ratios developed from the recorded amounts.
- Any additional auditing procedures performed (and the results of such procedures) to respond to significant unexpected differences arising from the analytical procedure.
INTERPRETATIONS
There are no interpretations for this section.
PROFESSIONAL ISSUES TASK FORCE PRACTICE ALERTS
98-1 the Auditor’s Use of Analytical Procedures
This Practice Alert provides guidance to practitioners on:
- Forces external to the client’s industry
- The client’s position in the industry
- The client’s processes for achieving its objectives
- The prior years’ audits and results
- The client’s budgeted and actual amounts
- Discussions held with client personnel responsible for preparing recorded account balances or ratios and financial and nonfinancial results of similar entities operating in the industry
- Prior year data adjusted for anticipated change
- Current period data
- Budgets or forecasts
- Nonfinancial data from inside the entity
- Avoiding the use of an unaudited balance as a starting point for analysis.
- Being careful to watch for a pattern of unusual fluctuations
- Avoiding overreliance on management’s explanations
- Developing expectations using data at the appropriate level of disaggregation
Finally, the Practice Alert also covers various bases for developing expectations, such as trend analysis, ratio analysis, reasonableness testing, and regression analysis, as well as consideration of the precision of the expectation. These topics are covered in the Techniques for Application section.
TECHNIQUES FOR APPLICATION
Introduction
Analytical procedures include (1) comparisons, (2) ratio analysis, (3) trend analysis, (4) variance analysis, (5) preparation of common-size financial statements, and (6) regression analysis. The specific procedures used are determined by the nature of the client’s business and its industry, availability of data, degree of precision required, and auditor judgment.
When applying analytical procedures, the auditor may use data from outside the accounting system or financial statements, such as:
The remainder of this section contains a general discussion of various techniques for the application of analytical procedures, followed by an explanation of how these procedures could be applied to the specific phases of the audit—planning, accumulation of audit evidence (substantive tests), and overall review.
Analytical Procedures: General
When the auditor applies analytical procedures, he or she usually computes, compares, and analyzes ratios, trends, and variances. Generally, ratio analysis, trend analysis, and variance analysis are used together. In addition to these analyses, some auditors use regression analysis in applying analytical procedures.
Ratio analysis involves the following:
Trend analysis involves the following:
Variance analysis involves the following:
Comparisons with Industry
In applying analytical procedures, the auditor may wish to compare the financial data of the client with those of the client’s industry. For a diversified entity, however, comparisons may not be effective unless the auditor compares client segment data with appropriate industry data.
Comparisons with National Economic Data
The auditor may wish to compare the client’s financial data with national economic data such as the following:
The data are issued monthly, the first five by the US Department of Commerce and the sixth by the US Department of Labor. All of the data and other national economic data are reported in The Wall Street Journal.
Ratio Analysis
The most common analytical procedure is ratio analysis. Ratios may be classified based on their sources as follows:
Some of the more common ratios, their classification, method of computation, and the attribute measured are shown in the following list:
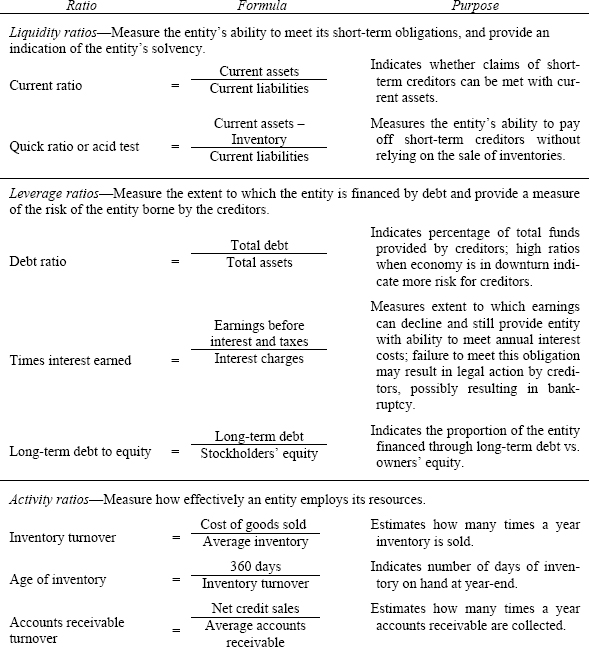

These ratios are some, but not all, of the ratios that may be used in applying analytical procedures. The auditor should use his or her knowledge of the client and its industry to develop relevant and meaningful ratios.
Ratio analysis has limitations in that it concentrates on the past and deals in aggregates. However, ratios serve as warning signs and indicators that are helpful in discovering existing or potential trouble spots when applied in trend analysis and variance analysis.
Trend Analysis
Trend analysis indicates the relevant changes in data from period to period. For example, assume the following sales in successive income statements:
![]()
If 20X1 is selected as the base year, sales for that year are 100% and sales for 20X2 are 150% (300 ÷ 200). Sales in a trend statement are as follows:
![]()
Any year may be the base year, and the auditor may select a moving base year. At the end of 20X6, he or she may decide to develop a new five-year trend statement by eliminating 20X1 and making 20X2 the base year or 100%.
Trend statements may be developed from any data. For example, assume the following gross profit percentages:
![]()
If 20X1 is selected as the base year, its gross profit percentage would be 100.0%, and 20X2 would be 102.4% (43% ÷ 42%). Gross profit percentages in a trend statement are as follows:
![]()
The unusual decline in the trend from 20X4 to 20X5 alerts the auditor to an area (sales and cost of goods sold) requiring special attention and, perhaps, additional audit procedures.
Maintaining trend statements for significant numbers, sales, cost of goods sold, repairs and maintenance, selling expenses, and so on, and for significant ratios aids the auditor in detecting unusual deviations from prior periods.
Variance Analysis
An auditor may wish to compare current data with predetermined acceptable levels (the norms). Deviations from these levels require investigation. This process is known as variance analysis.
When applying variance analysis, the auditor may use data for his or her norms from the following sources:
When using industry data in analytical procedures, the auditor may convert the client’s financial statements to common-size financial statements.
Common-Size Financial Statements
A common-size financial statement is one in which the numbers are converted to percentages. The dollars of cash, receivables, inventory, and other assets in the balance sheet are converted to percentages based on the relationship of each asset to total assets.
Common-size financial statements aid the auditor in comparing financial data of businesses of different sizes because not numbers but proportions are being compared. Further, most industry data such as those issued by Dun & Bradstreet are common size.
The following balance sheet is presented in amounts and in common size.
| Amount | Common size | |
| Cash | $ 200 | 6.7% |
| Accounts receivable | 500 | 16.7 |
| Inventories | 700 | 23.3 |
| Property, plant and equipment, net | 1,500 | 50.0 |
| Other assets | 100 | 3.3 |
| Total | $3,000 | 100.0% |
| Accounts payable | $ 300 | 10.0% |
| Other current liabilities | 100 | 3.3 |
| Long-term debt | 900 | 30.0 |
| Stockholders’ equity | 1,700 | 56.7 |
| Total | $3,000 | 100.0% |
Common-size income statements also may be prepared based on sales as the 100% figure.
Regression Analysis
Regression analysis is the means by which a relation between variables is used to make inferences about such variables. The relationships are expressed in terms of a dependent variable and one or more independent variables.
Regression is used in auditing to make inferences as to what account balances should be for comparison with what account balances are. Ordinarily, a linear regression model is used when the auditor applies regression analysis.
Linear Regression
The linear regression model defines the relationship between the dependent variable and the independent variable or variables in terms of a straight line. To determine meaningful relationships, the auditor should identify those independent variables that affect the dependent variable. Although these relationships will never be exact and will differ at various times, useful inferences are possible as long as the relationships indicate that a relatively stable pattern exists between the dependent variable and the independent variable or variables.
Defining the Variables
To develop the regression model, the auditor should define the variables. In defining the variables, the auditor will use his or her knowledge of the client and previously audited historical data. In developing regression models, the auditor also may use external independent variables, such as gross national product, disposable net income, unemployment rate, and so on.
The Linear Regression Formula
The linear regression formula is as follows:
Y = a + bX
In this formula, a is the value of Y when X is equal to 0. The slope of the regression line is b, which indicates the change in Y for each unit of change in X. For example, assume the auditor wishes to make inferences about the amount of recorded selling expenses. Based on his or her knowledge of the client, the auditor determines the following:
In the regression formula, the preceding information is expressed as follows:
Selling expense (Y) = $10,000 (a) + [.05 (b) × Sales (X)]
Therefore, if sales were $10 million, the auditor would expect selling expenses to be $510,000, determined as follows:
![]()
Applying Regression Analysis
After defining the variables and determining the values for a and b, the auditor should perform other steps before making inferences. These steps are as follows:
Permanent File for Analytical Procedures
Because analytical procedures are based in part on industry data and client prior period data, this data may be maintained in the client permanent file for subsequent use. The data to be maintained depend on the nature of the analytical procedures.
When the auditor compares current period results with prior periods, the comparisons may include the following:
The auditor may maintain in the client permanent file all periodic data used in the analysis.
The auditor also may include in the permanent file, when applicable, the following:
There is no specified period of time for which permanent file data should be retained; however, it is advisable to retain these data for at least five years.
Planning the Audit
Analytical procedures used in planning the audit are directed to (1) improving the auditor’s understanding of the client’s business and the transactions and events that have occurred since the last audit, and (2) identifying areas that may represent risks relevant to the current audit. For example, a lower than usual accounts receivable turnover ratio indicates possible collectibility problems. The auditor, therefore, should prepare an audit program for accounts receivable that emphasizes testing for the adequacy of the allowance for doubtful accounts.
Recommended Procedures
The Statement does not require the auditor to apply specific procedures. The sophistication, extent, and timing of the procedures are based on the auditor’s judgment and may vary widely, depending on the size and complexity of the client.
Analytical procedures used in planning the audit might include the following:
For a large, complex entity, analytical procedures might include regression analysis to estimate the amount of certain account balances and extensive analysis of quarterly financial information.
The results of analytical procedures used in planning the audit combined with the auditor’s knowledge of the client’s business and industry serve as a basis for inquiries and the effective planning of substantive tests.
Overall Review
The application of analytical procedures in the overall review stage of the audit is one of the last tests of the audit. Analytical procedures at this stage of the audit assist the auditor in assessing the conclusions reached concerning certain account balances and in evaluating the overall financial statement presentation.
Recommended Procedures
The overall review generally includes reading the financial statements and accompanying notes and considering the following:
In addition to reading the financial statements and accompanying notes, the auditor may consider using other analytical procedures, such as the following:
Results of Overall Review
The results of the overall review may indicate that additional audit evidence is needed. Because of this possibility, the auditor should try to complete the overall review before the end of fieldwork.
Substantive Tests
The extent to which the auditor uses analytical procedures as a substantive test depends on the level of assurance he or she wants in achieving a particular audit objective. The higher the level of assurance desired, the more predictable the relationship should be. As a general rule, relationships involving income statement accounts are more predictable than relationships involving only balance sheet accounts.
It may be difficult or impossible to achieve certain substantive audit objectives without relying to some extent on analytical procedures (e.g., this is often the case in testing for unrecorded transactions).
Some audit objectives may be difficult or impossible to achieve by relying solely on analytical procedures (e.g., testing an account balance that is not expected to show a predictable relationship with other operating or financial data).
Analytical procedures may be more effective and efficient than tests of details for assertions in which potential misstatements would not be apparent from an examination of the detailed evidence or in which detailed evidence is not readily available (e.g., comparison of aggregate purchases with quantities received may indicate duplication payments that may not be apparent from testing individual transactions).
Differences from expected relationships would often be good indicators of potential omissions, whereas evidence that an individual transaction should have been recorded may not be readily available.
The expected effectiveness and efficiency of an analytical procedure in detecting errors or fraud depends on, among other things:
- The nature of the assertion
- The plausibility of the relationship
- The reliability of the data used to develop the expectation
- The precision of the expectation
Availability and Reliability of Data
The auditor obtains assurance from analytical procedures based upon the consistency of the recorded amounts with the expectations developed from data derived from other sources. Other sources for data include industry trade associations; data service organizations, such as Dun & Bradstreet and Standard & Poor’s Corp. industry trade journals; and the client’s prior year’s audited financial statements. In circumstances where the auditor specializes in a specific industry, the auditor may use clients’ data to develop plausible expectations (for example, gross margin percentage, other income statement ratios, and receivable and inventory turnover ratios).
The reliability of the data used to develop the expectations should be appropriate for the desired level of assurance from the analytical procedures.
In general, the following factors influence the reliability of data used for analytical procedures:
- Whether the data was obtained from independent sources outside the entity or from sources within the entity.
- Whether sources within the entity were independent of those who are responsible for the amount being audited.
- Whether the data was developed under a reliable system with effectively designed controls.
- Whether the data was subjected to audit testing in the current or prior year.
- Whether the expectations were developed using data from a variety of sources.
Precision of the Expectation
The expectation of the relationship that exists should be precise enough to provide the desired level of assurance that differences that may be potential material misstatements would be identified for the auditor to investigate. Expectations developed at a detailed level ordinarily have a greater chance of detecting misstatements of a given amount than do broad comparisons. For example, expectations developed at a division level will have a greater chance of detecting misstatement than expectations developed at an entity level.
Documentation
As with any other auditing procedure, the auditor should document the application of analytical procedures. Section 329 requires certain documentation when an analytical procedure is used as the principal substantive test for an assertion. In addition, the following are recommended:
AU ILLUSTRATIONS
The following illustrations give examples of the application of analytical procedures and suggested follow-up audit procedures.
| 1. Sales | $120,000 |
| 2. Accounts receivable | 20,000 |
| 3. Average daily sales (Sales $120,000 ÷ 360 days) | 333 |
| 4. Day’s sales in accounts receivable [Accounts receivable ÷ Average daily sales ($20,000 ÷ $333)] | 60 |
| 1. Average inventory | ||
| Beginning balance | $20,000 | |
| Ending balance | 16,000 | |
| Total | $36,000 | |
| Total divided by 2 | $18,000 | |
|
NOTE: A better indication of the average inventory may be obtained by using month-end inventories, if available.
|
||
| 2. Cost of goods sold | $108,000 | |
| 3. Cost of goods sold ÷ Average inventory = Inventory turnover | 6 | |
1 This section is affected by the Public Company Accounting Oversight Board’s (PCAOB’s) Standard, Conforming Amendments to PCAOB Interim Standards Resulting from the Adoption of PCAOB Auditing Standard No. 5, An Audit of Internal Control over Financial Reporting Performed That Is Integrated with an Audit of Financial Statements.