
In today’s world, the underlying network protocols and the applications running on the network can be complex. Many times, issues involving applications and networks require visibility at the packet communication level to understand the problem and solve it.
One of the important applications of Wireshark is to capture packets and analyze them. Wireshark is a simple application to set up a capture. However, you should be aware of what packets you are trying to capture, the source and location of the packet flow, the volume of the flow, etc.
Wireshark is very flexible in terms of capturing packets of interest and ignoring other packets. This helps isolate your packets of interest when there is a lot of background traffic.
Packet capture and analysis through Wireshark can be done on all popular operating systems including mobile devices. But the approach may vary a bit.
Capture point placement and how to source packets for capture
Wireshark and OS-native packet capture tools
Various capture modes
Packet capture on mobile devices
Specific packet capture with simple and complex capture filters for high volume data analysis
Sourcing Traffic for Capture
Wireshark or similar applications running on a device listen to the packets traversing through a network interface and can capture the same. For the captures to work, the packets should be seen on the network interface first.
Packets generated by the device or packets destined to the device
Redirected or mirrored packets that are meant for other devices in the network but sent to a central device for capturing
In the subsequent sections, we will learn more about capturing mirrored packets and the basics of capture point placement.
Setting Up Port Mirroring
Port mirroring is a feature of network devices like routers, switches, and firewalls which helps replicate and redirect packets. Port mirroring can be called a port monitor or Switched Port Analyzer (SPAN) by various networking vendors.
Port mirroring continuously monitors the mirrored source ports, creates a copy of packets seen on the source port, and sends it to the mirror destination port. Both transmit and receive packets on mirrored source ports can be sent to the destination port for capture. The device running Wireshark or any other packet capture application is connected to the mirror destination port.

A model diagram of port mirroring. It comprises router, firewall, switch that is further connected to server S 2, S 3 and capture point and Wireshark.
Port mirroring
The actual configuration of setting up port mirroring on the network device is vendor specific. It is out of the scope of this book.
Remote Port Mirroring
In the previous scenario, the packet source devices which need the packets captured are connected to the same switch where our capture device is connected.
However, this may not be the scenario always when your network is big and spans across a number of devices and geographies. The switch or router where your capture device is connected may be separated by one or many devices. Sometimes, it may not be convenient to send someone to the remote packet source device to connect the capture device locally.
- 1.
Over a layer 2 trunk if it’s an L2 switching domain. This is known as Remote SPAN or remote monitoring depending on the network equipment vendor type.
- 2.
It can be encapsulated with an appropriate Generic Routing Encapsulation (GRE) header and tunneled across the IP network to the destination device. This is known as Encapsulated Remote SPAN (ERSPAN) or “mirroring to GRE” depending on the network equipment vendor type.
The mirror destination device decapsulates the captured packets if encapsulated and redirects them to the network port where the capture device is connected.

A model diagram of remote port mirroring. It includes components router 1, firewall, router 2, switch 2, switch 1, server S 1, server S 3 and capture point with Wireshark.
Remote port mirroring
Switch-1 mirrors the packets going in and out of port 1 and redirects to the remote switch, Switch-2, over a layer 2 trunk link between the switches.
Similarly, Router-1 mirrors the packets going in and out of port 2 and redirects to the remote switch, Switch-2, over a layer 3 IP network by encapsulating the captured packet in an ERSPAN and GRE header.

A screenshot of a program for E R SPAN header. It has commands; Frame 3; Ethernet second, Internet Protocol Version 4 with source and destination address; Generic Routing Encapsulation with sub commands, Flags and Version, Protocol type colon E R SPAN and Sequence number; E R SPAN type two.
ERSPAN header
The actual vendor-specific configuration of the mirroring is out of the scope of this book.
Remote mirroring (RSPAN), encapsulated remote mirroring (ERSPAN), etc. are vendor dependent and may not be supported on all your network devices. When you choose this option, do make sure to check vendor documentation.
While doing remote mirroring, all your mirrored traffic is carried over the network between source and network devices. This may overwhelm the underlying network if the sufficient capacity doesn’t exist. For example, if you are mirroring ten 1 Gbps ports and sending to the remote device, more than the 10 Gbps traffic may hit the underlying link. Make sure the transport link is of higher capacity than 10 Gbps and sufficient headroom is available to accommodate this. Otherwise, this will affect all other traffic flowing through.
Other Mirroring Options
The main purpose of port mirroring is to redirect capture traffic from the source switch or router to the destination port where the capture device is connected. However, the end hosts or network devices do not always connect to a switch or a router. There can be a direct link between the devices, and we need to capture the packets or errors on the link, etc. In this case, a low-cost solution of TAP or hub may help.
TAP
A network TAP or Test Access Point is a passive three-port device which can be inserted like a bump on the wire between two network equipment. All the packets between the devices are sent to the third port where the capture device can be connected. TAP uses splitters internally to replicate the data toward the capture destination port, while actual communication remains uninterrupted.
There is no limit on the size of a packet which can be replicated.
Capturing errored frames due to link issues, etc. is easy. These are normally dropped by switches during normal port mirroring.
Simple and cost-effective. No complex configurations are needed.
The link between the devices is interrupted while introducing the TAP. Hence, this operation should be carried out during a maintenance window.
Hub
A hub is a half-duplex device where packets sent or received on one port of the hub is also visible to other ports of the hub. As it’s a half-duplex communication, it may affect the actual data communication between the source devices.
Hubs are not commonly used when port speed is above 100 Mbps. This is a cost-effective solution for mirroring traffic but should be your last choice if other options don’t work.
Capture Point Placement
In the previous sections, we learned how we can source traffic from other network devices redirected toward the capture point. The general rule of thumb is to place the capture device or sniffer as close to the suspected network device as possible.
However, as the network size grows, it becomes a challenge to have capture devices at each location. To reduce efforts, we have to decide on what are the optimum points where we can do the packet capture. The approach varies based on different scenarios.
- Collect information related to the network problem at hand in detail.
Find the nature of drop or degradation and source and destination endpoints involved.
Find out the path of the packet taken by the affected flow and the suspected devices and interfaces involved in the packet drop or degradation.
Understand the direction of the issue on the suspected path or devices.
- If the problem description is clear and we have a limited set of suspected devices and interfaces or segments, then
Capture as close to the suspected locations as possible. If the desired device supports packet capture capability, leverage it for packet capture. E.g. many hosts and servers natively support packet capture utilities like tshark, Wireshark etc. Most of the network equipment like routers, switches, and firewalls also support on-the-box packet capture capabilities which can be leveraged.
If on-box capture is not available or we need to capture the packets traversing on the wire, we can use a port mirroring technique or TAP to redirect packets to a capture device.
If local SPAN is possible, it’s recommended. But if field engineer presence is a challenge, due to logistic reasons, then Remote SPAN or Encapsulated Remote SPAN can be done to mirror the packets toward a centralized capture device.
If the problem description is unclear and multiple devices or multiple paths are involved, then we will end up having captures from multiple suspected locations.
OS-Native Traffic Capture Tools
There are many external packet capture applications available for any operating system. However, many times a user may run into authorization issues that don’t allow the application to be installed or the application itself may not run properly. At that point, the native packet capture utilities which are available by default come in handy.
Some of the available native utilities are discussed in detail in subsequent sections.
UNIX, Linux, BSD, and macOS
All UNIX-like platforms have tcpdump natively available as a standard package. tcpdump offers a command-line interface which can print the contents of network packets to standard output or a file.
In many cases, it’s more useful and easy to capture packets using tcpdump rather than Wireshark. For example, you might want to do a packet capture remotely and either don’t have your OS GUI access or Wireshark is not installed on the remote device. In such scenarios, you can run tcpdump and capture the packets to a file for viewing through Wireshark on a local machine. Detailed ways of doing remote capture are discussed in the section “Remote Packet Capture with Extcap” of this chapter.
Usage:
The correct interface and the name of a file to save into will have to be specified in the preceding command. The interface name can be found from the “ifconfig” or “ip addr” command. In addition, in case you are not mentioning capture size or capture count, the capture can be terminated with ^C when enough packets are captured.
When you want to see a detailed packet, decode with the verbose option (-vvv) with an Ethernet header (-e).
The following could capture two-way packets for SSH:
And/or statements can be used to have a desired filter:
Other tcpdump capture options can be found at the tcpdump man page: www.tcpdump.org/manpages/tcpdump.1-4.99.1.html. We will discuss more on the filters in the “Capture Filtering” section of this chapter.
Windows
Windows has a built-in packet capture component called "ndiscap." This is implemented as an ETW (Event Tracing for Windows) trace provider. This ETW technology allows applications to produce trace messages or events. ndiscap should be preferred compared to other popular packet capture methods (WinPcap, included with older versions of Wireshark) due to performance problems. A capture can be collected as follows.
Administrator privilege may be required for the captures.
Find available interface name or GUID
Start the capture with interface GUID or interface name
Stop the capture
ndiscap packet capture generates a file in etl format, which cannot be opened by Wireshark. etl files can be opened by ETW-centric tools like Microsoft Message Analyzer, but that may not help here. There is an open source tool available by Microsoft known as etl2pcapng.exe that can convert the etl file to a pcapng file which can be opened with Wireshark. The etl2pcapng can be downloaded from the GitHub link: https://github.com/microsoft/etl2pcapng/.
Administrator privilege may be required for this.
Convert the .etl file to .pcapng for Wireshark viewing
Wireshark-Based Traffic Capture
Compared to the native capture utilities, Wireshark is more flexible and advanced. Wireshark is available on all popular operating systems, and wherever available, it is recommended to be the first choice for packet capture and analysis.
Wireshark is a GUI-based application, but it comes with command-line options with dumpcap or tshark which almost fulfills the same requirements.
CLI-Based Capture with Dumpcap or Tshark
Dumpcap and tshark behave the same way, use the same pcap library and have similar flags, and capture filters as tcpdump discussed in the earlier section. In fact, tshark uses dumpcap as its capturing engine. There are some minor differences between dumpcap and tshark.
Difference Between Dumpcap and Tshark
Difference | Dumpcap | Tshark |
|---|---|---|
Default availability | Part of the Wireshark suite | Optional package in some OS |
Capture display | Can’t display on the terminal. Dumps to a file | By default, displays on the terminal and dumps to a file |
Extcap interface detection (for remote capture) | Can’t detect | Works well with extcap interfaces |
Performance | Performs better than tshark in heavy load | Compared to dumpcap, some packets can be missed in heavy load |
Additional flags | -N: Number of packet buffers -C: Number of byte buffers -t: Separate capture thread per interface | These flags not available |
GUI-Based Capture with Wireshark
In Chapter 1, you have got a good understanding of Wireshark installation, basics of the user interface, etc. In this chapter, we will focus on how to get a simple packet capture started.
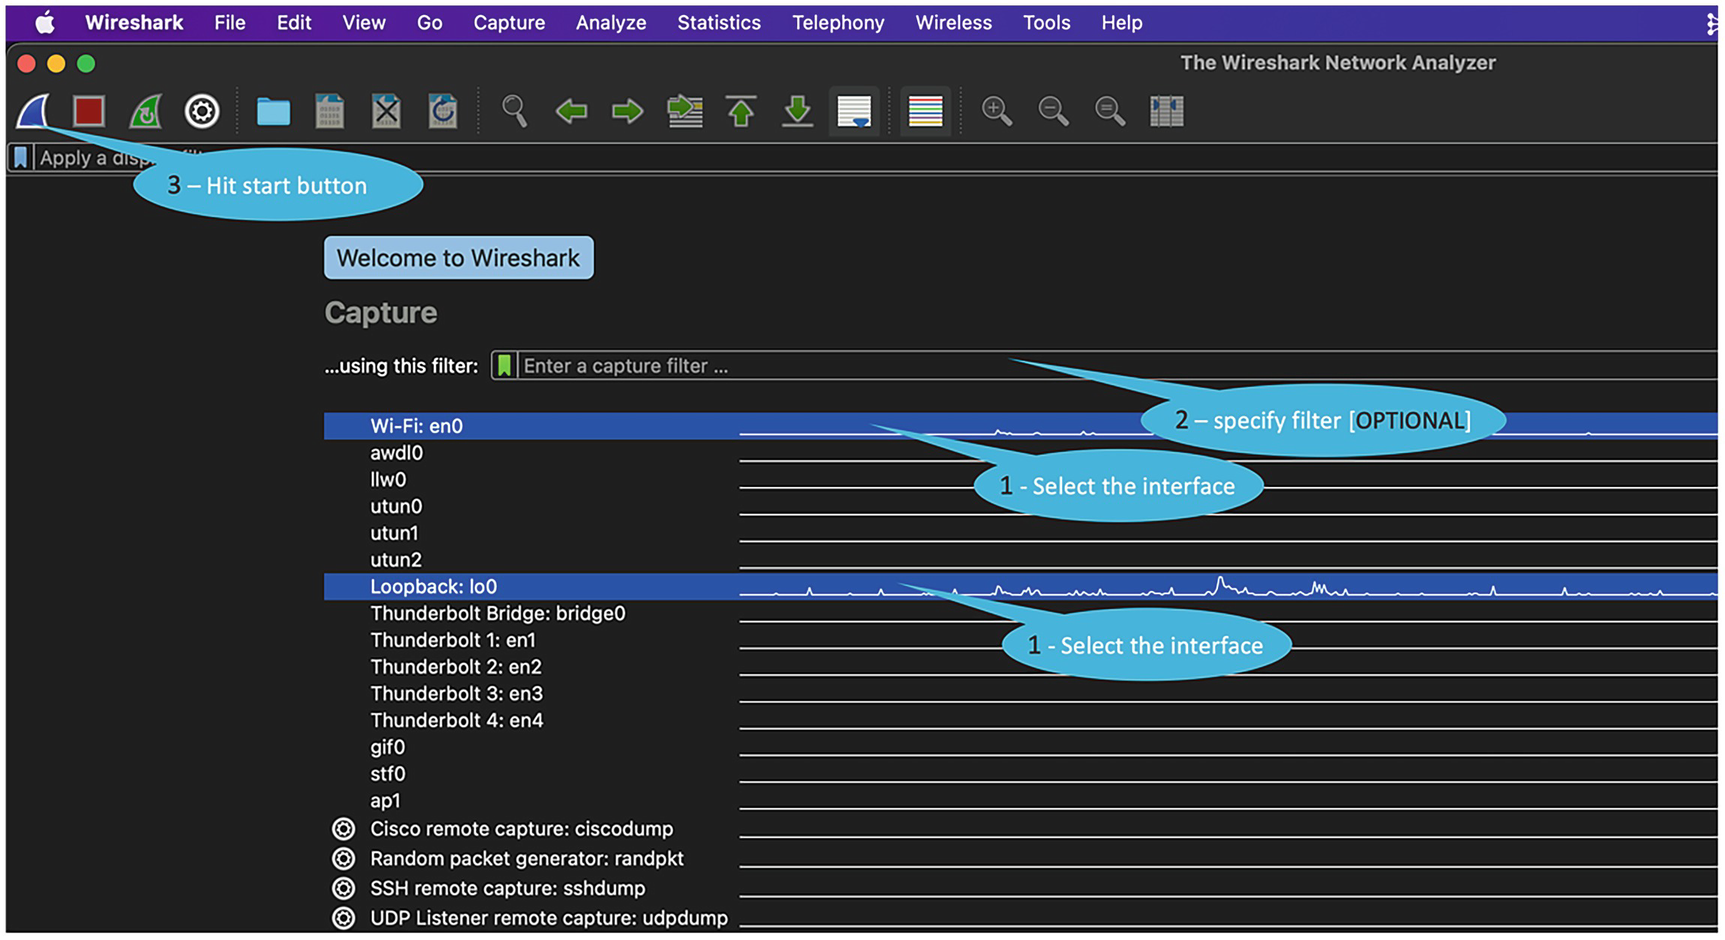
When you launch Wireshark, it shows a list of recently opened capture files (in the following image, it's empty and not shown) and also a list of available interfaces.
The traffic rate graph is also shown against each interface. This helps identify quickly which interfaces are active and have traffic flowing.
- 1.
Select the desired interface.
- 2.
[Optional] Specify a capture filter if want to limit capture to packets of interest. If not specified, all packets are captured.
- 3.
Hit the start button.

A screenshot of Wireshark application window demonstrates steps to capture a packet. It involves steps 1. Select the interface. 2. Specify filter optional, 3. Hit the start button.
Starting a packet capture
Capturing Traffic from Multiple Interfaces
A screenshot of Wireshark application explains steps to capture multiple interfaces. Step 1. Select multiple interfaces on screen, 2. Specify filter which is optional, 3. Hit start button
Capturing on multiple interfaces
Stopping Capture

A screenshot of Wireshark application demonstrates steps to capture multiple interfaces. Step 1. Select multiple interfaces on screen, 2. Specify filter which is optional, 3. Hit start button
Stopping capture and saving
Capture Modes and Configurations
Promiscuous Mode
Promiscuous mode is related to how a network adapter processes a packet received on its interface. By default, if the destination MAC is not the adapter MAC, the adapter may drop the unicast Ethernet frame. This means the received packet may be destined to a different adapter or device, and the local adapter shouldn’t process.
Promiscuous mode if activated on the adapter allows a network adapter to process all frames whether it's meant for this adapter or not.
In some virtual machines, the adapter settings may need to be tweaked to allow promiscuous mode, but normally we don’t have to change anything for hardware adapters.
Once the network adapter passes the frames not meant for itself for further processing by applications like Wireshark, capture behavior can be controlled at the application level too.
Wireshark by default captures in promiscuous mode. This is very important for capturing packets coming to the capture device redirected by switch port mirroring (SPAN) other device network interfaces. For successful capture of such frames, the network adapter should be operating in promiscuous mode, and Wireshark should have activated promiscuous mode.

A screenshot of Wireshark explains options to configure promiscuous mode. 1. Select Promiscuous mode for each interface manually, 2. Click, Enable Promiscuous mode on all interfaces, to auto select all interface.
Configuring promiscuous mode
Pitfalls
Vlan Tag Is Not Seen in Captured Frames
On Windows platforms, some of the network adapters strip off the dot1q vlan tag/header before passing the frame to Wireshark for processing. This may be seen if promiscuous mode is not enabled. To fix this, appropriate registry settings can be done as recommended by the vendor. We have the reference link for Intel adapters in the “References for This Chapter” section.
Monitor Mode
The monitor mode is related to Wi-Fi adapters, which allow packet capture at the 802.11 radio level and not at the Ethernet level.
The Wi-Fi adapter has to support the monitor mode, and not all adapters and OSs may have support for the same. Details on monitor mode are discussed in the “wireless capture in Chapter 4.”
Remote Packet Capture with Extcap
In previous sections, we have seen how to use Wireshark to do a live capture of traffic traversing through the network interface locally. If the packet doesn’t hit the local interface, capture can’t be done.
This concept can be further evolved for remote device capture through extcap. The extcap interface plugin makes available remote device interfaces as virtual capture interfaces on local machines. These virtual capture interfaces can be used directly in Wireshark to trigger packet captures.
androiddump
ciscodump
randpktdump
sshdump
udpdump
In the Wireshark GUI, extcap interfaces are normally presented as interfaces with a picture of a gear. In the interface capture list, they will be at the bottom, so you may need to scroll down. In tshark, you can list which ones are available with tshark -D. Note that dumpcap -D will not show extcap interfaces.
We can discuss more on this with an example of sshdump.
Remote Capture with Sshdump
Sshdump is an extcap tool that makes available locally an interface of a device accessible through SSH. This allows running a capture tool remotely and tunneling the captured packets over an SSH connection to the local device running the sshdump extcap plugin.
Requirements
Some packet capture executables (like tcpdump, wireshark, etc.) must have been installed on the remote device.
SSH connection is allowed to the remote device.
The SSH user is allowed to run the capture utility.
The following is the way to trigger sshdump from the Wireshark GUI.

An image of Wireshark home page illustrates the first step to trigger S S H Dump from Wireshark Graphical User Interface. Step 1. Click the gear icon, S S H remote capture colon s s h dump

An image of two windows, 1. Server details window, fill Server address and Port I d 2. Authentication details window, fill server user name and password for S S H remote capture interface.

An image of Capture window in S S H remote capture. It requires details of Remote interface, Remote capture command, tick box, Use Sudo on the remote machine and click on Start button to capture.
Mobile Device Traffic Capture
Wireshark supports packet capture on mobile devices. However, it can have a lot of other tool dependencies. In the following section, we have discussed some of the approaches like Wireshark native ways and third-party apps.
Android Devices
Using Native Androiddump Utility
- 1.
You must have installed an Android SDK. Android SDK for various platforms is available at the following:
- 2.
Add the SDK to the PATH environment variable. The environment PATH specified should contain a directory with tools like "adb" and "android" required for the capture. They come as part of the SDK installation.
The following is an example in macOS to update the environment PATH:export PATH="${HOME}/Library/Android/sdk/tools:${HOME}/Library/Android/sdk/platform-tools:${PATH}" - 3.
The Android device must be connected to the device running Android SDK and Wireshark through USB or Wi-Fi pairing. Without this, the androiddump-related extcap interfaces won’t be available on the Wireshark. Figure 2-8 shows the connected devices in the Android Studio.

An image of device manager window in Android studio. It has a connected device in physical option tab.
Android Studio device manager connections
- 4.
For network interface packet capture, the Android device must be rooted, and the tcpdump binary should be installed. Binaries can be found at this location: www.androidtcpdump.com/android-tcpdump/downloads.
- 5.
Some Android devices require on-screen authentication, and hence you must have required (root) permission to the Android device.
- 1.
Logcat Main (binary [<=Jelly Bean] or text)
- 2.
Logcat System (binary [<=Jelly Bean] or text)
- 3.
Logcat Events (binary [<=Jelly Bean] or text)
- 4.
Logcat Radio (binary [<=Jelly Bean] or text)
- 5.
Logcat Crash (text; from Lollipop)
- 6.
Bluetooth Hcidump [<=Jelly Bean]
- 7.
Bluetooth Bluedroid External Parser [Kitkat]
- 8.
Bluetooth BtsnoopNet [>=Lollipop]
- 9.
Wi-Fi tcpdump [need tcpdump on phone]
Once the preceding requirements are satisfied, the respective androiddump extcap interfaces will be visible on Wireshark on the capture device running Wireshark and Android Studio (Android SDK).

An image preview of two images. 1. Wireshark window depicts Android Logcat radio interface, 2. Android Logcat radio window has two tabs, Default has server I P address and port I D
Androiddump interfaces

An image of Wireshark interface explains Android dump Capture. The second row is selected with destination, Logcat. The bottom of the image Android dump reflects at bottom of the image.
Androiddump capture
Using Third-Party Android App and Sshdump
There are multiple free and paid Android-based applications available which allow packets to and from the Android-based mobile device to capture packets on the required interface and locally save them to a pcapng file or send remotely to a Wireshark capture device through the sshdump extcap utility.
In this section, we are discussing one such free application called “PCAP Remote,” which captures the packets on a required interface and streams packets to an SSH server interface on the Android device. We can utilize the sshdump extcap utility available on Wireshark running on a remote capture device to open a connection with the Android device SSH server and receive packets in real time.
Step 1: On the Android device

An image of P C A P Remote android app settings. Dashboard has; Capturing Mode colon S S H Server; Server address and port I D which auto populate with capture mode S S H Server
PCAP Remote Android app settings
Step 2: From the remote device running Wireshark

An image of P C A P Remote Wireshark settings step one. Upon selection of S S H Remote capture, it opens Wireshark interface Server tab. It has server address and server port
PCAP Remote Wireshark settings – 1

An image of two Wireshark S S H remote capture window with authentication and capture tab details. 1. Authentication tab has Server username and password which cannot be empty; 2. Capture tab has remote interface which needs to be specify and hit start
PCAP Remote Wireshark settings – 2

An image of Wireshark interface explains P C A P Remote Android Wireshark S S H Dump capture. A program illustrates, Source port, Destination port, Sequence number, acknowledgement number and details at the bottom
PCAP Remote Android Wireshark sshdump capture
Capture Filtering
On a network with high volume data, if we capture every frame that is being discovered, the capture buffer can be exhausted very quickly. Capture filters are used to decrease the size of captures by filtering out only relevant packets matching the condition before they are added to the capture file.

An image of Wireshark interface of capture filter. A dialogue box; capture options has Input tab with option to select interface to capture filter.
Capture filter
A capture filter consists of primitive expressions like protocol type, protocol parameters, etc. connected by logical expressions like “and,” “or,” “not,” etc.
Only capture IPv6 packets with protocol value matching <Protocol>
Only capture TCP packets with source port of 1234.
Capture Filter Deep Dive
At first glance, capture filters might seem like the ugly twin of display filters. However, capture filters are not the same as display filters and have a different syntax. If you are used to working with display filters, the syntax can feel less expressive. It may seem as if you are not able to filter for most protocols or expert information, but capture filters are powerful too and can achieve most of the filtering requirements.
Wireshark capture filters follow the libpcap filter syntax documented at the tcpdump man page: www.tcpdump.org/manpages/pcap-filter.7.html.
The filter expressions in turn get converted to the BPF (Berkeley Packet Filter) syntax in the backend. The BPF architecture executes the BPF filter code on the network packets to find a match. This helps in the real-time computation of the network packets for the kernel to decide if it can drop or truncate incoming packets as early as possible. This eliminates user space application involvement for further analysis. BPF can compile the filter expressions to a code that the Linux kernel understands and can act on.
All the libcap-based capture applications like Wireshark, tshark, dumpcap, and tcpdump use the same uniform BPF syntax for capture filters. When you specify the capture filter, the text strings are converted to a set of BPF instructions and compiled automatically by the BPF compiler.
Understanding BPF: What Goes Behind the Capture Filters
If you want to understand the corresponding BPF instructions or want to troubleshoot why sometimes the capture filter string did not work the way expected, it can be easily found as follows:
GUI way
After specifying the capture filter in the dialogue box, hit the Compile BPFs button. This generates the compiled BPF code.
 An image of Wireshark interface explains compiled filter output. It has capture option dialogue box, capture filter for selected interface has T C P; Click on compile B P Fs option for output.
BPF Instructions Explained
BPF Instruction | Meaning |
|---|---|
(000) ldh [12] | Load 2 bytes from byte 12. This corresponds to the Ethertype value |
(001) jeq #0x86dd jt 2 jf 7 | If loaded value, i.e., Ethertype, is 0x86dd (ipv6 packet) is TRUE, go to #2, or if FALSE, go to #7 |
(002) ldb [20] | Load 1 byte from byte 20 (IPv6 Next Header) |
(003) jeq #0x6 jt 10 jf 4 | IPv6 Next Header: If TCP, then MATCH, go to #10, else #4 |
(004) jeq #0x2c jt 5 jf 11 | If IPv6 packet has extension header |
(005) ldb [54] | Load 1 byte from byte 54 (IPv6 Extension Header) |
(006) jeq #0x6 jt 10 jf 11 | IPv6 Extension Header: If TCP, then MATCH, go to #10, else #11 |
(007) jeq #0x800 jt 8 jf 11 | If loaded value, i.e., Ethertype, is 0x800 (ipv4 packet) is TRUE, go to #8, or if FALSE, go to #11 |
(008) ldb [23] | Load 1 byte from byte 23 (IPv4 protocol value) |
(009) jeq #0x6 jt 10 jf 11 | IPv4 protocol value: If TCP, then MATCH, go to #10, else #11 |
(010) ret #524288 | MATCH. Capture the packet |
(011) ret #0 | No match. Do not capture |

An image of B P F example. It has alphanumeric characters illustrates; Zero Six as Protocol, B P F hashtag 8,9 example; 0800 as Ether type, B P F hashtag 7 example.
BPF example
High Volume Packet Analysis
Let’s take a use case where we need to find a DHCP packet flowing randomly at a very low rate across a service provider core router on multiple 100 Gbps interface. The background data rate can be very high close to the line rate of 100 Gbps where the packet of interest can be flowing at less than one packet per second.
This is like searching a needle in the haystack, and if we don’t use any capture filtering, the capture file will exhaust the disk space very quickly, and postcapture analysis will also be very difficult. The following are some of the approaches that will help in the capture.
When the Packet Characteristics Are Known

An image of capture filter for D HC P packets. It contains; Tick box to enable promiscuous mode on all interface; Capture filter for selected interface details, port 67 or 68
Capture filter for DHCP packets
When the Packet Encapsulations Is Unknown
Sometimes, we are not clear about what additional headers can be added on the packet. Say there may be a vlan tag on the DHCP packet if it’s going across an Ethernet trunk. In case it’s carried across an MPLS layer 2/3 VPN, there can be additional MPLS headers and tags also. There can be scenarios also where the packet may not be given required treatment and missing some of the expected headers. We can use packet size/range-based filter to minimize the overall capture. We may have to do multiple trial runs to fine-tune the range.

An image of capture filter for M P L S packets 250–400 bytes. It contains; check box to enable promiscuous mode on all interface; Capture filter for selected interface, m p l s and start expression greater two fifty and less four hundred end expression
Capture filter for MPLS packets 250–400 bytes

An image of capture filter for all packets 250–400 bytes. It contains; check box to enable Promiscuous mode on all interface; Capture filter for selected interface, great two fifty and less four hundred
Capture filter for all packets 250–400 bytes
Advanced Filters and Deep Packet Filter
Filters based on byte offset
Byte offset notation–based filters can be a bit confusing initially, yet are the most powerful. Once you understand the logic, you can design a filter to capture any kind of packet even though standard protocol expressions are not available for the same.
Protocol = Can be an expression like ip,icmp,icmpv6,tcp,udp
X = Offset in bytes from the start of the specified protocol header
Y = Number of bytes to check
The filter tries to match Y bytes located X bytes from the start of the specified protocol header.
The default value of X = 0, which means the protocol header starts with zero bytes. The default value of Y = 1, which means if you do not mention anything, 1 byte will be checked.
This is simple yet so powerful as any packet can be filtered just by specifying the value of the number of bytes to match and the offset or location of the bytes from the start of the protocol header.

A table lists the code of I P and T C P header bytes in blue and red colors in four code series 0000, 0010, 0020, 0030, and 0040. Three values are highlighted in 0010, 0030 is 40, 01, and b b.
Example:
In the preceding example, we used the “=” operator. But other logical operators (>, <, >=, <=, =, !=) can be used to form a filter.
Masking with byte offset filters
In many scenarios instead of the whole byte, it is useful to isolate nibbles or a few bits for matching. Bit masking helps in extracting the desired bits.
Using the preceding approach, complex filters can be designed to match packets based on specific TCP flags, IP flags, or for that matter any field inside any packet.
Summary
This chapter is all about capturing the packet.
How to source packets for capturing using various port mirroring methods
How to use the OS-native capture utilities available by default
How to leverage Wireshark and related utilities for better packet capture experience
How to remotely capture packets using various SPAN and extcap methods
How to capture packets on mobile devices
How to use capture filters for efficient packet captures