Chapter 9. Metrics and Governance
In today’s world of investments gone bad, projects being canceled because of budget constraints, and other financial hardships, one thing is more certain than ever before: if you can’t measure the results of your process or investment, you have no idea what the real cost of the effort is. Many tools capture all kinds of data about many things. Many organizations focus on the usage model and workflows of their systems to improve their process governance. These are all needed, but they are not enough. A very important aspect of any system is the ability to easily get data from it on which to base business decisions. You may have the best ClearQuest schema in the world, and it may do a lot of cool stuff, but if you don’t have the ability to generate key reports, you are only realizing half the value from your tool investment.
In the first part of the chapter we will explore various types of metrics that can be created with ClearQuest or with the Jazz-based system.
The second part of the chapter is about change management (CM) governance. We discuss process control, access control, user permissions, and monitoring the processes. We continue by demonstrating how you can establish various levels of CM governance with ClearQuest and with the Jazz tools.
9.1. Metrics
This section explores types of metrics, strategies organizations can adopt, and tools they can use to measure and show improvement.
Metrics are usually categorized in four levels depending on the organizational level and role that will be using the metrics. The levels are individual, team, project, and organization.
The organization should define a strategy to create reports that provide the status of each process in the software development lifecycle. A good strategy will ease the discovery of process flaws and help the organization to improve performance.
To generate these metrics you can use the reporting utilities provided with the tool and external tools that extract the data from the tool repositories. We describe the reporting tools in section 9.1.4, “Tools.”
9.1.1. Types of Metrics
Organizations typically categorize their metrics in three or four levels:
• Individual: used to measure individual productivity and efficiency
These metrics are typically related to counting source lines of code (SLOCs) per unit time, bugs fixed per unit time, or requirements generated per unit time. This list is not all-inclusive, but the idea is simply to examine the effectiveness of the individual or outsourced individuals. Examples of this are metrics based on headcount cost and lines of code, code complexity, and defects generated.
• Team: used to measure a small team’s productivity and efficiency within a project
These metrics are very similar to the individual metrics but focus on a team rather than an individual. For example, in the Agile practice, team productivity can be measured by team velocity, requirements delivered, and defects found.
• Project: the typical project metrics
These include the project management metrics such as actual cost of work performed (ACWP), estimated total cost (ETC), and budgeted cost of work performed (BCWP). These also include the development metrics: requirements volatility, test coverage, requirements to test traceability, defect density, and so on. The good news is that ClearQuest can generate these easily. The bad news is that each organization is slightly different, so not every organization or project will want to see every metric. For a prescriptive set you can start with the Measured Capability Improvement Framework (MCIF) set of metrics.
• Organization
These metrics are strongly tilted toward the business and project portfolio metrics and away from the development metrics. There is also a strong tilt in the development metrics toward the test and quality metrics at this level.
9.1.2. Metrics Strategy
A common strategy for metrics is to look at the software development lifecycle (SDLC) as a series of processes with work items and artifacts flowing through it. A good metrics strategy will produce a series of reports such as the following:
• A graph of work items open, resolved, and closed. The work items can be use cases, features, or requirements in the definition phase; defects or tests in the maintenance phases; or however the planning granularity is tracked. The graph shows time so that trends can be examined and decisions can be made about probable completion dates. An example is shown in Figure 9.1.
Figure 9.1. Work item status over time

• A histogram of the estimated size of the work items is also useful. This is typically done in terms of effort. An example is shown in Figure 9.2. In the chart you can see that there are about 75 work items for which the estimated work effort is less than one day, and there are 20 records for which the estimated work effort is between five and seven days, and so on.
• For Agile projects a graph of the velocity is useful for an iteration, with the velocity being defined as the number of work items done per unit time. In Agile projects the unit of time should not be greater than one to two days. An example is shown in Figure 9.3.
• A chart can also show work items in terms of planned and unplanned work. A large amount of unplanned work has a tendency to slip deadlines. Figure 9.4 shows an example.
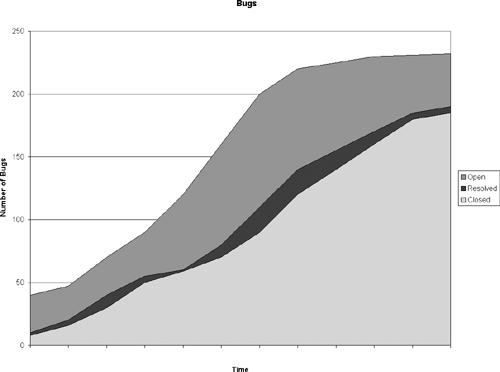
• Reports you do for work items in general can also be done for each type of work item, such as defects. As the number of defects starts to rise during the project, they should get fixed and the open defect rate should fall as shown in Figure 9.5. Of course things are not ready to ship yet.
Figure 9.2. Work item size estimation
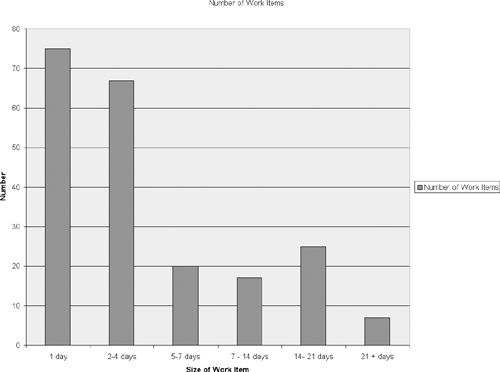
Figure 9.3. Velocity indicator: work item completion over time

Figure 9.4. Planned versus unplanned work items

Figure 9.5. Work item resolution rate: open, resolved, and closed bugs over time
• Build reports are very important as well. Each failure should be reported on as well as the cause of each failure.
• The following quality indicators should be placed on a single report to provide overall trends to the testing teams:
– Code churn
– Tests passed
– Percentage code coverage
– Tests failed
– Tests not completed
These are a few reports that have been used to help troubleshoot projects in the past. We could build similar sets with requirements and requirements traceability. We could also do similar things with design classes and services.
Reports such as these would be useful to each of the roles that Rational covers in the SDLC.
9.1.3. Supporting Data for Metrics
When you define your metrics strategy, you need to analyze your schema metadata to find out whether you have the supporting data to derive the metrics required. For example, if you want to derive a histogram of the estimated size of work items in a project, you need to have at least a field containing the estimated effort of each work item. This field is a default in a Jazz work item, but for ClearQuest you will have to add such a field to each work item type. If your strategy requires more precise analysis, you may need more than one field, such as estimated effort for development and estimated effort for testing and maybe more.
For ClearQuest you will have to consider the units of time measured. In a Jazz work item the user can select the units (3 d for three days, 20 h for 20 hours); with ClearQuest it is not that easy (although it is possible with scripting). We suggest defining a field of type Integer and using hours as a unit of measurement, but of course this is not the only option and for some implementations it may not be suitable.
Another example would be measuring project status; for that you would need at least fields for a due date and an actual date. Jazz work items have the due date field by default; there is no actual date field, but this information can be retrieved from the history, although not as easily as retrieving the data from a dedicated field of type Date.
9.1.4. Tools
Generating the metrics requires a tool and sometimes more than one tool. The tool is required to collect data from one or more repositories and present the results to the user in the required format. Formats can be textual reports, various types of charts, lists, and more.
To generate individual and team metrics, many of the work item management tools include internal reporting utilities. For example, ClearQuest includes the following:
• Internal query wizard and SQL query to display a matrix of field data
• Internal chart wizard to display trend charts, distribution charts, and aging charts
• Crystal Reports, integrated with ClearQuest, to generate textual and formatted reports
These tools and utilities can access a single repository and can provide metrics for individuals, teams, and some of the project-level metrics.
Another product that can generate ClearQuest reports is Rational SoDA (Software Document Automation). This product can access the repositories of several Rational tools such as RequisitePro, ClearCase, and ClearQuest and generate documents that combine data from all repositories. The disadvantages of using SoDA are the complexity of the definition of the reports and the long time it takes to generate them. The advantages are the ability to access more than one repository and the fact that it uses the popular Microsoft Word application to define the templates and generate the reports.
9.1.4.1. Crystal Reports
Crystal is a reporting tool from Business Objects (SAP) that allows you to create ClearQuest report formats. A report format is the report layout that specifies where and how to display the fields on the report form. Note that Crystal Reports Designer does not work over the Web.
To complete the report you need a query that defines which records will be retrieved from the database. Figure 9.6 demonstrates the definition of a report that includes the selection of the report format and the query.
Figure 9.6. Definition of a report in the ClearQuest Windows client

The report format in Figure 9.6 was created with Crystal Reports Designer. The query was created with the ClearQuest query wizard.
For more information on Crystal Reports visit the product Web site: “SAP Crystal Solutions—SAP Crystal Reports,” www.sap.com/solutions/sap-crystal-solutions/query-reporting-analysis/sapcrystalreports/index.epx.
For detailed instructions on how to create reports and report formats, see ClearQuest Help > Managing Change and Releases > Using the Rational ClearQuest for Windows Client > Viewing query results in reports > About creating and editing report formats.
9.1.4.2. Business Intelligence and Reporting Tools (BIRT)
BIRT is an Eclipse-based open-source reporting system for Web applications. BIRT has two main components: a report designer based on Eclipse, and a runtime component that you can add to your application server. For more information on BIRT visit “Business Intelligence and Reporting Tools,” www.eclipse.org/birt/phoenix/ (accessed February 24, 2011).
To learn about deployment options visit ACTUATE, “Datasheets and White Papers to Better Help You Understand BIRT-Based Products,” www.birt-exchange.com/be/products/product-resources/ (accessed February 24, 2011).
9.1.4.3. Report Management with the Report Server for ClearQuest
You can use the Report Server for ClearQuest to manage and run ClearQuest reports.
ClearQuest reports can be designed with Crystal Reports or with the open-source BIRT designer included with the ClearQuest Eclipse client. The reports can then be uploaded to the Report Server for ClearQuest. The Report Server for ClearQuest provides services to manage and run ClearQuest reports.
The Report Server interaction with ClearQuest is demonstrated in Figure 9.7.
Figure 9.7. Report Server for ClearQuest

To learn more about the Report Server functionality, possible configurations, and deployment, see ClearQuest Help > Administering > Administering Rational ClearQuest Web > Planning and configuring the reporting environment > Reporting deployment configuration > About the report server for ClearQuest.
9.1.4.4. Rational Publishing Engine
Rational Publishing Engine is a solution for document generation from data held in Rational ClearQuest, Rational Quality Manager, Rational Team Concert, Rational DOORS, Rational Tau, Rational RequisitePro, Rational ClearCase, and third-party applications including any XML data source. You can run the document generation manually or in batch mode for unattended use. You can either use the predefined templates or design your own using the Document Studio application.
For more information visit the Publishing Engine Web page: IBM Rational, “Rational Publishing Engine—A Document Publishing Automation Tool,” www-01.ibm.com/software/awdtools/pubengine/ (accessed February 24, 2011).
9.1.4.5. Rational Insight
Rational Insight is not just a reporting tool; it is an ETL (extract, transform, load) engine that extracts data from various sources (such as ClearQuest and RTC repositories) and presents the required data for each role in a Web-based view. For example, Insight reports can be optimized by role; you can evaluate actual results against business or project goals and receive e-mail alerts.
Insight can be configured to support multiple projects and multiple products and will work in a geographically distributed environment. Rational Insight is coupled to Rational’s Measured Capability Improvement Framework (MCIF) for best practice measurement guidance; it enables organizations to capture the right information so that they can measure and improve their software delivery processes over time.
For more information visit the following Web pages:
IBM Rational, “Rational Insight—Real Insight. Real Results. Real Progress,” www-01.ibm.com/software/rational/products/insight/index.html (accessed February 24, 2011).
IBM Rational, “Rational Insight—Systematic and Consistent Project Performance Evaluation and Tracking,” http://jazz.net/projects/rational-insight/ (accessed February 24, 2011).
9.2. Governance
Governance consists of the processes and actions that management takes to enforce the policy and rules the organization has decided upon. It involves measuring performance and taking action to reduce risks. We usually talk about business governance and IT governance, but in this book we are interested in a narrower view. In this chapter we shall focus on how work items are used in the governance of the process of change.
Work item management provides some level of governance with the capabilities incorporated into the tools:
• Process control and automation
• Permissions (access control and security)
• Monitoring
We shall first discuss each of the capabilities and later explain the usage with ClearQuest and Rational Team Concert.
9.2.1. Process Control and Automation
The ability to define a workflow that specifies the change request lifecycle enables IT to enforce a process that conforms to the organization’s rules. This process can be as rigid as required, meaning that no work-arounds are possible; on the other hand the process can be more flexible when less control is required. For example, if the process requires that an SCCB must approve every major change, that rule can be enforced in the work item workflow. In addition, the process should be set up in a way that only a person having the role SCCB is allowed to perform an action (Approve, Reject, or Defer) that is a result of the SCCB decision.
Every action in the workflow can be controlled in the same way. Here are some examples: Only the role Test Manager can approve the correctness of a fix; only the role Development Lead can approve a change resolution; build should be approved by the Build Manager and Development Manager roles; closing a change request is performed by the Submitter role.
Another method of governing the process, probably the best way, is by automation—actions are performed automatically and executed by a set of rules—although this is not always possible. Here are some examples of automation:
• Change the state of a work item based on internal conditions.
• Set the due date based on the severity and the required fix effort.
• Auto-assign a user based on the work item type.
• Launch automatic testing upon a developer’s Deliver action.
9.2.2. Permissions (Access Control and Security)
User permission is a broad term and is related to several levels in the change management application and to several objects in the work item.
System access is the user permission to log in to the system. This is the first security control element. The administrator can grant a user access to a repository, set the user’s role, and allow the user to have access to tools and utilities. System access is related to user authentication, which can be performed at the tool level (users are defined in the tool repository) or in an external directory such as LDAP.
Access control is the user permission to perform an action on a work item, for example, permission to submit an enhancement request or permission to close a defect. Access control can be set for individuals, user groups, or roles. Using roles is probably the best way, as we discussed in Chapter 5, “Roles.”
Field permission is the user permission to modify the value of a specific field in a specific state of the work item lifecycle. Field permission can be read-only, optional, or mandatory.
Record security is the permission to see the content of a specific record. ClearQuest record security completely hides the records from users who are not members of groups that have the permission to see the record. Security record permission is usually set by project or product. (This feature is not supported in the Jazz work item.)
Electronic signature is a method that requires the user to provide an electronic signature before a sensitive operation. This procedure is common in medical and financial processes. The additional signature ensures that the person performing the action is indeed the person who is logged in to the system.
9.2.3. Monitoring
Monitoring involves the capability to trace historical information or to capture current and historical project status. Examples of historical monitoring are the following:
• Who has performed a specific action?
• Who has changed the value of a field (for example, reduced the severity level) and when?
• What were the values of the record fields before and after the user’s action?
• Who has authorized this work?
These are examples of project status monitoring:
• Which are the high-priority defects that are waiting to be resolved?
• Show me the list of requirements not covered by work items in the current release.
• What is the total number of lines of code developed by each team in the last iteration?
• Which are the work items that are not closed and are past their due date?
Monitoring current work status involves getting data in real time (or close to real time); here are some examples:
• Knowing what work items each team is working on
• Knowing what work item each individual is working on
• Getting a notification of when delays are detected in the project
• Being alerted to new risks that have exceeded some threshold value
Monitoring can be achieved by data pulled or pushed to the requestor. Pushed data includes e-mail notifications, RSS feeds, and dashboards. Pulled data includes execution of queries, charts, and reports that generate the required data.
9.2.4. Governance with ClearQuest
In this section we explain how to implement each of the governance elements discussed above (process control and automation, permissions, and monitoring) with ClearQuest.
9.2.4.1. Process Control and Automation with ClearQuest
Define the state transition matrix in each of the ClearQuest stateful record types to implement the organization workflow. (Workflow was discussed in detail in Chapter 3, “The Workflow.”)
For each action in the workflow set the Access Control hook, either by selecting the allowed user groups or by selecting a script that will dynamically set the allowed users by their roles. Role was discussed in detail in Chapter 5, “Roles.”
Process automation can be performed in ClearQuest by developing hooks with the ClearQuest API. In section 3.4, “Dynamic Workflow,” in Chapter 3, “The Workflow,” we discussed this in detail.
9.2.4.2. Permissions with ClearQuest
The first permission level is system access. In the ClearQuest User Administration tool you subscribe users to databases. Users will not be able to log in to a database to which they are not subscribed. Figure 9.8 shows the User Properties window; you can see that the user is subscribed to all databases. Also, you can turn LDAP authentication on to improve the security of the system. Because ClearQuest does not enforce any rules on the user password, active directory authentication will improve the security of the system. The User Properties dialog also defines the groups that a user belongs to, the privileges for various operations, and the database subscription.
Figure 9.8. User Properties in ClearQuest User Administration

Each action that a user can perform includes an Access Control hook. In Figure 9.9 you can see that Access Control to all actions is set by User Groups, but you can also set it with a BASIC or Perl script by clicking the Access Control box and selecting SCRIPTS > Add Perl Script, as shown in the figure.
Figure 9.9. ClearQuest Access Control hooks

Field permission is the user permission to modify the value of a specific field in a specific state of the work item lifecycle. To set the field permission, modify the Field Behaviors Section of each record type. For each field select the required behavior in each state. See the field behaviors table in Figure 9.10.
Figure 9.10. ClearQuest field behaviors in each state

The behaviors READ_ONLY, OPTIONAL, and MANDATORY are static for each state. To set a dynamic behavior you have to select the USE_HOOK value, as shown in Figure 9.10 for the field Resolution. The USE_HOOK behavior will require you to write a hook. This hook is written in the field permission area. Figure 9.11 shows the Record Fields section of the record type and the permission hook location.
Figure 9.11. ClearQuest field permission hook

The code in Listing 9.1 is an example of the permission hook of the field ucm_view. The hook returns the value $CQPerlExt::CQ_READONLY or $CQPerlExt::CQ_OPTIONAL to dynamically set the field behavior to read-only or optional.
Listing 9.1. Setting Field Permission
sub ucm_view_Permission {
my($fieldname, $username) = @_;
my $result;
# $fieldname as string scalar
# $username as string scalar
# $result as long scalar
# record type name is Defect
# field name is ucm_view
# Start User Code
# Set default value to return
$result = $CQPerlExt::CQ_READONLY;
# check if the session variable is defined
my $variable_defined_flag = $session->HasValue("EDIT_CQACT_CTX_TYPE");
if ( $variable_defined_flag ) {
# defined, get the value
my $edit_ctx_type = $session->GetNameValue("EDIT_CQACT_CTX_TYPE");
if ( $edit_ctx_type eq "EDIT_ENTITY" ) {
$result = $CQPerlExt::CQ_OPTIONAL;
}
}
# End User Code
return $result;
}
9.2.4.3. ClearQuest Security Context
Record security allows you to define which user groups can see a specific record based on a given record field value. For example, if your organization works on classified projects, you may wish to set the security record by project. In this way only the users defined as members of a classified project will be able see the records created in the project context; for other users the project and project records will be completely hidden.
This feature is very powerful if you want to open the database to external users, such as customers, vendors, and contractors. It restricts the external users’ view to records that you allow. Figure 9.12 shows the relationships of the record types involved in setting ClearQuest security.
Figure 9.12. Security Context record relationships

The Security Context field is a field of type Reference that points to a stateless or state-based record type. If we follow the previous example, the field Project is the reference to the stateless record type Project. You just have to check the Security Context box in the field Properties window, as highlighted in Figure 9.13.
Figure 9.13. Setting a field’s Security Context

After marking the Security Context, you must save and reload the schema to view the Security Context changes to the project record. A new field of type Reference_List that points to the Groups record type was created. Also a new tab, Ratl_Security, was created and the newly created field control was put on it. Figure 9.14 shows the tab, the field control, and its properties.
Figure 9.14. New tab and field created in the Security Context record type

After checking in the schema and upgrading the user database, you need to define the groups associated with each project. Let’s look at an example. Assume an organization has three projects: Alpha, Beta, and Gamma. Alpha and Beta are classified and Gamma is not. One solution is to create a user group for each project that includes the members of each project. For the project Gamma we can use the group Everyone. Figure 9.15 shows the projects and their associated groups in the query result grid.
The Everyone group includes all the subscribed users; it became available in version 7.0.1.
For more information see ClearQuest Help > Developing > Developing schemas with the Rational ClearQuest Designer > Creating Security Model.
Figure 9.15. Definition of context groups in the Security Context record

9.2.4.4. Electronic Signature in ClearQuest
Electronic signature is a method that requires the user to provide a secret code, such as a password, before performing a sensitive operation. This is common in medical and financial processes. The additional signature ensures that the person performing the action is indeed the person who is logged in to the system.
The electronic signature method of security is enabled through configuring the Electronic Signature package. You can set up the signature to be requested on state change or for specific actions. Usually it is set up to fire on Postpone, Approve, or Close actions.
Figures 9.16, 9.17, and 9.18 demonstrate the usage of the electronic signature during a promotion approval in a banking application. The promotion requires one, two, or three signatures, depending on the target environment. To approve the promotion the relevant role selects the action SignApproval as seen in Figure 9.16.
Figure 9.16. Selecting an approval action that requires a signature

The record is editable and the requiredness of the fields User Name and Password is Mandatory. The logged-on user must enter name and password as shown in Figure 9.17. The User Name is checked to be equal to the current logged-on user. Also notice that the check box Application Signature is marked to identify the signature stage.
Figure 9.17. Electronic signature fields

The details of the user who signed the approval are logged in the eSignature Log field. Figure 9.18 shows the log field after two approvals.
Figure 9.18. Log of signature details

9.2.4.5. Monitoring with ClearQuest
To monitor real-time activities with ClearQuest you will have to run a query periodically, such as every 15 minutes or so, to look for all modified work items since the last time you checked. From the query result set list, you may want to explore certain fields to make decisions in the short term. This can be done manually, or preferably by a script that includes alerts.
A better way to monitor a ClearQuest repository is using a tool like Rational Insight that displays dashboards to managers.
9.2.5. Governance with the ClearQuest ALM Schema
The ClearQuest ALM schema includes some built-in components that enable the organization to govern the process of change without schema changes.
9.2.5.1. ClearQuest ALM Process
The process in the ALM schema is built on three elements: the request, the task, and the activity. Each element (or record type) has a workflow, and the three workflows create the full change workflow. The ALM implementation allows each project to customize the process according to the project’s needs. For example, a project can reduce the process to two elements or even one instead of three and by that shorten the change lifecycle.
9.2.5.2. ClearQuest ALM Security Context
In the example described in section 9.2.4.3, “ClearQuest Security Context,” we used an existing record type (Project) as the Security Context record, and an existing field (Project) in the Defect record type as the Security Context field. Another approach is to create a dedicated Security Context record type. This approach is used in the ClearQuest ALM schema where the ALMSecurityPolicy stateless record type serves this purpose. It includes the field “name” and the field “ratl_context_groups” which is a Reference_List to the record type “groups.” This method allows the definition of various security policies with a single record type. You can use the ALMSecurityPolicy to define security policy for projects, products, components, and other domains by using the Category Security Context.
Figure 9.19 demonstrates the relationship between the SecurityPolicy record type and the Project, Role, Role Label, and Group record types. The numbered items indicate the sequence of operations in creating the security policy.
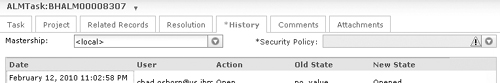
Figure 9.20 shows the Security Policy field (reference to the ALMSecurityPolicy record) in the History tab of the ALMTask record.
The Security Policy field exists in the following ALM record types:
• State-based record types: ALMActivity, ALMTask, ALMRequest, ALMProject, and BTBuild (in BTBuild the field control is in the ALM tab and not in the History tab)
• Stateless record types: ALMBaseline, ALMCategory, ALMComment, ALMIteration, ALMPhase, ALMRole, and ALMWorkconfiguration
Figure 9.19. ALM Security Policy record type relationship to other record types and the record creation order in defining the ALM security

Figure 9.20. ALM Security Policy field in the History tab
9.2.5.3. ClearQuest ALM Roles
The ClearQuest ALM schema includes stateless record types:
• ALMRoleLabel, which defines the role name and what actions are allowed on each record type.
• ALMRole, which defines for each project which members have that role, who is the primary role, and the permitted actions for the project. The project’s permitted actions may differ from the ALMRoleLabel permitted actions.
For more information see section 5.5, “Roles in the ClearQuest ALM Schema,” in Chapter 5, “Roles.”
9.2.6. Governance with Rational Team Concert
In this section we explain how to implement each of the governance elements previously discussed (process control and automation, permissions, and monitoring) with Jazz.
9.2.6.1. Process Control with Jazz
In the Jazz Process Configuration you can define a workflow that includes states, actions, and a state transition matrix. The workflow can be bound to work items to implement the organization’s process. Workflow was discussed in detail in Chapter 3, “The Workflow.”
9.2.6.2. Permissions with Jazz
Users should be defined as members of a project area to access the project area. With project area access control the Jazz admin can configure which users have read access to the project area (source control and work items). Each user is assigned to one or more roles. In the Jazz Process Configuration you define the permitted actions for each role. This can be done in Project Configuration or Team Configuration; click on Permissions to open the permission definition section. Figure 9.21 demonstrates permitted actions for the Test Manager role.
See section 5.6, “Roles in Jazz,” in Chapter 5, “Roles,” for more information on roles and permissions in Jazz.
Figure 9.21. Setting the permitted actions by project role

9.2.6.3. Monitoring with Jazz
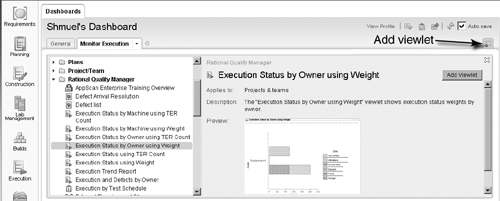
Monitoring in Jazz is performed mainly in the dashboard. For example, in Rational Quality Manager you can create dashboard viewlets to monitor subjects such as test execution status, lab resource utilization, defect submission rates, and many others. Figure 9.22 shows a viewlet to monitor Execution Status by Owner using Weight. On the left you can see the list of available viewlets to choose from.
Figure 9.22. Adding a viewlet to the Dashboards tab
Rational Team Concert users can create various dashboard viewlets to monitor defect density and trends, build health, resolution latency velocity, and many more. We suggest reading “Create a Performance Measurement Dashboard” in Rational Team Concert Help > Collaborating > Collaborating using Rational Team Concert > Managing dashboards in the Web interface.
From a Jazz dashboard you can monitor other Jazz servers or other servers that were defined as friendly servers. This enables you to see in your Jazz dashboard various ClearQuest query results. For instructions on how to create a remote repository viewlet see Rational Team Concert Help > Collaborating > Collaborating using Rational Team Concert > Managing dashboards in the Web interface > Adding and organizing content on a dashboard > Working with viewlets > Adding a viewlet from a remote repository.
You can organize the viewlets in the viewlet chooser in the way your organization categorizes metrics. Open the Rational Team Concert Eclipse client, and in the Process Configuration tab select Project Configuration > Configuration Data > Dashboards > Viewlet Chooser Entries.
In this form you can create new categories and subcategories and add viewlets to each one of them. Figure 9.23 is an example of a new category, Monitoring, with subcategories for the product.
Figure 9.23. Customizing Viewlet Chooser by category in RTC

9.3. Resources
9.3.1. Metrics and Governance
Measured Capability Improvement Framework (MCIF) article and e-kit: IBM Rational, “Rational Measured Improvement Overview,” www-01.ibm.com/software/rational/mcif/ (accessed February 23, 2011).
The Rational dashboard product information and whitepaper: IBM Rational, “Rational Dashboard,” www-01.ibm.com/software/awdtools/dashboard/?S_CMP=swhpmid3 (accessed February 23, 2011).
The Rational Executive Dashboard demo: IBM Rational, “Rational Executive Dashboard,” http://jazz.net/projects/rational-insight/executive-dashboard/ (accessed February 23, 2011).
Wikipedia, “Corporate Governance of Information Technology,” http://en.wikipedia.org/wiki/IT_governance (accessed February 23, 2011).
Ishigaki, Doug, “Effective Management through Measurement,” IBM developerWorks, www.ibm.com/developerworks/rational/library/4786.html, 2004 (accessed February 23, 2011).
IBM Rational, “Feature for ClearQuest Schema Repository Properties for Hook Level Security,” IBM Technote, www-01.ibm.com/support/docview.wss?uid=swg21282694, 2007 (accessed February 23, 2011).
Williams, Ben, Eric Larsen, and Jon Chard, “Improve Project Success with Better Information,” IBM White Paper, http://jazz.net/library/content/articles/insight/improve-project-success.pdf, 2009 (accessed February 23, 2011).
Hauser, John R., and Gerald M. Katz, “Metrics: You Are What You Measure!” www.mit.edu/~hauser/Papers/Hauser-Katz%20Measure%2004-98.pdf, April 1998 (accessed February 23, 2011).
9.3.2. Jazz Reports
IBM Rational, “Getting Started with Jazz Reports,” http://jazz.net/library/article/35, December 4, 2007 (accessed February 23, 2011).
The Team Reports component in Jazz provides the ability to create, deploy, and generate reports. This document describes how to set up and start using reports to track the progress of your software development.
Moody, James, “Reports Central,” https://jazz.net/wiki/bin/view/Main/ReportsCentral, December 13, 2010 (accessed February 23, 2011).
The Reports component provides a library of more than 50 out-of-the-box reports with Rational Team Concert 2.0. However, there are reports that we’d like to share with you that don’t ship with our products.
Moody, James, “Out-of-the-Box Reports,” https://jazz.net/wiki/bin/view/Main/ReportsOutOfTheBox20, December 8, 2010 (accessed February 23, 2011).
Rational Team Concert ships with a useful library of report templates that you can use in your own development projects. While many of these templates are automatically deployed to new project areas created with the Eclipse Way and OpenUP process templates, users authoring their own process templates, or wishing to add new reports to their project areas, might want a complete list of all of the example reports.
Moody, James, “Reports Component Home,” https://jazz.net/wiki/bin/view/Main/ReportsMain, December 14, 2010 (accessed February 23, 2011).
The Reports component in Rational Team Concert provides a rich library of out-of-the-box reports, a data warehouse, and integrated report viewing in both the rich client and the Web UI.
Peter, Kimberley, “Reports about the Guidelines,” https://jazz.net/wiki/bin/view/Main/ReportsAboutTheGuidelines, August 2010 (accessed February 23, 2011).
In the course of creating dozens of reports containing over 75 charts during the past several releases of Jazz and RTC, we gained a lot of knowledge about the design of graphs, tables, and reports for the visual display of quantitative information. Through the application of this knowledge, trial and error, and feedback from our users, we learned more about the kinds of information that are useful to an ALM customer, and how best to present that information to communicate the important messages clearly and effectively.
Moody, James, “Creating and Deploying a New Report,” https://jazz.net/wiki/bin/view/Main/ReportsCreatingANewReport20, September 1, 2009 (accessed February 23, 2011).
Jazz has many example reports that you may use to gain insight into your software development process. However, you are not limited to these reports. This article will guide you through the steps required to write your own report from scratch, using data from the data warehouse, and deploy the report to a Jazz repository.
Lavin, Matt, “License Usage Reporting,” https://jazz.net/wiki/bin/view/Main/LicenseReporting, May 25, 2010 (accessed February 23, 2011).
All license usage data is collected and stored on the license server. The server that is connected to the license server does not collect data of its own. There are two ways to collect data about the license usage on a license server: historic usage snapshots and a full license usage log.
RTC 2.0 InfoCenter, IBM Rational, “Tracking Data with Reports,” http://publib.boulder.ibm.com/infocenter/rtc/v2r0m0/index.jsp?topic=/com.ibm.team.reports.doc/topics/t_report_overview.html (accessed February 23, 2011).
Use reports to track progress and monitor other data for your project areas and teams. The Jazz Team Reports component provides you with the ability to create, deploy, and generate reports.
Moody, James, “Creating a Report in Rational Team Concert 2.0: Open Work Items,” http://jazz.net/library/video/286, June 26, 2009 (accessed February 23, 2011).
This video is a “Hello world” introduction to creating reports in Rational Team Concert 2.0. It demonstrates how to create a report that shows the historical data of open work items.
Jaouani, Rafik, “Custom Report for Reporting across Item Links in Rational Team Concert 2.0,” http://jazz.net/library/video/285, June 26, 2009 (accessed February 23, 2011).
This video is a quick tutorial on authoring a report template that reports across item links.
9.3.3. Data Warehouse
Moody, James, “Introduction to the Data Warehouse,” https://jazz.net/wiki/bin/view/Main/DataWarehouseIntroduction, June 19, 2007 (accessed February 23, 2011).
The data warehouse in the Jazz repository is an extensible storage mechanism for aggregated historical data. Out of the box, the Jazz reports component collects a number of data points related to work items, builds, and source control that one may want to visualize in a report. The articles linked from this page are intended to introduce the reader to data warehouse concepts and walk through the contents of the data warehouse.
Moody, James, “Data Warehouse Concepts,” https://jazz.net/wiki/bin/view/Main/DataWarehouseConcepts, June 19, 2007 (accessed February 23, 2011).
This article is intended to introduce the reader to some fundamental data warehouse concepts.
Moody, James, “Data Warehouse Snapshot Schemas,” https://jazz.net/wiki/bin/view/Main/DataWarehouseSnapshotSchemas20, November 16, 2010 (accessed February 23, 2011).
Rational Team Concert 2.0 ships with several predefined snapshots that collect and store information in the data warehouse. This article describes each of these snapshots and the tables and views that they create.
9.3.4. BIRT Reports
Moody, James, “FAQ: Writing Jazz Reports with BIRT,” https://jazz.net/wiki/bin/view/Main/ReportsBIRTFAQ, September 1, 2009 (accessed February 23, 2011).
This list of frequently asked questions details some tricks that we (the Reports team) have discovered while writing reports for Jazz with BIRT. Some of these FAQs are not Jazz-specific but might be useful for anyone using the BIRT Report Designer.
See also the article by James Moody, “Creating and Deploying a New Report,” listed under “Jazz Reports” above.
9.3.5. C/ALM Reports
Williams, Benjamin, “Out-of-the-Box Reports,” https://jazz.net/wiki/bin/view/Main/CALM-ReportingOOTBReports, February 17, 2011 (accessed February 23, 2011).
Each of the products making up the RTC 3.0 release provides a library of reports for the end user. These include out-of-the-box reports written in BIRT and RPE, and advanced reports written in Cognos. Some of these reports are what we call “traceability” reports, which report on artifacts from multiple domains (such as defects and test cases together in one report), and others are single-domain reports.
CLM Reporting Feature Team, IBM Rational, “CLM Reporting,” https://jazz.net/wiki/bin/view/Main/CALMReporting, February 21, 2011 (accessed February 23, 2011).
The C/ALM Common Reporting feature team aims to bring cross-product reporting to the Jazz family of products. These wiki pages describe the team and our work.
Moody, James, “CALM Reporting Goals,” https://jazz.net/wiki/bin/view/Main/CALMReporting-Goals, May 11, 2010 (accessed February 23, 2011).
The primary goals are to create a common reporting component for use by C/ALM products, which will enable point-product reporting and cross-product reports. There are a number of incidental goals as well. This page expands on these.
C/ALM Common Reporting Team, IBM Rational, “Dashboard: Common Reporting,” https://jazz.net/jazz/web/projects/Jazz%20Collaborative%20ALM#action=com.ibm.team.dashboard.viewDashboard&team=Jazz%20Collaborative%20ALM%20Development/Feature%20Teams/Common%20Reporting, 2011 (accessed February 23, 2011).
A central view of the reporting and data warehouse work for CLM 2011. Here you’ll find a top-down view of the plan items and stories, as well as links to the wiki and other important documents.
9.4. Summary
This chapter is divided into two main sections that are related to each other. The first section is about metrics. We discussed the four types of metrics (individual, team, project, and organization). We explained what a good metrics strategy should be and provided several examples of required reports. We explained that the work item management tool needs to have the required data to support the strategy, as well as a reporting tool. We discussed some of the tools that can help in deriving your metrics reports.
The second section of the chapter was about governance. We explained that governance consists of the processes and actions that management takes to enforce the policies and rules the organization has decided upon. It involves measuring performance and taking action to reduce risks and improve quality.
We discussed the governance capabilities incorporated in ClearQuest and Jazz work item management in three areas: process control and automation, permissions (access control and security), and monitoring.