Chapter 8
Indicators of International Exchange
The economic indicators discussed in earlier chapters focused on economic resources, production, and exchanges within the United States. However, even in discussing the composition of the gross domestic product (GDP), we observed that net exports from the United States to locations outside the United States must be recognized to bring consumption of final goods and services into balance with the use of resources to produce final goods and services. Imports add more final goods for domestic use, but draw on the income and wealth within the United States. On the other hand, exports result in more income and wealth coming to the United States, but sacrifice consumption of outputs from domestic productive resources.
Other nations use different currencies and the exchange rates between those currencies and the dollar are subject to change. Currency rate fluctuations may make U.S. exports look more or less expensive to companies abroad and make imports look more or less expensive to domestic companies. Thus, currency exchange rates are a major influence on international trade. Changing exchange rates can affect domestic prices and the inflation rate.
There are also exchanges of financial capital between the United States and the outside world. U.S. residents and businesses invest abroad, and foreign residents and businesses invest in the United States. The U.S. Treasury Department, which is a dominant borrower, allows non-U.S. entities to purchase its debt. These flows of financial capital affect currency exchange rates, the purchasing power of the dollar, and interest rates.
This chapter will focus on indicators that track exchanges, and the environment for exchanges, between the United States and the outside world.
International Trade
Both imports and exports have generally increased over time. This is a natural consequence of growing populations and per capita consumption both in the United States and elsewhere. However, the rate of growth in imports and exports has outpaced the growth in GDP as a result of the increasing internationalization of commerce. When the economy in the U.S. contracts, U.S. imports usually contract as well. Since the United States is a major export destination for other countries, a recession in the United States means a significant drop in other nations’ exports, resulting in contractions or recessions in their economies, and in turn those countries import less from the United States. Consequently, U.S. exports often decline in response to a decline in imports.
For much of the early twentieth century, the United States exported more than it imported. This trade surplus resulted from the emergence of the United States as the leading industrial producer and the most productive agricultural country in the world. The United States was also relatively unaffected by the destruction of productive capacity during World Wars I and II. However, with the emergence of other industrialized nations in the latter part of the twentieth century and heavy reliance on imported oil that escalated dramatically in price, the value of U.S. imports grew faster than, and eventually exceeded, the value of its exports.
Import and export activity in goods are monitored by the Census Bureau. The Bureau of Economic Analysis (BEA) tracks imports and exports of services. The BEA reports on the total imports and exports of goods and services monthly, around the second week of the following month.1 The report has considerable detail, showing the breakdown of imports and exports by type of good or service and by the country with which trade is done.
Petroleum imports and exports are given special attention since petroleum net imports account for about half of the difference between total imports and total exports. For this reason, the reports need to be viewed in the context of trends in petroleum prices.
Figure 8.1 shows total U.S. imports and exports from 1960 to 2010. The higher, thicker line is the graph of total imports, and the lower line represents total exports. Note that both import and export activity drop during recessions, with imports usually declining more than exports.
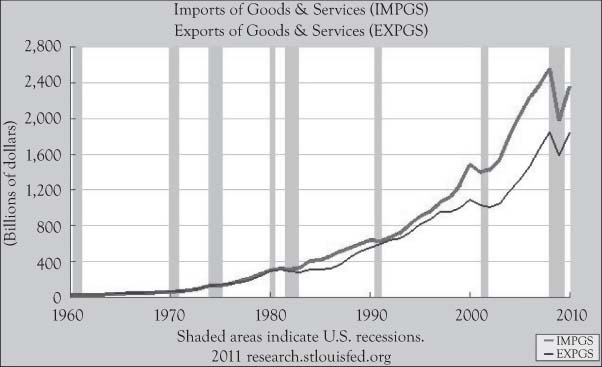
Figure 8.1. Annual U.S. imports (thicker line) and exports from 1960 to 2010. (Source: Federal Reserve Bank of St. Louis, FRED Economic Data.)
Figure 8.1 indicates that while both total imports and exports increased, imports increased faster in general. The difference is called the trade balance, which is calculated as the value of exports minus the value of imports, and has been generally negative in recent decades. This negative balance, or trade deficit, grew to about –$750 billion just prior to the recession that began in 2007 but has diminished considerably afterward. Two reasons for the growth in the negative trade balance are (1) the rise in the price of oil in real dollar terms with the United States being a net importer, and (2) the emergence of economies in Asia with cheaper labor and production costs, which has caused domestic production to move offshore. Although the trade imbalance, even at its peak, was just around 6% of GDP, an increasing negative trade balance is a concern to those in charge of macroeconomic policy in the United States, as it results in both an exodus of wealth and a lower demand for domestic resources.
Jumps in exports are regarded as a positive sign for the domestic economy because this generally means increased demand for the dollar worldwide, enhanced domestic economic activity, and more sales and profits for domestic businesses. Jumps in imports relative to jumps in exports can be a sign that foreign prices are lower than domestic prices for the same goods and services, which can put downward pressure on the exchange value of the dollar.
Import and Export Prices
Shifts in imports and exports occur largely due to shifts in prices of imports and exports. The Bureau of Labor Statistics, which collects domestic price data for the CPI and PPI, performs the same task to track changes in import prices and export prices. The BLS manages separate composite indexes for import prices and export prices (with a base year of 2000), published in a monthly report issued near the middle of the month following the month featured in the report.2 The lead report is usually expressed in terms of percent change from the previous month. The full report provides several supporting indexes for different types of goods, industry groups, and trading partner countries.
Figure 8.2 shows percent changes from a year earlier in the import price index from 1983 to 2010. Figure 8.3 displays percent changes from a year earlier in the export price index from 1984 to 2010. Note the year-to-year changes in these indexes fluctuate much more than domestic inflation rates corresponding to general price indexes like the CPI.
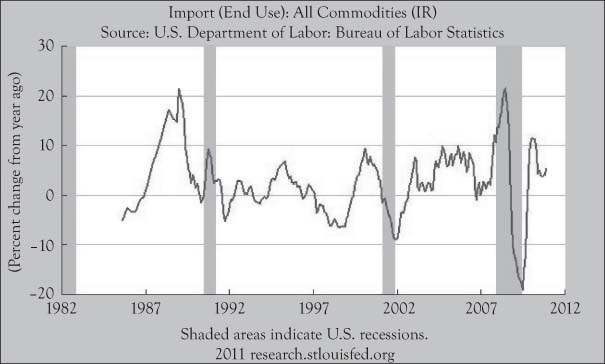
Figure 8.2. Changes in the price index for U.S. imports from one year earlier, not seasonally adjusted, from 1983 to 2010. (Source: Federal Reserve Bank of St. Louis, FRED Economic Data.)

Figure 8.3. Changes in price index for U.S. exports from one year earlier, not seasonally adjusted, from 1984 to 2010. (Source: Federal Reserve Bank of St. Louis, FRED Economic Data.)
A major determinant of the changes in these indexes is the fluctuation of the trade value of the dollar, which affects both import prices and export prices in a similar manner. When the trade value of the dollar goes down, as it did in the 1980s, import and export prices both increase. However, the change in the import price index fluctuates more than the change in the export price index, partly due to fluctuation in oil prices, which have a stronger effect on the import price index.
There is considerable variation in price changes among different types of goods and services, so a change in the overall import or export index does not imply a similar change in the prices of all imported or exported goods and services. In the case of the import price index, petroleum contributes over 25% of the weighting in the index, so a large change in petroleum prices can easily offset price changes in a different direction for a majority of other imported items.
Exchange Rates
Some of the changes in import and export prices are the result of fluctuation in the exchange rates between the dollar and the currencies in the other countries involved in U.S. trade. Since the 1970s, most of the major trading nations now allow their currencies to “float,” meaning the exchange rate is determined by currency market mechanisms where participants make bids to buy one currency using another currency, with the settlements establishing the exchange rate. Prior to the early 1970s, exchanges were fixed by negotiation between countries.
Some nations still use fixed exchange rates with the dollar as determined by their central banks. Even in countries that allow their currencies to float, the central banks of those countries may intervene with actions intended to influence currency exchange rates if they deem the exchange rate to be undesirable. If the amount of a foreign currency required to be exchanged for a unit of domestic currency is too high, the country’s exports may appear too expensive to foreign buyers. If that exchange rate is too low, the country may have difficulty acquiring sufficient quantities of key imports.
Several factors influence exchange rates. A country that offers higher interest rates will increase the demand for that currency because foreign investors will be willing to give up a larger amount of their currency to acquire that country’s currency and deposit money there. Countries with increases in inflation see the exchange rate (in terms of amount of foreign currency per unit of domestic currency) diminish because the purchasing power of their currency is diminishing faster. Countries with negative trade balances face downward pressure on exchange rates because the country will need to use more of its currency, in the net, to make purchases from foreign suppliers. Nations that have high debt or operate at deficits also have downward pressure on exchange rates because they need to attract more creditors, some of whom are foreign. Countries that are growing rapidly or are experiencing faster gains in productivity will tend to see higher exchange rates for their currencies because foreign sources will want to invest there. Political stability is also a positive factor in floating exchange rates since investments in unstable countries have a greater risk of loss.
Currency exchange rates are widely reported in the business media and in real-time on the Internet. Key currencies that float with the dollar include the Canadian dollar, the Mexican peso, the euro, the British pound, the Japanese yen, and the Chinese yuan. The Federal Reserve calculates and announces a weighted index for the value of the dollar relative to other currencies based on the amount of trade associated with each foreign currency.3 Figure 8.4 shows the monthly average value of the exchange rate index for major currencies from 1973 to 2010. The index uses a base month of March 1973. The dollar strengthened to its highest level of this period in the mid-1980s when the United States managed to bring its high inflation of the 1970s under control and the U.S. economy was booming, but then the exchange rate index dropped significantly. The dollar rose in relative value again in the late 1990s, when the United States was running a budget surplus and was at the center of the dot-com boom. However, due to skyrocketing deficits and increasing prices for imported oil, the dollar has declined to now retain roughly 75% of its value relative to other major currencies compared to 1973.
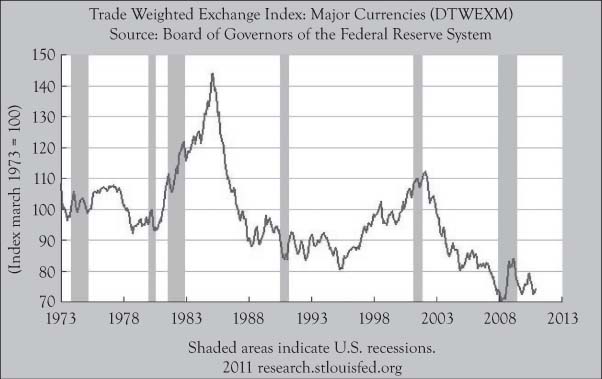
Figure 8.4. Trade-weighted foreign exchange index for U.S. dollar against major currencies, monthly and not seasonally adjusted, from 1973 to 2010. (Source: Federal Reserve Bank of St. Louis, FRED Economic Data.)
Balance of Payments
When goods and services are exported or imported, payments are received or disbursed by an individual or institution in the United States. However, there are additional transactions that result in funds flowing into or out of the United States: U.S. residents who have investments outside the country receive income in the form of interest or dividends, as do those who reside outside the United States, but receive income from investments within the United States. There are also financial transactions that cross borders when parties in the United States invest capital abroad and vice versa. Another type of cross-border transaction occurs when salaries are paid by U.S. businesses and governments to individuals working abroad, or to foreign nationals within the United States paid from sources abroad.
The net of all these fund transfers over a period is called the balance of payments. The BEA gathers data and estimates the balance of payments on quarterly basis in a report called U.S. International Transactions.4 The report is released in the middle of the third month following the end of the quarter.
The balance of payments is divided into three accounts: the current account, the capital account, and the financial account. The current account includes payments related to imports and exports. Thus the trade balances for months within the quarter are part of the current account. The current account also includes income received from abroad or paid from domestic sources to parties abroad in the form of interest, dividends, salaries, pensions, and benefits. Government grants and aid payments are part of the current account as well.
Figure 8.5 shows the seasonally adjusted, quarterly current account balance from 1960 to 2010. The current account balance was close to zero until the 1980s when the balance in terms of inflows minus outflows went negative. The balance returned to a positive value in the early 1990s, only to drop dramatically until 2006. This deficit balance diminished during the following recession, but has begun to grow again. Changes to the current account balance mirror changes in the trade balance fairly closely, so the negative trend in the current balance largely reflects the increase in imports into the United States and the jump in imported crude oil prices.
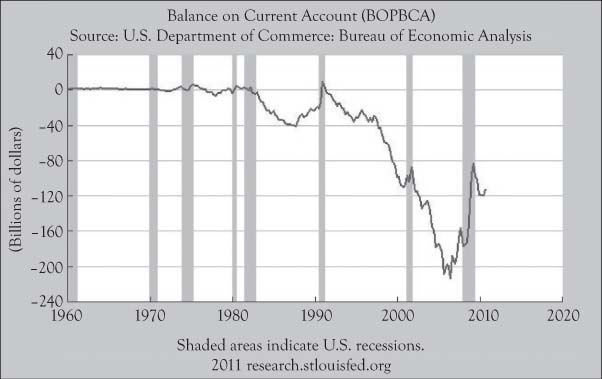
Figure 8.5. Balance on current account, quarterly and seasonally adjusted, from 1960 to 2010. Negative values indicate outflows exceed infl ows. (Source: Federal Reserve Bank of St. Louis, FRED Economic Data.)
The capital account balance is the net value of any transfer of a non-financial asset that is not the result of production activity, either to a U.S. resident, organization, or government entity from a foreign source or to a foreign resident, organization, or government entity from a U.S. source. Transfers to a foreign party would be negative entries. These non-production items include purchases and sales of rights, insurance payments across borders, transfer of assets across borders by immigrants or emigrants, and certain taxes across borders. The capital account balance is usually relatively small compared to the current balance and financial balance.
The financial account aggregates the net amounts from transfers of financial capital by foreign residents and institutions to the United States. Transfers of financial capital by U.S. residents and institutions to foreign locations subtracts from this account balance. For example, a purchase of a Treasury bill by a nonresident would add to the net flow of foreign-owned assets in the United States. A purchase of equity in a foreign company by a U.S. investment bank would increase the flow of U.S. assets abroad, which reduces the financial account balance. Figure 8.6 shows the net flow of foreign assets in the United States and Figure 8.7 shows the net flow of U.S. assets abroad from 1960 to 2010. Note that the values in Figure 8.7 are negative as net flows of U.S. assets abroad offset foreign assets in the United States for balance of payment purposes. Both types of flows increased significantly with time, other than during recessions. The net flows of foreign assets in the United States are generally higher than net flows of U.S. assets abroad, largely to compensate for higher imports than exports in the current account.

Figure 8.6. Net capital infl ow of foreign assets into the U.S., quarterly and seasonally adjusted, from 1960 to 2010. (Source: Federal Reserve Bank of St. Louis, FRED Economic Data.)

Figure 8.7. Net capital outfl ow of U.S. assets abroad, quarterly and seasonally adjusted, from 1960 to 2010. (Source: Federal Reserve Bank of St. Louis, FRED Economic Data.)
In theory, the sum of the balances in the current account, capital account, and financial account should be exactly zero.5 Any transaction that changes the balance of one of these accounts should be netted out in another. For example, if a U.S. firm exports raw materials, this would contribute to increasing the current account by the value of the sale. If the buyer purchased on credit, this would constitute an equivalent increase in the value of U.S. capital held abroad and decrease the financial account. However, the reported account balances are based on data collected for individual accounts, rather than formally done by double-entry accounting. Due to missing items and valuation differences, there are discrepancies that result in a sum of balances different than zero. The seasonal adjustments of the balance can also affect the amount of the discrepancy.
Treasury International Capital
Much of the data used by the BEA to determine the capital account balance in the quarterly balance of payments analysis is collected by the Department of Treasury. A monthly report is prepared showing the net impact of cross-border activity in the purchase and sale of equities, bonds, and short-term debt securities.6 The report is entitled Treasury International Capital and is released around the middle of the second month following the month featured in the report.
The summary measure in the report is the net flow of foreign investments in U.S. financial securities minus U.S. investments of foreign securities. Although this excludes direct investment by companies in overseas affiliates, the Treasury report is monthly and gives more timely feedback on activity in the financial account in the balance of payments, just as the BEA’s monthly report on trade provides more timely information on exports and imports in the current account.
International Investment Position
The BEA’s U.S International Transactions report estimates flows of capital assets across borders. However, U.S. assets held abroad and foreign assets in the United States change in value. Amounts held in corporate equities and commodities change in value with prevailing stock and commodity market prices. Debt instruments change in value due to changes in interest rates. Since these changes in valuations are not considered current income, they are not considered in the balance of payments report.
The BEA publishes an annual report that estimates the total valuation of these assets owned on one side of the U.S. border, but residing or having a liability on the other side of the border. The report is called International Investment Position and is released about six months following the year featured in the report.7 The report states the values, by category, at the end of the year and changes in value for each category from the end of the prior year.
Both foreign assets held in the United States and U.S. assets held abroad have generally increased other than during recessions. Foreign assets in the United States have been about 15% higher than U.S. assets abroad in recent years. This is not necessarily a negative development for the United States, as an exodus of foreign assets would cause disruptions in domestic markets and cause a drop in asset values.
The LIBOR Rate
While other countries have their own currencies, the U.S. dollar is often used as the currency even for transactions outside the United States. Many foreign banks have deposits of eurodollars that can be used to facilitate international exchanges. The term “eurodollar” derives from the fact that European banks were the first foreign banks to hold dollars, but eurodollar deposits are held in major foreign banks outside Europe.
The existence of eurodollars provides a convenient medium for international trade. Additionally, eurodollars provide a mechanism for a bank in one country to borrow from banks in other countries in order to meet short-term needs. The British Bankers’ Association establishes daily rates for these eurodollar loans, collectively called the London Interbank Offered Rate (LIBOR).8 One-month, 3-month, 6-month, and 1-year rates are announced each day.
LIBOR rates are the basis for other financial transactions, such as futures contracts and interest rate swaps that allow parties to insure against the risk of changes in exchange rates and interest rates. The LIBOR is also the basis for recalculating rates in some adjustable rate mortgages in the United States.
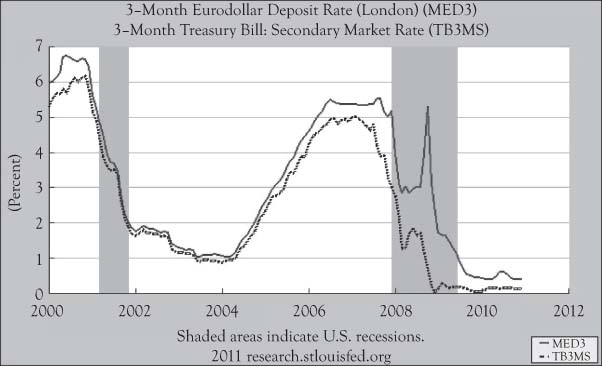
When the U.S. economy and international financial markets are fairly stable, the LIBOR rate is generally slightly higher than the comparable rate for the Treasury bill of the same duration. This difference is called the “TED spread.” The reason the LIBOR is slightly higher is the additional risk that the loan is not backed by the “full faith and credit” of the U.S. Government like Treasury bills. However, when international markets are nervous about the U.S. economy, especially its monetary policy, the TED spread can grow considerably because those who deposit or loan euro-dollars seek extra protection against the deterioration of the dollar against other currencies. Figure 8.8 shows the monthly average for the 3-month LIBOR rate and the monthly average yield for 3-month Treasury bills on the secondary market from 2000 to 2010. The graphs indicate a modest TED spread for most of that decade, until the subprime mortgage crisis threatened the entire financial system in 2008. After actions taken by the Federal Reserve and incoming Obama administration calmed fears, the LIBOR rate dropped down close to the Treasury bill yield.