
Chapter 3
Indicators of Economic Activity
Probably the most widely shared concern about the economy among business managers and executives is whether the economy is expanding or contracting. In this chapter we will consider some of the key U.S. indicators that measure economic activity. The sales levels for some businesses may be more closely tied to the activity in the overall economy than other businesses, but nearly all businesses see their sales move higher or lower somewhat in tandem with the overall economy. Further, for these key measures, accompanying indicators are usually reported for individual sectors and subsectors of the economy, at least one of which should apply to any business.
Gross Domestic Product
Probably the most important measure of overall economic activity in the United States is the gross domestic product, or GDP. This indicator is reported on a quarterly basis by the Bureau of Economic Analysis in the U.S. Department of Commerce,1 which releases a preliminary report near the end of the first month following the quarter. The report is revised near the end of the second month following the quarter and once again at the end of the third month following the quarter.
Since GDP is a monetary measure, it is subject to fluctuation caused by inflation, or changes in price levels. GDP is reported at annual rates, both in nominal (or current) dollars and in real dollars. Usually the reports convert GDP changes to growth rates from the prior quarter and from the same quarter a year earlier. GDP is reported by individual business sectors as well as for the economy as a whole. GDP is also measured for geographic regions within the United States. Figure 3.1 displays a graph of U.S. GDP in real dollars from 1970 to 2010.
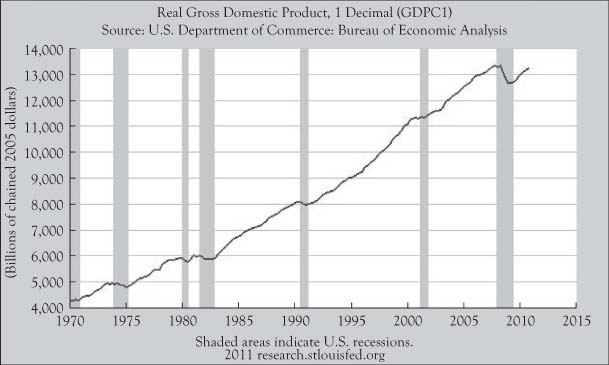
Figure 3.1. Real quarterly U.S. gross domestic product from 1970 to 2010, seasonally adjusted and annualized. (Source: Federal Reserve Bank of St. Louis, FRED Economic Data.)
The GDP for a study period represents the monetary value of all final goods produced during the period. Final goods represent both goods and services that are consumed rather than used primarily as ingredients in another good or service that will be sold. (Goods that are used primarily in the production of other goods and services are called intermediate goods.) The reason for excluding the value of intermediate goods from the calculation of GDP is to avoid double counting some components of a product or service.
Consider a loaf of bread that is available in a grocery store. A customer purchases the loaf, takes it home, where it is consumed by her household. Since the loaf is consumed, it is a final good. Prior to stocking the loaf on its shelf, the grocery store probably purchased the loaf from a bakery. Even though it was in the form of a loaf of bread, the purchase of the loaf by the grocery store would constitute the sale of an intermediate good. When the customer purchased the loaf, normally she would pay a price that is at least as high as the charge made by the bakery to the grocery store, and probably a bit higher to provide a margin to the grocery to cover part of its expenses and profits. If both the purchase by the grocery store and the customer were included in the GDP, the amount charged by the bakery would be counted twice.
In order to make the bread, the bakery needs ingredients like flour, yeast, and packaging, as well as services like labor and electricity. Since the costs of these ingredients are reflected in the price of the loaf downstream, these would also be considered intermediate goods and not included in the GDP.
Generally, goods and services purchased by individuals and households for their own use constitute final goods. When governments purchase goods and services, these purchases are usually in the form of final consumption as well. Businesses can sometimes play the role of a final consumer if the good or service is not directly included or transformed to create another good or service. For example, the bakery probably needs computers to keep track of inventory and manage accounts. The purchase of a computer and related items like software and maintenance would represent final goods in the period they were purchased.
Currently about two-thirds of the items in the U.S. GDP are purchased by individuals and households. These items are called personal consumption. Within those items that are personal consumption, currently about one-third are in the form of physical goods and about two-thirds are in the form of services. The fraction of personal consumption in the form of services has been increasing over time.
Government consumption represents about 20% of the GDP. This component of the GDP grew considerably as a percent of total GDP during the twentieth century, beginning in the 1930s during the Great Depression.
Approximately 12% of the GDP is final consumption by businesses and corporations. This usually takes the form of facilities and equipment needed to conduct business activities and is called gross private investment.
The final and smallest major component of GDP is net exports. This represents goods and services that are provided domestically, but consumed outside the country, or vice versa. This component may be positive or negative. The component is positive if the value of final goods and services provided domestically and consumed outside the United States exceeds the value of final goods and services provided outside the United States but consumed within the United States. Whether the amount is positive or negative is linked to whether the United States is a net exporter or net importer. While the United States was a net exporter for much of its history, during the last 50 years the country has been a net importer and the net export component of GDP has been negative. Thus, if you add the percents of GDP contributed by personal consumption, government expenditure, and gross private investment, the sum in recent years exceeds 100%, with the excess over 100% being a compensation for net imports.
Until about 20 years ago, the key measure of economy activity for the United States was a related measure called the gross national product, or GNP. The difference between GDP and GNP is in terms of the location and citizenship of the parties providing final goods. In the case of GNP, the measure is based on final goods provided by labor and productive assets owned by U.S. citizens, regardless of whether the production occurred on U.S. or foreign soil. The GDP is based on final goods provided by labor and productive assets located on U.S. soil, regardless of whether those assets are owned by U.S. citizens or not. The actual values of GDP and GNP are fairly equal. There has been greater emphasis on the GDP because it is consistent with the measures of economic activity used by other countries.
The Business Cycle
The U.S. GDP generally trends upward, due to increases in the population and in productivity. The rate of increase has varied, but has generally been in the 3 to 4% range in recent decades. When GDP is converted to real dollars and typical seasonal fluctuations are extracted, the graph of the deseasonalized, real GDP shows some oscillation about the general upward trend. This oscillation reflects the fact that the overall economy experiences periods of faster and slower growth (and sometimes even decline.) One common name for this oscillation is the business cycle.
When real GDP is in a phase of faster-than-average growth, the economy is said to be in an expansionary phase. When growth is slower than average, the economy is in a contracting phase. Often the real GDP will still increase during mild business cycle contractions because the long-term trend is positive. However, sometimes real GDP can actually decline.
When the real GDP declines in two successive quarters, the economy is commonly regarded as being in a recession. Officially, the designation of a recession in the U.S. economy is a determination made by a private organization called the National Bureau of Economic Research (NBER).2 Readers will note that several of the historical graphs in this text contain shaded bars. These bars correspond to periods the NBER has deemed to be recessions in the U.S. economy.
Leading Economic Index
Real GDP provides a useful barometer of the overall health of the economy and a means of observing the current state of the business cycle. However, since most businesses make production and marketing decisions well in advance of sales, they would like to be able to forecast the future movement of the business cycle to avoid overproduction or underproduction.
One tool for anticipating the near-term behavior of the business cycle is to look at other economic indicators that have a significant cyclic component, but tend to be in an expansionary phase of that cycle in advance of real GDP entering an expansionary phase of the business cycle, and likewise tend to enter a contracting phase prior to that occurring for the business cycle. Economic indicators that demonstrate this behavior are known as leading indicators.
No single leading indicator can anticipate the coming changes in the business cycle perfectly. Academic researchers have identified several good leading indicators through careful analysis of time series data that tests for correlation between the cyclic component of real GDP and that of potential leading indicators in preceding months. To improve the effectiveness of using leading indicators to anticipate changes in the business cycle, multiple leading indicators can be combined into a composite index. Currently, the most widely followed composite index is the Leading Economic Index prepared by a non-government organization, The Conference Board.3
The Leading Economic Index uses a collection of ten economic indicators that, as a group, has been highly effective in anticipating recessions over the last fifty years. Specifically, the composite index arrives at a “turning point” from expansion to contraction, or contraction to expansion, about three to six months in advance of the business cycle. The economic indicators used to create this composite index are listed below:
- Average weekly hours for workers, manufacturing
- Average weekly initial claims for unemployment insurance
- Manufacturers’ new orders, consumer goods and materials
- Index of supplier deliveries – vendor performance
- Manufacturers’ new orders, nondefense capital goods
- Building permits, new private housing units
- Stock prices, 500 common stocks
- Money supply, M2
- Interest rate spread, 10-year treasury note minus federal funds
- Index of consumer expectations
Each of these indicators is described later in this book, including why the indicator acts as a leading indicator.
To illustrate the notion of a leading indicator, consider building permits for new private housing units. When a developer or general contractor wants to initiate the construction of a new house or apartment building, he will need to acquire a building permit from the local municipality and then begin actual construction activity within a certain number of days. The permit is the first step in a sequence of activities that involve employing individuals, purchasing supplies, leasing and operating equipment, and enlisting services related to selling and occupying the residential building. All of these activities contribute to economic activity.
Although the Leading Economic Index is a respected and widely followed time series, it is paradoxically of limited importance in terms of impact on the stock market. This occurs because most of the economic indicators employed in the index have already been announced ahead of the announcement of the composite index, and investors have already factored their effects into their valuations.
While leading indicators are prized for their anticipation of the business cycle, there are other economic indicators that have cyclic behavior and correlate with changes in the business cycle. Some of these indicators tend to reach a turning point in their cycles about the same time as the business cycle. These are called coincident indicators. There are other indicators that reach turning points some months after the business cycle and are called lagging indicators. The Conference Board has developed composite indexes for each of these groups. These indexes are largely of interest to economists in confirming changes in the business cycle.
Retail and Food Services Sales
The U.S. Census Bureau (part of the Department of Commerce) compiles data to estimate the total dollar value of sales of goods and services from businesses that sell primarily to the public. While a portion of these sales are made to businesses or government units, the majority of these sales are made to consumers and therefore provide a good indication of changes in the consumer expenditure component of GDP. The amount reported excludes sales taxes, credit charges, and interest.
Retail and food services sales are reported monthly near the end of the second week of the month. An advanced retail sales report is provided for selected businesses in the second week of the first following month. A preliminary report on all retail sales is provided in the second following month. A revised report is released in the third following month. The reported totals are estimates determined from samples of selected businesses that report their sales for the month.4 Larger retailers may be included in the sample every month, while smaller retailers are included only periodically.
Retail and food services sales are reported on a nominal and real dollar basis, as well as with and without seasonal adjustment. The report is broken into major retail sectors: motor vehicles and parts, furniture and home furnishings, electronics and appliances, building and garden materials, food and beverage stores, health and personal care, gasoline, clothing, sporting goods/hobby/book/music, general merchandise and department stores, miscellaneous, and nonstore retailers (e.g., mail order). The report also includes estimates of food service sales (e.g., restaurant sales.) When this component is included, the total sales are called retail and food services sales.
Figure 3.2 shows a graph of retail and food services sales from 1992 to 2010. In chapter 2 we examined this time series in some detail, noting a fairly consistent growth trend over time, other than the recession that started in late 2007. These sales have a detectable seasonal pattern, with much higher sales in December and lower-than-average sales in the early part of the year and the initial months of fall.
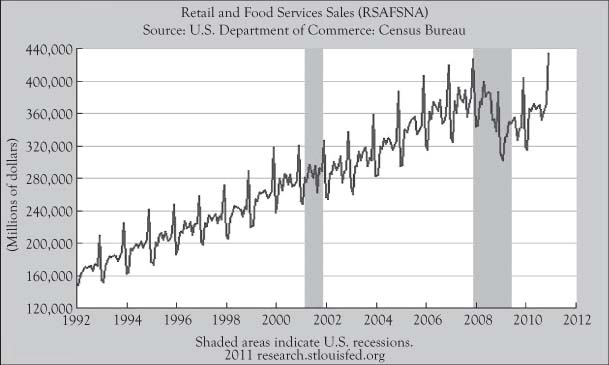
Figure 3.2. Monthly U.S. retail and food services sales from 1992 to 2010, in nominal dollars and without seasonal adjustment. (Source: Federal Reserve Bank of St. Louis, FRED Economic Data.)
Some components tend to fluctuate more than others. Motor vehicle sales are one example due to being expensive and somewhat discretionary. Because of this volatility, and since motor vehicles and parts are a sizeable component of retail sales, monthly reports usually report total retail sales excluding motor vehicle and part sales.
Likewise, food sales fluctuate considerably with random climate changes and gasoline sale revenues change considerably due to seasonality and the volatility of the crude oil market. The Census Bureau reports a general, appliance, furniture, and other (GAFO) sales total that excludes these volatile components to provide a more stable indicator of changes in retail sales.5
Over the last decade or so, e-commerce has become a substantial source of sales, growing from less than 1% to over 4%, and still increasing. The Census Bureau compiles a quarterly report on how much of the retail sales resulted from e-commerce.6
Motor Vehicle Sales
We noted that motor vehicle sales constitute a sizeable and volatile component of U.S. retail sales. Those who track economic indicators can obtain an earlier assessment of this component in the Motor Vehicle Sales report. This report is released monthly, during the first week of the month, based on data provided by automobile manufacturers.7
A key item of the report is the number of units of cars and light trucks sold in the prior month, including a seasonal adjustment. The report indicates how many unit sales were from domestic manufacturers and from foreign manufacturers.
Because these purchases constitute a large and somewhat discretionary element of consumer spending, an unexpected change in the number of motor vehicle sales can signal a change in consumer spending in general and eventually in overall economic activity. Although some motor vehicle purchases are a matter of immediate necessity, often the customer already has a car or truck that could function for a while longer if necessary. When household income becomes uncertain, those who can wait to replace their vehicle often will. However, in good economic times when incomes rise and are more stable, consumers may treat themselves to a new vehicle even before the existing vehicle is worn out.
During the 1990s and the first two-thirds of the 2000s, monthly unit sales (domestic plus foreign sources) remained fairly steady in the range of 14 to 18 million. However, with the recession, collapse of consumer credit, and jumps in the price of gasoline, unit sales have dropped dramatically and have been more volatile. Figure 3.3 shows the number of lightweight vehicles sold annually from 1976 to 2010.
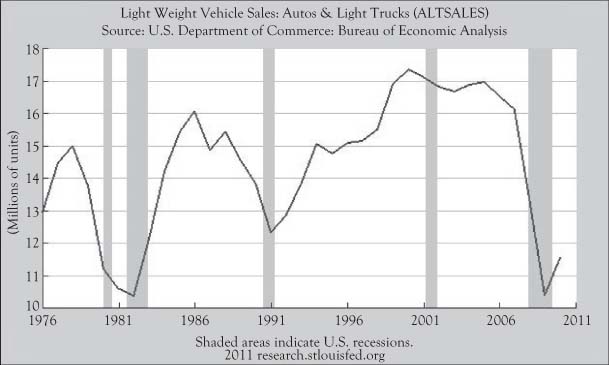
Figure 3.3. Annual U.S. light weight vehicle sales from 1976 to 2010. (Source: Federal Reserve Bank of St. Louis, FRED Economic Data.)
Industrial Production Index
While the GDP measures overall economic activity, it focuses on final goods and does not directly measure the level of activity in primary and intermediate industries. One measure that captures current activity for some primary and intermediate production is the Industrial Production Index (IPI). This indicator is a traditional index and stated relative to production in 2007, the current base year for the index. The reports are prepared monthly by the Federal Reserve, with a preliminary report near the middle of the following month and revisions to the index in the reports for subsequent months.8
The IPI does not focus on all industrial sectors, but does include manufacturing, mining, and electric and natural gas utilities. The IPI is a quantity index, so it endeavors to measure how much production activity occurs in these sectors, not the dollar value of that production. However, in order to integrate hundreds of disparate products into a single index, prices are used as weights to create a weighted composite index. The index is also seasonally adjusted.
Like GDP, the IPI has generally increased over time but has a significant cyclic component. In fact, during a downturn in the business cycle, the IPI can decline dramatically, as it has during the recession that began in late 2007. The IPI is a coincident indicator of GDP. Although the GDP and IPI tend to have coincident cycles, it is possible for the IPI to show a strong downturn without a significant downturn in GDP or a general economic recession because other sectors that are not in the IPI may not be experiencing downturns or manufacturing firms may be using up inventories. Figure 3.4 displays both the IPI and real GDP from 1970 to 2010.

Figure 3.4. U.S. industrial production index vs. real GDP from 1970 to 2010. (Source: Federal Reserve Bank of St. Louis, FRED Economic Data.)
Manufacturers’ Shipments, Inventories, and Orders
The Census Bureau surveys manufacturing firms about their activity in terms of goods shipped during a month and unfilled orders and inventories at the end of the month.9 The amounts are expressed in dollars. To qualify as an order, there must be either a contract or firm commitment by the purchaser. The estimates are adjusted for seasonal fluctuations, including the number of days each month that manufacturers operate.
An estimate of new orders is calculated by adding the unfilled orders at the end of the month and the shipments during the month, and then subtracting the unfilled orders at the end of the prior month. Estimates of new orders are of great interest because they are indications of the change in economic activity in the coming months. Among the ten components in the Leading Economic Index discussed earlier are two categories of new orders estimates, one for consumer goods and materials and one for nondefense capital goods.
The reports on these indicators, called the “M3 reports,” distinguish manufacturing activity for durable goods and nondurable goods.
A durable good is a good that does not get consumed or wear out quickly, such as an appliance. The formal definition is a good that lasts more than three years.
Two reports are issued for each month’s data. An advance report on durable goods is issued near the end of the following month. A full report is issued in the beginning of the second month following the month being described. The amounts are broken down by the type of product. Total amounts are also reported with defense-related and transportation-related items excluded.
ISM Report on Business
Another useful set of business activity indicators is provided by the nongovernmental Institute for Supply Management (ISM).10 The ISM conducts monthly surveys of purchasing and supply managers that pose nonquantitative questions about new orders, production, employment, supplier deliveries, and inventories. Separate reports are issued for manufacturing and nonmanufacturing businesses. The report for the manufacturing sector is released on the first business day of the next month and the report for the nonmanufacturing sector is released on the third business day of the next month.
Each survey item asks the respondent to compare an aspect of their operations that month to the prior month, and indicate whether the performance in the current month is better/higher, the same, or worse/lower. Based on the responses, a diffusion index is calculated by adding the percentage that reported a change in one direction (either better/higher or worse/lower, depending on the definition of the index), plus one-half of the percentage of respondents who said about the same. The percentages are adjusted for typical seasonal variation.
One of these diffusion indexes, the Index of Supplier Deliveries – Vendor Performance is a component of the Leading Economic Index. When this index of supplier deliveries is above 50%, supplier deliveries are slower, which indicates there is increased competition for commercial transportation services, and in turn indicates that overall business activity is picking up (which should be reflected in a few months as increased GDP).
The report combines the diffusion indexes for the individual elements to form a composite index of their activities. The composite index for the manufacturing sector is the PMI, the Production Manufacturing Index, and the composite index for the nonmanufacturing sector is the NMI, the Non-Manufacturing Index. The PMI is regarded as a useful leading indicator of corporate profits. In the past, when the PMI has dropped below 43, a recession has typically followed.
Philadelphia Fed Business Outlook Survey
The Federal Reserve Bank of Philadelphia conducts a monthly survey of manufacturing firms in their region to gauge their assessment of changes in overall business activity in the last month and the change they expect to see after six months.11 A report is released on the third Thursday of the month and summarizes the respondents’ assessments in the month of the report. In other words, the June report will report on comparisons of activity in June to activity in the preceding May and to the anticipated activity next December. Compared to other indicators, there is less time lag between the survey and the report, which increases the value of this survey.
Questions in the survey are similar to those used in diffusion indexes. Respondents are asked if general business activity, or aspects of their operations, increased, decreased, or there was no change. Unlike other diffusion indexes such as the ISM report, this diffusion index is calculated by subtracting the percent of respondents who said an item decreased from the percent who said an item increased. Thus, a positive index value suggests a consensus of increase in the item and a negative index value suggests a consensus of a decrease.
In addition to the question about changes in general business activity, respondents are asked to assess changes in new orders, shipments, unfilled orders, delivery times, prices paid, prices received, number of employees, average workweek, and capital expenditures. There are special questions that change from survey to survey. Although the survey is limited to firms in the Philadelphia region, this is a region of the United States with considerable manufacturing activity and represents a reasonable assessment of the state of manufacturing across the entire nation.
Consumer Confidence Index
Just as the ISM indexes utilize the subjective assessments of managers to gauge changes in business activity, there are indexes that assess the current and future state of business activity based on sampling consumers to assess present and future economic conditions. One such measure is the Consumer Confidence Index (CCI), which is prepared monthly by The Conference Board12 (the same organization that provides the Leading Economic Index). The CCI report is generally released the final Tuesday of the following month. The index is seasonally adjusted.
The survey is based on a random selection of U.S. households. Surveyed consumers are asked to assess the following:
- Business conditions now
- Business conditions six months from now
- Job prospects now
- Job prospects six months from now
- Household income for the next six months
The responses are classified as positive, neutral, or negative. A diffusion-like index is prepared for each response item by taking the percentage of positive respondents divided by the percentage of positive and negative respondents, and then multiplying by 100.
The CCI is a composite index obtained by averaging the index values calculated for the individual survey items. The resulting composite index is divided by the equivalent index in 1985 and multiplied by 100. Thus a value below 100 reflects lower consumer confidence than in 1985. The index has been well below 100 since the recession that began in 2007, even dropping below 40.
Consumer Sentiment Index
Another measure of economic activity based on consumer opinion is the Consumer Sentiment Index prepared jointly by Thomson Reuters and the Institute of Social Research at the University of Michigan.13 Like the Consumer Confidence Index, the results are based on surveys of randomly selected households and are reported monthly. A preliminary report is provided the second Friday of the following month, with a full report at the end of the following month.
The questions in the survey are somewhat different from the CCI, but address the same basic issues about the consumer’s attitude about the economy now and in the near future. The survey consists of five items:
- Whether the respondent believes her household is better off today than a year ago
- Whether the respondent believes her household will be better off a year from now than today
- Whether the next twelve months will be good or bad economic times
- Whether there will be continuous good times in the next five years or periods of unemployment
- Whether the respondent believes now is a good time to buy big ticket items
Each response is classified as positive, negative, or neutral. An index value is created for each of the five items by taking the percent of positive responses minus the percent of negative responses plus 100. The five item indexes are totaled, divided by the index total in 1966 (the base year), and multiplied by 100.
The Consumer Sentiment Index time series tends to follow a similar pattern to the Consumer Confidence Index, although the actual values differ substantially because the indexes use different base years. Even if the difference in base years is adjusted, the two indexes may behave slightly differently due to the differences in the surveys and sampling error.
Since both the Consumer Confidence Index and Consumer Sentiment Index ask consumers to look forward and assess the future economy, these measures are leading indicators. In fact, the Index of Consumer Expectations, a subindex of the Consumer Sentiment Index, is one of the ten components in the Leading Economic Index discussed earlier in this chapter.
Housing Starts and Permits
As noted in the section on the Leading Economic Index, the commencement of constructing a new residential building triggers considerable economic activity. The U.S. Census Bureau, jointly with the U.S. Department of Housing and Urban Development, reports monthly on the number of new housing units that started in a month and the number of new housing permits that are issued during a month.14 A preliminary report is usually issued during the third week of the following month and then reported again with revised values in the next month. Due to the highly seasonal nature of construction, the numbers are seasonally adjusted. The report breaks down housing units into single-family units, buildings with 2–4 units, and buildings with 5 or more units.
Both housing starts and permits for new housing are leading indicators for real GDP. The seasonally adjusted time series for permits is one of the ten components in the Leading Economic Index. Figure 3.5 displays the time series for housing starts from 1970 to 2010. Note that housing starts generally began declining several months before the economy was in a period of recession. Also note that the end of a period of recession often coincides with the beginning of a sustained increase in housing starts.

Figure 3.5. U.S. housing starts from 1970 to 2010, seasonally adjusted. (Source: Federal Reserve Bank of St. Louis, FRED Economic Data.)
However, the graph of the time series displays considerable jitter due to sizeable random fluctuations from factors like extreme weather. Consequently, as is good practice with interpreting recent values for any economic indicator, one should be careful not to conclude a change in direction of housing starts based on values for just a month or two.
Construction Spending
The U.S. Census Bureau also tracks spending on construction once a housing unit or other building is actively being built. The report is issued the first week of the second month following the month being reported and revised in later reports.15 Construction spending is grouped by private and public construction, as well as by residential and nonresidential spending.
Construction spending reflects an investment for a long period of time. Whether the construction is for a homebuyer, landlord, or private business, the decision to construct a building reflects confidence in the need for the facility and the ability to pay for it. As such, a dramatic increase or decrease in construction spending reflects a change in attitudes about the direction of the economy in future years.
When government entities either increase or decrease their construction spending, there is a significant multiplier effect on the economy. The phenomenon of a multiplier effect occurs when governmental payments for goods or services result in increased work and income for individuals. These individuals will use a portion of their income to acquire goods and services, which in turn results in additional income for other individuals, who continue the pattern of more employment and more spending. In the stimulus plan enacted by the Obama Administration in 2009, new public construction projects were a major component, based on the belief this spending would result in a significant multiplier effect that would boost the overall economy.