
Chapter 9
Indicators of Fiscal and Monetary Policy
Government officials and economists who guide macroeconomic policy monitor the same economic indicators as executives and managers in the private and nonprofit sectors. To understand the significance of any economic indicator report, one should not only assess what the reported indicator values say about the state and direction of the economy, but also gauge how those in charge of macroeconomic policy might respond. For example, a report that indicates an unexpected jump in the unemployment rate may lead the Federal Reserve to take action to lower interest rates.
There are two major types of macroeconomic policy: fiscal policy and monetary policy. Changes in these policies may be triggered by economic indicator reports, which in turn result in changes in the economy that will be reflected in future economic indicator values.
Fiscal policy is the collection of actions by government that direct the stream of revenues coming to the government and expenditures made by the government. These activities are usually planned in annual budgets. In the United States, budgets are prepared and monitored by the executive branch under the President, although Congress has approval authority over budgets. Budgets are not necessarily balanced, even in the planning stages, meaning that the expenditures during a year may not be offset by revenues. When expenditures exceed revenues, there is a budget deficit. The shortfall in revenues during a budget deficit must be covered by either past savings or borrowing. When revenues exceed expenditures, there is a budget surplus. The excess revenues can either be set aside as savings or used to pay down past debt.
When the government runs a deficit, the reaction is largely stimulative in the sense that the government is acting in the role of a net purchaser and putting more money in the hands of individuals and businesses that they can spend. When the government runs a surplus, there is a suppressive effect because the government is taking more away from individuals and businesses and not spending all of it.
For many years, the U.S. federal government has borrowed money as a means of covering deficits. When deficit spending continues over successive years, there is no surplus to repay these loans when they come due, and these loans can only be repaid by taking out additional loans. The accumulation of amounts owed by the government at any given time is the national debt. In the case of the United States, this national debt has grown dramatically and is one of the long-term economic challenges that we will discuss in this chapter.
Monetary policy is related to the supply of money in the economy and the ease with which individuals and businesses can borrow. Money is a lubricant in economic transactions, so when money is in ready supply or easy to borrow, there is a stimulating effect. In the United States, monetary policy is largely entrusted to the Federal Reserve System.
The Federal Reserve was created in 1913 to stabilize the financial system of the United States and act as a central bank. The nation had experienced periodic financial panics that, although fairly short in duration, overwhelmed banks as their worried creditors demanded deposits. This mission was expanded in the 1930s following the collapse of the financial system starting in the late 1920s, when the Federal Reserve was assigned to regulate banks against reckless conduct. In the 1970s, the mission was further expanded to conduct monetary policy to achieve “maximum employment, stable prices, and moderate long-term interest rates.”1
The Federal Reserve has multiple tools that can influence money supply and the cost of borrowing. The Federal Reserve is authorized to set the reserve requirements of banks, which is the percentage of deposits that the bank is required to have on hand overnight rather than out in circulation as loans. Banks often meet their reserve requirements by borrowing from other banks or the Federal Reserve, and the Federal Reserve largely controls the interest rate on those overnight loans. The Federal Reserve is also a major creditor to the U.S. Government as the owner of Treasury bills, notes, and bonds. The Federal Reserve can either buy or sell these debt instruments, and due to its strong presence in these bond markets, is able to drive interest rates higher or lower.
As noted above, the officials charged with managing fiscal and monetary policy and their advisors consult economic indicators of economic activity, income and expenditure, price levels, interest rates, resource utilization, and international exchange. However, there are some additional indicators designed to monitor the conduct of macroeconomic policy. A few of these indicators are discussed in this chapter.
Budget Surplus/Deficit
Most governments budget operations on an annual basis. Although state and local governments have a sizeable impact on local and regional economies, since the 1930s the federal government has been the dominant public economic influence for most Americans and American businesses. The federal government is unique in being able to operate – and intending to operate – at a deficit or surplus, while state and local governments are generally expected to operate with a balanced budget. Consequently, the federal government plays the dominant role in U.S. fiscal policy.
For much of its early history, the federal government ran balanced budgets. The main exceptions occurred in times of war, when the government borrowed money by issuing war bonds and then paying them off in the years following. A major change came in the 1930s, when in response to the Great Depression the administration of Franklin Delano Roosevelt undertook an ambitious program of public projects to deal with the massive underemployment rate of nearly 25%, even higher in the cities. The success of this program was not only in reducing the ranks of the unemployed, but stimulating other sectors of the economy because those hired by the federal projects had more money to spend, thus generating more activity in the private sector, and gradually encouraging more private investment. The economic recovery act in 2009 is a recent instance of attempting to stimulate the economy through increased public expenditure.
The role of deficit spending in stimulating the economy was analyzed in the famous text by John Maynard Keynes, The General Theory of Employment, Interest, and Money.2 In this text, Keynes introduced the concept of a fiscal multiplier as the amount of economic activity generated by a dollar of government expenditure. Keynes advocated that governments should run deficits when the economy contracts to diminish the severity, while running surpluses in times of expansion to offset the deficits in other years, limit inflation, and prevent the economy from setting itself up for a larger contraction. This philosophy dominated macroeconomic policy for the next 40 years, until the limits of this policy were realized in the 1970s when both high unemployment and high inflation occurred at the same time.
Prior to Keynes’ text, the prevailing view among economists was that market dynamics would eventually address problems in the economy without strong government intervention. This school of thought, now known as classical economics, recognized that short-term imbalances may result from time to time, but in the long-run the supply of productive resources (land, labor, and capital) and the demand for productive resources would come into balance. After the failure of Keynesian-based policy to address the problems of the 1970s, a new school of economic thought emerged that returned to these classical foundations in explaining the limitations of Keynesian fiscal policy in controlling the economy. As we cited in chapter 1, the actions of private parties in anticipation of future government policy measures can distort the desired effect of those measures.
In the 1980s, and again in the 2000s, the United States instituted a variant of fiscal policy based on reducing taxes, rather than increasing expenditures. This idea, called supply-side economics, presumed that reductions in income taxes would stimulate more consumption and more investment. This policy incurs deficits, at least in the short term, because taxes are the main source of revenue to the federal government. The intended result of the policy is that increased consumption and investment will follow, resulting in increased tax revenues and budget surpluses.
The budget for the federal government operates on a fiscal year from October to September. The budget is proposed by the executive branch and prepared by the Office of Management and Budget in February. The budget is supported by the Economic Report by the President,3 which is prepared by the President’s Council of Economic Advisors, in which the state of the economy is reviewed and the case is made for the budget. Congress receives, reviews, and approves the budget for the next fiscal year, with assistance from the Congressional Budget Office. The President can sign or veto the budget.
The initial budget and budget negotiations provide a useful indicator of what is likely to follow in the general economy. If the government intends to run a greater deficit, there is an expectation of economic activity, particularly in those sectors targeted with expenditure increases or tax decreases. Similarly, if the deficit is reduced, as it was in the 1990s when defense expenditures were reduced and taxes were increased, these measures signal reduced spending by those affected by tax increases or those sectors that will be receiving less consumption by the government.
It is worth noting the planned budget deficit or surplus is not determined strictly on the basis of Keynesian analysis of the appropriate response to the nation’s position in its economic cycle. Although proposals for increased deficits may be justified by the logic of Keynesian stimulus, as was the case in the American Recovery and Investment Act of 2009, deficits often occur because Congress and the President are unwilling to reduce the amounts previously allocated to federal programs. Thus, U.S. fiscal policy is as much (or more) a consequence of legislative compromise as it is a designed program of government income and spending based on economic reasoning.
The Department of the Treasury manages the receipts and outlays to and from the federal government. If a budget deficit is planned, this department will need to borrow money in form of bills, notes, and bonds to make up the difference. If a budget surplus is planned, borrowing activity will be reduced, although some borrowing will continue to take care of maturing debt and handle temporary excesses in expenditures over receipts. The expectation of changes in the borrowing practices of the Treasury Department will indicate upward or downward pressure on interest rates.
Realized Surplus/Deficit
The adopted budget indicates the intended surplus or deficit, but the actual surplus or deficit will vary. Items like unexpected military expenditures and expenses from responding to large natural disasters can exceed the allotments in the original budget. Other items like unexpectedly high tax revenues or lower interest on public debt can create a surplus or reduce the expected deficit.
The Financial Management Service of the Treasury Department issues a Monthly Treasury Statement on the eighth business day of each month to report on actual receipts and outlays for the previous month.4 The summary of the report indicates total receipts and total outlays for the month and fiscal year to date. These are compared to the total amount budgeted for the year and up to that month in the fiscal year. The report also breaks down receipts and outlays by federal department or agency, and even by type of receipt or outlay within agencies.
A number of public agencies, such as the Social Security Administration and the Postal Service, are regarded as “off-budget” even though there are transactions between these agencies and other “on-budget” agencies. These “off-budget” receipts and outlays are detailed in the Monthly Treasury Statement, but grouped separately in the summary values.
Figure 9.1 shows the annual federal surplus or deficit from 1970 through 2010. As described in the previous section, deficits have grown over this period, with a temporary reversal in the 1990s from the peace dividend and income tax increases.
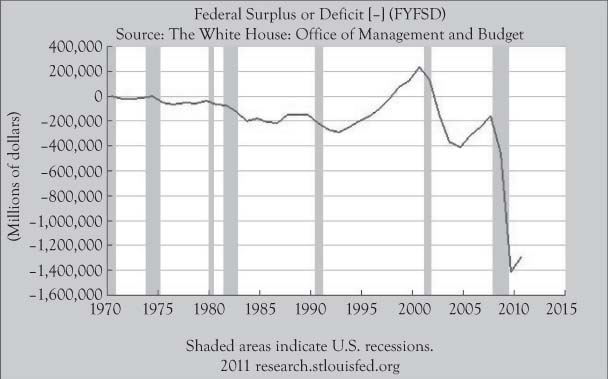
Figure 9.1. Annual federal surplus or defi cit from 1970 to 2010. (Source: Federal Reserve Bank of St. Louis, FRED Economic Data.)
The Monthly Treasury Statement is of interest to watchdog groups that monitor government activity. However, this report also provides a glimpse as to whether the deficit (or surplus) will be better or worse than expected.
Tax Policy
The main source of revenue for the federal government is taxes. The largest source of tax revenue is personal income taxes. The second largest source is taxes on corporate profits, although this amount is substantially less than the revenue from personal income taxes. The third largest source is from federal excise taxes on items like cigarettes. Other revenues come from estate taxes, gift taxes, and customs duties.
Fiscal policy based on Keynesian theory supports the reduction of taxes and the increase of public expenditure to offset economic contractions, because it leaves individuals and businesses with more money to spend, which can stimulate the economy through the multiplier effect. Unfortunately, it is easier for political leaders to embrace this portion of Keynesian theory than the prescription to raise taxes or reduce expenditures when the economy regains upward momentum. As a consequence, the United States has largely run deficits most of the last 50 years, even though the economy was growing most of those years.
Deficits can be reduced by increasing taxes or reducing outlays. However, some outlays cannot be reduced and other reductions would need to be phased in. Still other outlays are targeted to specific sectors of the economy and their reduction would be borne unevenly. In comparison, changes in current tax rates tend to be both more immediate and affect the general economy directly. Modifications to tax laws are a useful indicator of a shift in fiscal policy that will have a prompt impact on economic activity.
Additionally, due to deductibility of some expenses from taxable income, the taxpayer will assess the cost of those tax-deductible items on an after-tax basis:
after-tax cost=cost·(1-marginal tax rate)
If a taxpayer has a marginal federal income tax rate of 28%, a deductible expense of $1000 will be regarded by the taxpayer to be $720, net of tax savings. Interest received or paid by a taxpayer will similarly appear to be at a lower rate if the interest income is taxable or the interest expense is deductible. As a consequence, the tax provisions regarding deductibility of expenses and taxability of income become an element of fiscal policy.
Social Insurance Programs
Social security is the largest off-budget federal program, which is funded by an insurance-like arrangement. Social security tax revenue is actually considerably higher than corporate income tax revenue, although social security tax revenue is to be applied against social security outlays or invested in federal debt as a method of saving for future payments. However, the program design does not assure that promised social security payments will always be covered by social security tax revenues or reserves. Currently, net social security reserves are only growing due to interest earned on those reserves. By the 2030s, the system is projected to have insufficient reserves to make the full promised payments, when the federal government will need to make up the difference or change the payment levels.
Medicare revenue to the federal government is also substantial. Unlike Social Security, Medicare is set up on a pay-as-you-go system where current workers pay the benefits to current seniors. Although a trust fund was built from excess payroll revenues for Medicare in the early years of the program, the program is currently running at a deficit. With the demographic effects of the baby boomer retirements, this system is projected to exhaust its trust funds within 10–20 years.
These programs will have major deficits and debt levels in the decades to come. Under projections by the Congressional Budget Office, outlays for Social Security and federal health care programs like Medicare are currently 10% of the GDP and will grow to 16% of the GDP in the next 25 years.5 Changes in either the taxation of income to support these programs or promised payoffs will be a key indicator of the future environment for fiscal policy.
Public Debt
The consequence of decades of federal deficits is the accumulation of an enormous public debt. In 2011, the total debt of U.S. government exceeded 14 trillion dollars. About 30% of this debt consists of loans from other federal agencies, most notably the Social Security trust fund, but approximately 70% comes from private creditors, both domestic and foreign.
The borrowing activity in the United States is managed by the Bureau of Public Debt in the U.S. Department of the Treasury. The bureau provides a daily update on the amount of public debt on its website,6 showing the amount of debt from borrowing outside the government and borrowing from other federal agencies. End-of-period levels of public debt for recent months and years appear in the quarterly Treasury Bulletin.7
Due to inflation and the growth of the economy in terms of population and productivity, it is not unreasonable for the amount of public debt to have increased. However, when viewed in relation to annual GDP in the same year, the amount of public debt has increased from less than 40% of annual GDP in 1965 to nearly equal to annual GDP in 2011. On average, public debt has grown at an annual rate about 2% higher than the annual rate of growth in GDP. The growth in public debt was particularly high in the 1980s and 2000s, when the United States cut tax rates and increased defense spending. Figure 9.2 shows the growth in total public debt from 1970 to 2010.

Figure 9.2. Total U.S. public debt from 1970 to 2010. (Source: Federal Reserve Bank of St. Louis, FRED Economic Data.)
The increased debt relative to GDP strains the flexibility of both fiscal policy and monetary policy to keep the economy out of recession. The outlay for net interest on federal government debt has grown to over 6% of the budget, despite interest rates that are at 50-year lows. A further increase in debt or an increase in interest rates would make this net interest outlay percent even higher, requiring either more borrowing or austere fiscal discipline in the form of significantly higher taxes and significantly lower government services. The U.S. public is concerned about the burden of public debt on future generations and their elected legislators are resisting authorizing more debt. Holders of U.S. debt, especially foreign creditors, will be increasingly uneasy with the ability of the United States to cover its interest payments and repay principal on maturity, putting further upward pressure on borrowing costs.
FOMC Directives
The main tool used by the Federal Reserve in implementing monetary policy is the purchase and sales of Treasury securities. The Federal Reserve issues instructions to the Federal Reserve Bank of New York to act as its agent in these transactions. These decisions are made by a committee consisting of the Federal Reserve Board of Governors and four presidents from the twelve regional banks in the Federal Reserve System, known as the Federal Open Market Committee (FOMC.) This group schedules eight regular meetings a year, with additional meetings if necessary.
If the Federal Reserve buys Treasury securities, they increase the demand from buyers of the debt, resulting in downward pressure on interest rates. When the transactions are completed, the cash to the seller of the securities is more money in the hands of the public. Further, often the proceeds of these purchases by the Federal Reserve remain as bank deposits of major banks that are able to use those to help meet their reserve requirements and have more money to lend. Thus, purchase operations are stimulative.
When the Federal Reserve sells Treasury debt it owns, the effect is the reverse. Increased seller supply pushes bond prices down and interest rates up. The outside parties that buy the securities from the Federal Reserve need to give up use of their funds, which forces banks that hold the deposits of these buyers to make up their overnight reserves from other sources.
The FOMC reviews the current economic situation and decides on a strategy to either buy or sell a certain amount of debt or do so with a goal in terms of interest rates. The usual interest rate goal is a target, or target range, for the federal funds rate discussed in chapter 6.
The FOMC decision is released in a public statement at the conclusion of the meeting.8 Minutes of the FOMC are provided to the public about three weeks after the meeting. The minutes can provide more insight into the reasoning behind the decision and what the committee may be watching or inclined to do in the upcoming meetings. The report also includes an addendum that provides projections of changes in real GDP, unemployment rate, PCE inflation, and core PCE inflation in the current year, the next two years, and beyond. These projections are based on forecasts by the members of the Federal Reserve Board and the presidents of the 12 Federal Reserve Banks.
Money Supply
The supply of “money” is considerably more than the amount of currency in circulation in the form of paper bills (Federal Reserve notes) and coins. For example, if someone deposits cash in a checking account, the bank can loan that cash out to someone else, but the original depositor believes he has the funds on account to spend. Consequently, the money supply is really the amount private parties believe they have on hand to spend, rather than the physical currency in their possession.
Money supply is not fully under the control of the Federal Reserve or U.S. Treasury. Money supply is determined by individual saving habits, business activity, and bank behavior. Even hard currency, though printed by the Treasury and distributed by the Federal Reserve, enters the economy when currency is requested by banks according to their operational needs, and is returned to the Federal Reserve and taken out of circulation when banks have more currency than needed. However, these activities by individuals, businesses, and banks are influenced by the Federal Reserve in its open market operations and setting of bank reserve requirements.
There are actually multiple measures of money supply, which are reported weekly by the Federal Reserve.9 A narrower measure, called M1, includes currency in circulation (not in vaults of the Federal Reserve or its depository members) and demand deposits like checking accounts. A broader measure, called M2, includes M1, as well as savings deposits, money market balances for individuals, and small time deposits like bank certificates of deposit. The money supply levels are reported with and without seasonal adjustments. Figure 9.3 shows the seasonally adjusted M1 and M2 stocks from 1985 to 2010. Note that M2 levels during this time period were considerably higher than M1 levels and grew at a faster rate.
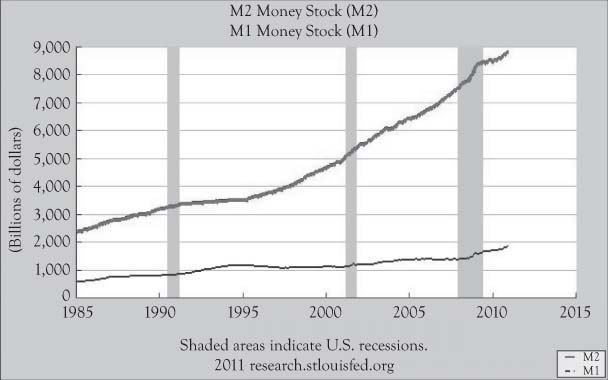
Figure 9.3. M1 and M2 money stocks, seasonally adjusted, from 1985 to 2010. The higher, thicker line is the M2 stock level. (Source: Federal Reserve Bank of St. Louis, FRED Economic Data.)
The Federal Reserve had previously reported another measure of money supply called M3, which included M2, along with large time deposits, institutional money market balances, and other liquid assets held by institutions. The Federal Reserve decided M3 was not providing much information for purposes of guiding monetary policy.
There is a theory in economics, called the quantity theory of money, which postulates that price levels are linked to the supply of money.10 This theory was dismissed by Keynesian macroeconomists. However, following the limitations of Keynesian fiscal policy in dealing with joint high unemployment and high inflation in the 1970s, money supply regained attention as a key contributing factor in inflation. Nobel laureate Milton Friedman was a strong proponent of this view even prior to the 1970s and claimed that inflation would not be a problem if the growth in money supply were linked to the growth in the GDP.11
Currently the Federal Reserve sets targets in terms of the federal funds rate rather than money supply. However, money supply is still a useful indicator of the effectiveness of monetary policy and future actions by the FOMC.
The Beige Book
Prior to each of the eight scheduled FOMC meetings, the Federal Reserve Bank in Boston prepares a report, known as the Beige Book, that summarizes economic conditions in each of the twelve Federal Reserve Districts.12 The report assesses the strength of consumer demand, employment conditions, developments in the major business sectors, and the status of credit and borrowing in that district. The content is largely anecdotal observations gathered from conversations with business leaders and economists, rather than the product of rigorous data collection and statistical analysis.
The Beige Book is reviewed carefully by the FOMC committee prior to its meeting. The report is available to the public about two weeks prior to the FOMC meeting, giving investors an advance look at the environment as seen by the FOMC and likely action by the committee. In addition, the report is of interest to others who would like a verbal briefing on recent changes in economic conditions in different regions of the nation.
Bank Lending Practices
Banks and other lending organizations play a key role in the effectiveness of monetary policy. These institutions are the intermediaries between the Federal Reserve and the rest of the economy. The success of the goals of the Federal Reserve in influencing interest rates and stimulating economic activity depends on the banks and other lenders adjusting the interest rates they charge accordingly and their willingness to extend credit to households and businesses.
To gauge the current trends with banks, the Federal Reserve conducts a quarterly survey of senior loan officers of domestic banks and U.S. branches of foreign banks.13 The results of the survey inform the FOMC committee in its deliberations.
The sample lending officers are asked a number of questions related to terms and qualification criteria for loans and strength of customer demand. The questions are asked for different types of loans, including loans to large businesses, small businesses, and households, as well as for commercial real estate, home mortgages, auto loans, and credit cards. Questions are similar to those used in preparing a diffusion index, where the respondent is asked whether some aspect of a particular type of loan strengthened or tightened considerably, strengthened or tightened moderately, is about the same, weakened or eased moderately, or weakened or eased considerably. The collective responses to any item are summarized by subtracting the percentage who reported the item weakened or eased from the percentage who reported the item strengthened or tightened.
Figure 9.4 shows the net percentage reporting that standards for commercial and industrial loans for large and medium size firms tightened over the past three months, for quarters in 1990 through 2010. Note that the standards usually tighten during recessions, when there is greater risk of default by borrowers due to the weak economy.

Figure 9.4. Net percentage of domestic respondents to Federal Reserve senior loan offi cer survey who reported tightened loan standards for large and medium industrial and commercial fi rms, quarterly and not seasonally adjusted, from 1990 to 2010. (Source: Federal Reserve Bank of St. Louis, FRED Economic Data.)