
Chapter 2
What Is Conversion Optimization?
“Would you tell me, please, which way I ought to go from here?” said Alice.
“That depends a good deal on where you want to get to,” said the Cat.
—Alice in Wonderland
In Chapter 1: “Why You Should Test That,” you saw how optimization can improve conversion rates. But there’s even more to be gained from conversion optimization than just conversion-rate lift. When I say just, I don’t mean to minimize the impact this has on the business, of course. I mean that the immediate conversion-rate lift is the starting point.
The results from conversion testing often generate learning that can impact the overall marketing strategy and even business strategy. It’s like a gift that keeps on giving!
This chapter explores why controlled testing, above all other website-improvement methods, is required for conversion optimization. It also discusses target audience concepts and goal-setting methods. Finally, I introduce the seven-step testing method that you can use to get continuously improving conversion rates.
Conversion Optimization Requires Controlled Testing
Since the evolution of the modern scientific method began in the seventeenth century, the world has steadily become a better place in which to live. All advancements in modern society have been a result of this method. Scientists have made discoveries that have increased our life expectancies by decades, minimized infant mortality, developed fast and efficient global communications and travel, and increased worker productivity.
Yet many marketers still resist using the scientific method to advance our craft. Some probably enjoy the comfort in knowing that their work isn’t tested so their opinions can’t be disproven. Or they just trust their intuition and gut feeling to guide them in the right direction, much as the bloodletting physicians and alchemists did in prescientific eras.
Fortunately, we’re no longer in the sixteenth century. The barriers to scientific marketing have largely been removed today. With more and more of our lives and transactions happening online, the difficulty and cost of quantitative testing in controlled environments has dropped dramatically. The golden age of marketing testing and learning is just beginning!
The Scientific Method of Controlled Testing
I want to make a clear distinction here between what many people consider testing and the controlled testing used in the scientific method. I’ve met many people who believe they’re testing but have never run a true controlled test.
Test Against a Valid Control
Controlled testing requires structuring the experiment with a valid control that is run concurrently with the challenger variations. The control group is the segment of the experiment population that sees the original, unaltered web page that you’re testing to improve.
In a controlled website test, the challenger variations are tested against the control, and all other factors are kept constant as carefully as possible to make sure the test results aren’t polluted. This is often called the champion-challenger approach and is a cornerstone concept of direct-response marketing.
The following diagram outlines the controlled testing process. In an A/B/n test, sometimes called a split test, you assign each of your experiment visitors to see one of several challenger variations, numbered from A to n, where n represents any number of test variations.
Controlled A/B/n testing
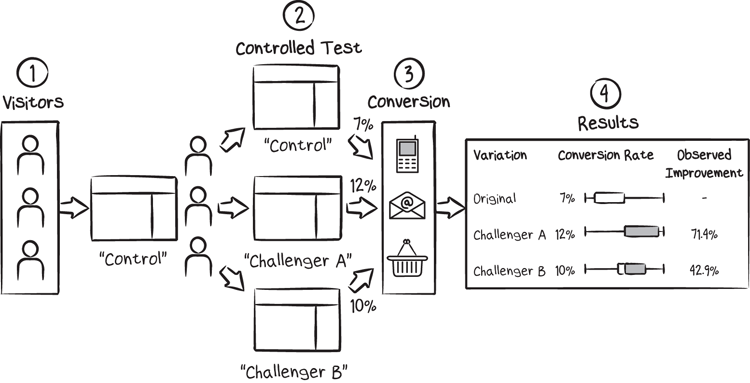
Data is collected until statistical significance is achieved and you have found a new champion, which can then replace the old page to become the new control for the next test round.
Selecting a Sample (Not a Free One, a Statistical One)
In scientific terms, an experiment sample is a portion of the entire universe that you want to test. Because you can’t test every potential customer, you’ll select a sample that represents the entire audience. Your experiment sample in this case is a portion of your website visitors.
Select a representative sample of your visitors.
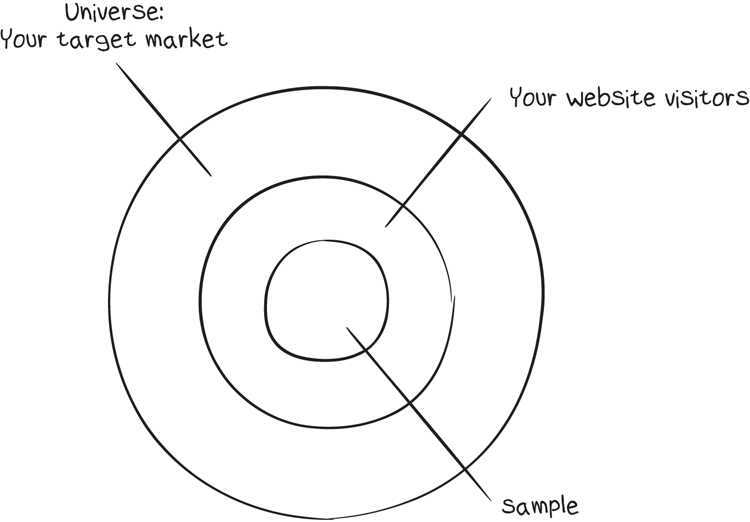
The visitors to each test page must be selected from the sample group to get meaningful test results. Your test audience should be homogeneous, meaning that each variation should receive the same type of visitors or mix of visitor types. If you test by choosing the visitors for each variation from different traffic sources, your results won’t be useful.
This is a problem many web marketers encounter when they try to run a test manually without a proper controlled testing tool. I’ve seen many examples of marketers using different paid search ads, ad groups, or even traffic sources to drive visitors to variation pages to run a test. Google AdWords, for example, shouldn’t be used to run conversion-optimization tests, because it doesn’t properly track experiment participants and goal conversions to unique visitors. You’ll get skewed data that is likely to mislead you.
You can get a valid sample by using a tool designed for controlled website testing and making sure to run the experiment long enough to achieve statistical significance.
Using a Tool Designed for Controlled Testing
Selecting valid samples isn’t the only advantage of a conversion-optimization tool; this type of software also has all the other features built in so you can run controlled A/B/n and multivariate tests on your website. Each testing tool takes a slightly different approach to how tests are set up, managed, and run, but they all have similar characteristics. All testing tools do the following:
- Split incoming traffic randomly (and approximately evenly) between the variations.
- Set cookies or a similar control mechanism to ensure that each visitor in the experiment sees the same variation each time they return to the test page.
- Track the goal conversion rate(s) for each variation page (or combination of variables in the case of multivariate testing).
- Provide reports showing the conversion rates for each variation.
- Show the statistical significance of test results so you know if and when a test is complete and a winning page can be declared.
As shown in the flowchart, there is a typical series of server interactions for common JavaScript-based testing tools.
Typical testing tool dynamic content delivery flow

The process looks like this:
See the appendix “Additional Resources” for an intro to many of the common testing tools you can choose from.
“Best Practices” Are Not Conversion Optimization
As conversion optimization has become more popular, many people have confused it with best-practice consulting. Be sure you don’t make the same mistake.
Web design experts at one time or another have given all of the following best practices tips:
- Green buttons work best… (they don’t)
- Red buttons work best… (nope)
- No, use orange buttons… (not always)
- Minimize form fields… (depends on the situation)
- Minimize clicks to conversion… (not necessarily)
- Emphasize security icons… (bad idea)
- Security icons raise anxiety… (sometimes)
- Sex sells… (usually not, unless you’re selling sex)
- Always include a smiling person... (uh uh)
- Never include people… (test this)
- Use long copy landing pages… (in some cases)
- Minimize your copy length… (in many cases)
- Lead with benefits… (not always)
- Lead with features… (sometimes)
And so on. (You get the picture, right?) Many recommendations from the experts have proven to be untested.
For example, some conversion consultants recommend making your security badges (like McAfee or HackerSafe) as prominent as possible. After all, “you’re paying for them, so you might as well make them obvious,” they’ll tell you.
How do you know if that’s good advice? Well, we’ve tested it. In some cases, adding security icons helps, but we’ve actually seen that making them too prominent or introducing them too early in the purchase flow can reduce conversion rates and sales! That’s a conclusion you might not be able to guess without testing it.
The only best practice I can recommend is this: when you hear a best-practice recommendation, say, “You Should Test That!” You may be surprised.
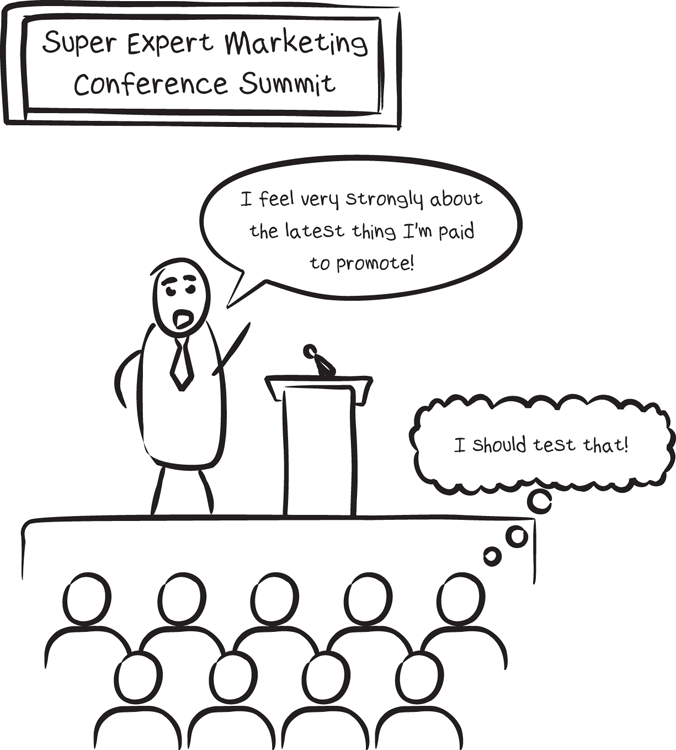
The discipline of testing and validating hypotheses is very different than taking the opinions of “experts” as fact. Don’t take experts’ opinions without testing for yourself! What an expert “feels strongly about” may just be the latest thing they’re paid to promote.
Another problem with expert recommendations is that they can’t take into account all the complexities of any particular situation. You’re facing a unique set of environmental variables. A consultant may have seen similar situations and be able to make some helpful suggestions that could lead to great test hypotheses. But without testing those suggestions in your particular situation, you shouldn’t be confident about taking the consultant’s word for it.
That’s not to say that bringing in a consultant or conversion expert won’t be helpful. It often will! But you should look for consultants who do a lot of testing and then make sure they’re willing to follow through on executing the tests to take responsibility for the outcome.
The Before & After Method Is Not Conversion Optimization
At WiderFunnel, we have had marketers call us looking to improve their conversion rates who tell us that they already do conversion testing.
Too often, it turns out they’re using the Before & After (or Pre & Post) method rather than controlled split testing. They make changes to their website or landing pages and then look at their web analytics data to see if their results improved from a prior time period. If the conversion rate or revenue increased, they attribute it to the change they made and consider it a success. If results drop, they revert back to the original and call it a failure.
This is a dangerous practice. It ignores so many uncontrollable, external influences and statistical uncertainties as to make the result entirely meaningless. That’s right—I said meaningless!
Let’s look at a typical example of how this works. You’re looking at your analytics reports for an important page on your site; maybe it’s a high-traffic landing page or a product category page. You notice that it has all the signs of a poorly performing page: high exit rate, high bounce rate, low conversion rate for entry visitors, and so on. It looks like a great candidate for conversion optimization. So you gather your team together and come up with ideas for improving it, or hire a consultant for a page critique and redesign it based on the consultant’s input.
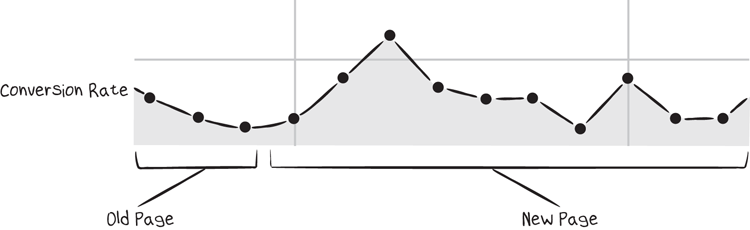
You launch the newly designed page and use the Pre & Post method to evaluate the results. After a few weeks of data gathering, your analytics results look like this:
Before & After assumed success paints a pretty picture.
Clearly, your conversion rate with the old page was low and declining, and your new page has turned the conversion rate upward almost immediately. Pop the champagne corks!
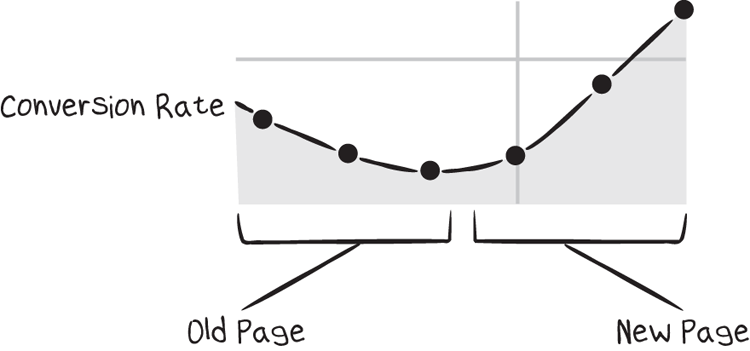
Not so fast! The long-term story may be very different. Here’s what the following weeks of data could look like.
Before & After real results tell a different story!
External Factors Mess with Your Data
In WiderFunnel’s experience, external factors often wreak havoc with Before & After tests. If you don’t control for all other variables, it isn’t a valid test. Any of the following external factors may change your conversion rate in either the positive or negative direction without your knowledge, and invalidate the results of Pre & Post tests.
Competitive Activity
Your competitors are always active. They’re changing tactics and strategies, adding new products, testing offers, and running marketing campaigns.
Do you know when their email marketing blasts are released? Do you know their promotional schedule for discount offers? Of course you don’t. And their activities can have a significant influence on your conversion rate.
For example, let’s say you run a cruise vacation website featuring Alaskan cruises. You offer up to 60 percent savings, which you mention in all of your main traffic-generating Google AdWords ads.

You recently changed your landing page design and are monitoring the results using the Pre & Post method. You’re carefully watching your booking conversion rate in your web analytics tool to see the impact the new design makes. Little do you know, though, that a few days after you switched to the new test landing-page design, two competitors changed their ads to promise savings that are much more compelling than yours.
Your competitive environment impacts your conversion rate.
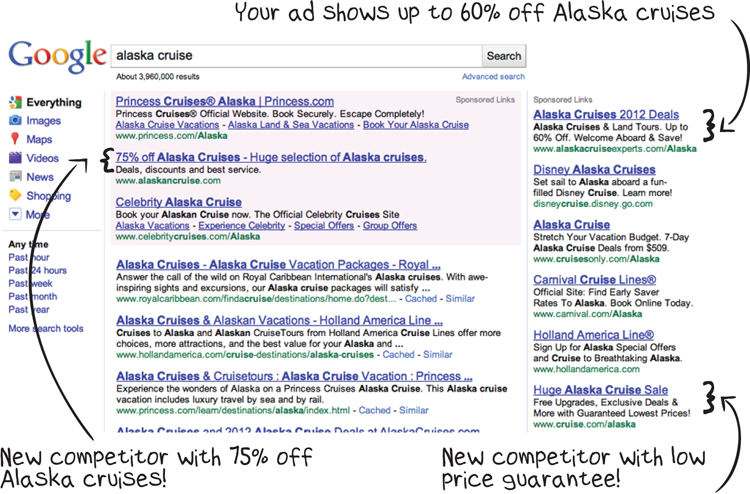
Your competitive environment has changed, and your landing-page conversion rate may be impacted one way or another regardless of the changes you made to your landing page.
Seasonality
Be aware of any predictable fluctuations like these:
- Does your business have any seasonality to your customers’ demand level?
- Are there fluctuations in conversion rate on different days of the week?
- Is there any change during cold or warm months?
- What about during popular vacation weeks?
If you observe any seasonality in your businesses, you can be sure that the results of a Pre & Post test will be misleading. Even if you don’t operate in a highly seasonal business, fluctuations in demand and perceived urgency will render a Pre & Post test worthless.
Marketing Activity
Can you keep your marketing silent for several weeks while you try to run a Pre & Post test? Most companies would find this requirement too restrictive. It would leave you unable to respond to competitive activities or limit your testing ability to only small windows in between marketing efforts.
Not only that, if you can’t run tests during marketing promotions, you have no way of knowing which experiment variation performs best during promotional periods. In some cases, different layouts and content perform better during higher-urgency periods.
On the other hand, if you use proper controlled testing, you can run experiments at any time, regardless of the current marketing activity. See Chapter 10, “Optimize for Urgency,” to learn more about how urgency affects experiment results.
Product and Service Availability
In a product business, stock levels can influence conversion rate. Limited supply creates a scarcity reaction that motivates people to buy due to fear of loss. As you’ll see in Chapter 10, the fear of loss can be a very powerful motivator. Make sure you’re using it in your favor rather than being an inadvertent victim of it. During a Pre & Post test, fluctuations in stock levels affect your conversion rates continually.
At any time, a positive or negative comment could be said in person, on a blog, or in social media that will influence your conversion rate. You can’t always control it or factor it into your Pre & Post test because you may not even know about it!
Consumers trust friends.

Have you considered how these factors are affecting your conversion rates on a weekly, daily, and even hourly basis? You may be surprised how much of an influence they can be.
The only thing worse than not testing is getting misleading results from your tests. Too many companies using Pre & Post testing have acted on this false data and are harming their business results.
Usability Testing Is Not Conversion Optimization
Nearly as bad as best-practice consulting or using the Pre & Post method is to put too much trust in individual user testing. Sometimes companies aren’t testing on their live website traffic at all but still believe they’re testing!
I define user testing as an exercise where you observe a small group or a single user attempting to accomplish a predefined task on your website. User testing can be an important method for generating hypotheses; but used alone, it isn’t conversion optimization.
Don’t make the mistake of following the findings from user testing without verifying using controlled A/B/n tests. Unfortunately, I have seen examples where research firms report findings from small groups using precise percentage results that give the advertiser false confidence in the results.
For example, if a report states that “58.3 percent of study participants value the many-options aspect of the service rather than the quality,” would you be inclined to emphasize options over quality in your advertising? That 58.3 percent number looks very precise, doesn’t it? But what if those findings are actually based on a survey of only 12 people? It would really mean that only 7 preferred the flexibility aspect. That result shouldn’t give you confidence to change your marketing approach!
There are several reasons why using usability testing alone can lead to misleading findings:
The Hawthorne Effect
The act of observing a thing changes that thing. When people know they’re being observed, they may be more motivated to complete the action. Or, knowing that you’re looking for usability problems, they may be more motivated to find problems whether or not they’re actually important.

Observer-Expectancy Effect
Researchers can unintentionally influence user-testing participants and change the results. This is similar to the Hawthorne effect. It’s very difficult to avoid communicating with subtle verbal and nonverbal cues that direct the user.
Limited Sample Sizes
The feedback you get is only valid for the small number of people you’re testing. Although you can often gain valuable insights from a small number of users, you don’t know which ones are valuable. And doing usability testing with large sample sizes is generally cost-prohibitive.
Sampling Bias
The first of two selection biases, sampling or user-selection bias occurs when you have a mismatch between your actual customers and the criteria you use for selecting study participants. You may have an inaccurate view of your real customers or may skew toward the segments that are easier to attract into the study. For example, if your company develops video games, by studying hard-core gamers in the 14- to 24-year-old male category you may miss out on the growing and lucrative 25- to 44-year old females, who will clearly have very different interaction styles and needs.
Self-Selection Bias
Self-selection bias is a significant problem when users volunteer to be in a study. You’ll never be able study people who don’t want to participate in studies. This could be a large portion of your target audience that you’ll never hear from! Look out for real customer motivations.

Preset Goals Creating an Artificial Scenario
In usability testing, the researcher sets predefined goals for the user to attempt to accomplish and then monitors their success or failure and points of difficulty.
Probably the most fundamental limitation of this type of user testing is that the scenarios are artificial. The task you choose for the user may not be the task a typical user would choose. It’s also not likely to be relevant to the particular user you’re testing. In other words, you’re asking a person to imagine and act as if they were the type of person who wanted to accomplish the task you want them to. That’s asking a lot!
Conversion Optimization Involves More Than Just Usability
Usability tests give you an indication of interface problems and clarity of navigation, but they usually don’t generate ideas about the layouts, content, and value proposition that would be more persuasive. Steve Jobs was once quoted in BusinessWeek saying, “It’s really hard to design products by focus groups. A lot of times, people don’t know what they want until you show it to them.” Your customers don’t know how you can motivate them, and they can’t tell you which landing page design will work best for them, either.

Researchers have similar problems when conducting focus groups, one-on-one interviews, or other qualitative methods. They know that data can’t be reliable until it’s verified with quantitative testing.
Traditional usability testing is valuable in exploring a variety of scenarios quickly, gaining immediate interactive feedback, and developing hypotheses that could not otherwise have been predicted. But when used in isolation, it isn’t a good tool for website decision-making. The potential insights generated need to be validated through controlled testing.
I think Joel Spolsky said it well:
Usability is not everything.
If usability engineers designed a nightclub, it would be clean, quiet, brightly lit, with lots of places to sit down, plenty of bartenders, menus written in 18-point sans-serif, and easy-to-find bathrooms.
But nobody would be there. They would all be down the street at Coyote Ugly pouring beer on each other.
Surveys Are Not Conversion Optimization
Surveys can be a useful tool for gathering feedback from your visitors, but they alone won’t optimize your conversion rate. Website surveys have become very popular for marketers like IKEA and MacWorld to gather direct feedback from visitors.
IKEA pop-up survey greets visitors.

MacWorld popup survey by ForeSee

Survey tools like these can help gather qualitative data on customer satisfaction. They’re especially useful for finding customer-service lapses, because customers who are disgruntled with your product or service are most likely to express their frustration.
Surveys won’t tell you how to create the best layouts and content to maximize your conversion rate, however. Only the most serious usability problems will be revealed with a survey.
Click Heatmap Tracking Is Not Conversion Optimization
Some fantastic tools allow you to monitor how visitors interact with your website. With some, you can view visual overlays on your pages, showing where people click most often.
A click heatmap of the WiderFunnel.com home page, generated by CrazyEgg, shows click concentrations on the animated demo and blog links.

Some tools can also record videos of individuals’ screens as they navigate through your website. It’s almost as if you’re looking over the visitor’s shoulder. The technology is awesome!
Interaction tracking like this can give you some ideas about which areas visitors may expect to be clickable. You may find, for example, that a lot of people click an image, perhaps expecting to be able to view a larger version of it.
Tracking like this can’t tell you why visitors act the way they do, however. You won’t know why people are clicking an image or what they expect to see next (and each person may have different expectations). More important, it also can’t tell you whether changes will lift conversions!
Surveys, user testing, click tracking, and other similar technologies are not, in themselves, conversion optimization, but they’re all methods for developing hypotheses for conversion optimization.
By now you should see that conversion optimization doesn’t happen without controlled testing. All the observations, analytics, and gut feelings you can gather may improve your results, but you’ll never know for sure until you test them. By all means, gather the data; then You Should Test That!
What Is Conversion Optimization?
Now that you’ve seen many of the common misconceptions and understand what conversion optimization is not, let’s look at what it is. True conversion optimization lives in the intersection of persuasion marketing, experience design, and the scientific method.

- In persuasion marketing, a skilled conversion strategist knows how to communicate the value proposition and build desire in the prospects. This is where you create motivation for completing the call to action. It involves communicating the right message to the right people at the right time with clarity.
- Experience design is where you facilitate that action. When you’ve created motivation, your prospects need a seamless, painless, and even enjoyable way to complete the action. Experience design is focused on the transactional elements of your marketing.
- The scientific method is how you test the hypotheses you create within the first two areas. This requires using a rigorous process of continuous testing, iteration, and improvement.
Who Are Your Target Audiences?
The concept of a target audience is a way of describing the people you would like your marketing messages to reach. Understanding your audience is critical to being able to create products and messages that they can relate to and will respond to.
Target Markets and Personas
In recent years, marketers have debated the benefits of using target markets versus the newer concept of a persona to understand their customers. Almost all marketing departments have target-market definitions, but detailed personas are still a rarity.
Whether you use target markets or have detailed personas, conversion optimization requires putting yourself in your customers’ shoes. Practicing the art of empathizing with their perspective, needs, and experience will make you a better conversion optimizer.
Target Markets
Marketers use the concept of target markets (or segments or profiles) to help understand whom they’re marketing to. Target markets are based on similar demographic data, such as age, household income, and life stage, as well as psychographic characteristics, including interests, perspectives, and religious or political views.
The benefit of target markets is that they’re relatively easy to develop, understand, and communicate. A typical target-market description could look like this:
- Age: 35–54
- Marital status: Married
- Gender: Skews female
- Household income (HHI): $75,000+
Some companies have several distinct target markets, and each summary allows the marketer to select media and messaging to reach and persuade them.
Target-market summaries are often criticized for lacking insight into the individuals. It can be difficult for you as a marketer to really connect with your customers if you can only think of them as a faceless mass labeled with these cold data points. That impersonal feeling has led to the popularity of personas as a marketing tool.
Personas
Personas take a more individualistic approach to understanding your audience. Many companies go to great lengths to develop these detailed descriptions of their typical customers.
The characteristics that are included in personas vary greatly depending on who develops them. There are few common standards for persona development.
Personas are especially helpful for your copywriters to paint a clearer picture of the reader and understand their situation and needs. On the other hand, highly detailed personas can lead to copywriting that is too specific to a fictional character. The individuals represented in the persona descriptions don’t represent your real customers. There is no average customer, and speaking to one predominantly can alienate your real customers.
A persona helps guide the development of copy for a new website.

Courtesy of the Public Legal Education and Information Network of British Columbia.
Writing for multiple imagined persona types can also make the copywriting too wordy, as you try to meet all the individual needs of these persona characters. In practice, writing for personas often sacrifices brevity and clarity in exchange for over-personalization. The result can be a cluttered message and lower conversion rates!
You should use the data you have available to get a good understanding of your visitors without becoming bogged down creating overly detailed personas. A balance can be achieved without the potential complexity the persona-development projects can provoke.
Setting Goals
Before getting started on your first conversion-optimization project, you’ll save yourself grief by spending time clarifying your goals. You may think goals are the obvious part; after all, you already know you want more sales, right? There is a lot more involved in goal-setting than simply deciding to increase sales, though.
You need to track and improve the activities that deliver business results. It often helps to start at the beginning by stating why the website exists; then you can identify all the possible goals, prioritize them, and pinpoint the most important ones to optimize for.
This section will cover the strategy for goal-setting. In Chapter 11, “Test Your Hypotheses,” I’ll show how to implement the goals as part of your test plan.
Define Your Goals
Why does your website exist? Is it there to:
- Present information about your company and products?
- Generate leads for your sales team?
- Convince visitors to “Like” you on Facebook or follow you on Twitter?
- Create your brand image?
- Sell products to new customers? Sell products to repeat customers?
- Provide customer service and warranty claims?
Maybe it has more than one of those goals, or maybe others. One thing is for sure—until your goals are well defined, you’ll have a hard time knowing when you’ve achieved them.
You may, like many website managers, be facing the pressures of competing priorities and demands from multiple stakeholders. Especially in larger organizations, every department wants its own content featured prominently, and every time the “next big thing” comes along, someone wants to add it to the website.
Understanding your website’s raison d’être and the specific goals needed to achieve that overall purpose will give you the rationale and the data to make sound decisions under pressure.
The Goals Waterfall
Your goals for your conversion-optimization tests should flow from your marketing goals, which ultimately flow from the organization’s goals and strategy. This top-down goal flow is what I call the goals waterfall.
By tying your activity and decisions up the waterfall to the business goal source, you’ll focus your efforts on the most productive outcomes that benefit the organization. It’s easy to lose sight of the business goals in the day-to-day debates over website decisions, but developing a habit of defining the right goals will pay off.
Not only will your focus on the business goals ensure that you optimize the right things, but it can also help you get more senior buy-in and attention for your projects, and even get you the salary increase you’ve been hoping for. It’s a win-win-win!
Prioritize Your Goals
To control the competing demands within the organization, you need to create a clear goal prioritization. You can do this in three steps:
The goals waterfall shows that conversion-optimization goals flow top-down from business goals.

Once you get agreement on the goal prioritization and values, you’ll have very clear direction to set up your conversion-optimization goals.
Rank Your Goals
You can take a first pass at ranking your goals by simply creating an ordered list of your goals in terms of the relative value to the business. That list will give you a basic criterion for judging the emphasis for each competing piece of content. You’ll clearly be able to see how prominent each piece of content should be on your pages.
This is, incidentally, a good opportunity to include management and other website stakeholders in the discussion. It could help you build consensus for your later proposal to start conversion-optimization testing on the site.
For example, your organization’s social-media advocate is probably telling you that your landing pages should include badges for Twitter, Facebook, LinkedIn, Google+, and all other manner of social activity. With your prioritized goal list that is tied back to the organizational goals, you can now have a reasoned conversation about where a Facebook “Like” fits on the hierarchy of information. Is it more important than a newsletter signup, whitepaper download, quote request, or product purchase? Probably not.
Let’s use an example to demonstrate how to prioritize goals. Here is a typical list of website goals that has been sorted in order of importance:
| Priority | Goal |
| 1 | Product sale |
| 2 | Quote request |
| 3 | Whitepaper download |
| 4 | Blog comment |
| 5 | Social-media profile activity (Facebook, Twitter, LinkedIn, Google Plus, and so on) |
You can clearly see from this list which calls to action should get the most visual emphasis on your key pages. In this case, the product sale is your main conversion, and the others are secondary goals, or what we call micro-conversions. The quote request in some cases is also a primary conversion if it leads to a sale for a different product or a higher-value order.
Your landing-page visitor should have no question that their primary decision is whether to purchase a product now before evaluating the secondary conversion options. The call-to-action for purchasing should be the most prominent action button on the page.
Assign Relative Goal Values
After ranking your goals, you should then take your prioritized list one step further by assigning relative values to each of the goals. The values don’t have to be absolutely accurate revenue-producing numbers for a start. Simply having magnitude context helps greatly to clarify decision-making.
Pick a median goal on your list, and assign it an arbitrary amount, such as $10. In the following example, we’ll add a $10 value to the whitepaper download. To simplify this example, I’m including e-commerce and lead-generation goals, which may or may not apply in your situation. As a starting point for valuing the relative importance of your goals, you can estimate the value of the other goals up and down from that median value, as in the next table.
| Priority | Goal | Value |
| 1 | Product sale | $250 |
| 2 | Quote request | $100 |
| 3 | Whitepaper download | $10 |
| 4 | Blog comment | $2 |
| 5 | Social-media profile activity (Facebook, Twitter, LinkedIn, Google Plus, and so on) | $1 |
In most cases, as in this example, you’ll start to see a dramatic split between goals that are closely tied to revenue and others that are more speculative. This should give you even more motivation to optimize for the high-value goals. You can now pull out this handy list in a web-design debate and ask, “Would we rather have a $1 Facebook ‘Like’ or a $250 product sale?” That’s one question that doesn’t take any testing to answer!
Estimate Real Goal-Contribution Values
The relative goal values will get you close to what you need for the purposes of optimization, but you may want to refine them further. For example, the product-purchase and quote-request amounts in this example can likely be estimated more accurately.
To improve your estimated quote-request value, you can calculate it by identifying the sales that came from your web quotes. If you already have your sales quotes tagged in your sales-management system, you’ll have no problem pulling the sales that originated from quote requests. The value of a quote request can be calculated as follows:
S = Your total sales from quote requests
Q = Your total quote requests
Quote-request value = S / Q
For example, if you have $180,000 sales from 1,000 quote requests, the value of a quote request is
$180,000 / 1,000 = $180
Your other goals may not have direct revenue tied to them, but they should still be recognized with some value. You can spend a lot more time refining these values through attribution modeling and LTV exercises, but don’t do that first. Especially if you haven’t started your conversion testing yet, your time is best spent getting a test running. You’ll get better results optimizing for an 80 percent accurate goal than waiting until your goals are 100 percent accurate!
The updated goal-value list looks like this:
| Priority | Goal | Value |
| 1 | Product sale | $229 |
| 2 | Quote request | $180 |
| 3 | Whitepaper download | $10 |
| 4 | Blog comment | $2 |
| 5 | Social-media profile activity (Facebook, Twitter, LinkedIn, Google Plus, and so on) | $1 |
If the difference in value between your main goal and your micro-indicator conversion goals is large, you should track the single goal in your tests. The KISS (“Keep It Simple, Superstar”) principle applies here. Tracking many micro-conversion goals for conversion-optimization tests can overcomplicate the analysis unless they’re clearly important steps toward a main conversion.
Now you have the tools to prioritize your goals. You need to decide which action or actions on your site to identify as goal conversions. There may be several steps along a purchase or lead-generation funnel that can be tracked.
Should You Optimize for Micro-Conversions?
The most common reason people optimize for micro-step conversions is to speed up their experiments. Remember that a micro-step conversion is simply a small action on the way to a full revenue-producing conversion.
Because the length of time needed to run your A/B/n or multivariate test depends, in part, on the amount of traffic and conversions you get, and because most websites get many times more micro-conversions than sales or lead conversions, their experiments may complete faster using micro-conversions as test goals.
For example, consider a typical gated form that a software company uses to generate leads for a sales team.
A gated software-conversion path

At each step, there is a certain drop-off rate. If the home page gets 100,000 visitors monthly, the counts for each page in this hypothetical scenario could be as follows:
Setting Micro-Conversions as Goals
Let’s say you want to run an A/B/n test on the home page in the previous example. You need to decide whether your experiment goal is: a) visit to the download page, b) visit to the gate page, or c) download completion.
If you choose option a), using the download page micro-conversion as the goal, your experiment will complete faster because you’ll have 20,000 goals triggered rather than 5,000.
That’s good news, right? You can finish the test sooner and move on to the next test.
The False Micro-Conversion Testing Assumption
But, wait. You’ve made a big assumption there.
If you assume there’s an equal drop-off rate through the funnel regardless of the home page variation shown, it shouldn’t matter which one you choose. But will your funnel-completion rate (from download to thank-you page) really be the same regardless of the home page variation?
In our testing experience, that is a dangerous assumption. Using micro-conversions as conversion-optimization goals can show misleading test results. We have seen many examples where the first step of a funnel can dramatically change the completion of a subsequent step—even a step that is several steps removed.
Here’s a typical example A/B/n test result through the funnel:

Depending on the micro-conversions you were counting as your goals, here’s what you would have decided:
| Conversion Goal | Winning Variation |
| Download page | Variation C |
| Gate with form | Variation A |
| Thank-you page | Variation B |
Clearly, the best-performing variation is actually B. It lifted the lead-generation conversion rate by 46 percent. But if you had run the test using download-page visits as the goal, you would have chosen variation C as the winner and could have seriously hurt your results! In short, where you set your test goal influences your results.
Optimize for Revenue-Producing Actions
For conversion optimization, you should always set your test goal to be as close to revenue as possible. Optimize for direct sales, average order value, and qualified leads generated.
Please continue to track and review micro-conversions in your web analyses, but for conversion testing, stick to revenue-producing goals.
Web Analytics Goals vs. Conversion-Optimization Goals
Many of the metrics found in your standard web analytics setup aren’t appropriate goals for optimization, even though they may be relevant Key Performance Indicators (KPIs) for your website.
When setting up your web analytics tool, it can be helpful to set up tracking for all manner of activities. You can set various pages and micro-conversions as goals, and even track clicks, time on page, and other interactions as events. These can all be helpful as you search for insights into how visitors are using the site, and can spark new hypotheses for testing.
However, just because something is tracked and meaningful doesn’t mean it should be a conversion-optimization goal. Conversion-optimization goals should be selected very carefully to only include the most important revenue-tied action or actions.
Example: Don’t Optimize for Bounce Rate
Bounce rate, for example, is a common KPI and an indicator of the relevance of a particular page to visitors entering the site. If your site-wide bounce rate is 43% and a popular entry page has a bounce rate of 56%, for example, the page may not be meeting the expectations of incoming visitors.
A higher bounce rate isn’t necessarily a problem, however:
But a high bounce rate can suggest a problem on a page, too. So shouldn’t you try to lower a high bounce rate with testing if you can?
No. If you set bounce-rate reduction as your conversion-optimization goal, you could hurt your revenue-producing goals.
Here are instances where your bounce rate could be lowered without improving revenue:
- Changing a single landing page into a multipage microsite experience could encourage multipage views without more purchases.
- Moving some key information, like pricing, onto a second page will almost surely lower bounce rate but not improve sales.
- Simply adding links to popular news or blog content could lower bounce rate but just be a distraction from sales goals.
- Replacing productive offers with free offers may have lower revenue-producing value.
If you were to test any of these options as challenger experiment variations, you could easily lower your bounce rate and believe your test was a success. But that new challenger page may have hurt revenue production while “improving” your bounce rate. In this case, you shouldn’t test that!


Round 2 winner

The Continuous Improvement Cycle
In our personal lives, we are continually given opportunities to learn, change, and grow. Our daily interactions can be like miniature experiments where we receive feedback from the world and have opportunities to try different ways of interacting. Some choices we make are more or less effective than others, as my former girlfriends will attest, and the world gives us the appropriate feedback.
Looking at the bigger picture, the same can be said for how life on Earth evolves by experimenting with different variations of each species. Life is a continuous improvement experiment!
Our businesses have the same opportunities to evolve. Rather than meeting the fate of the dodo or dinosaur, however, we can consciously run experiments to keep ahead of the competition.
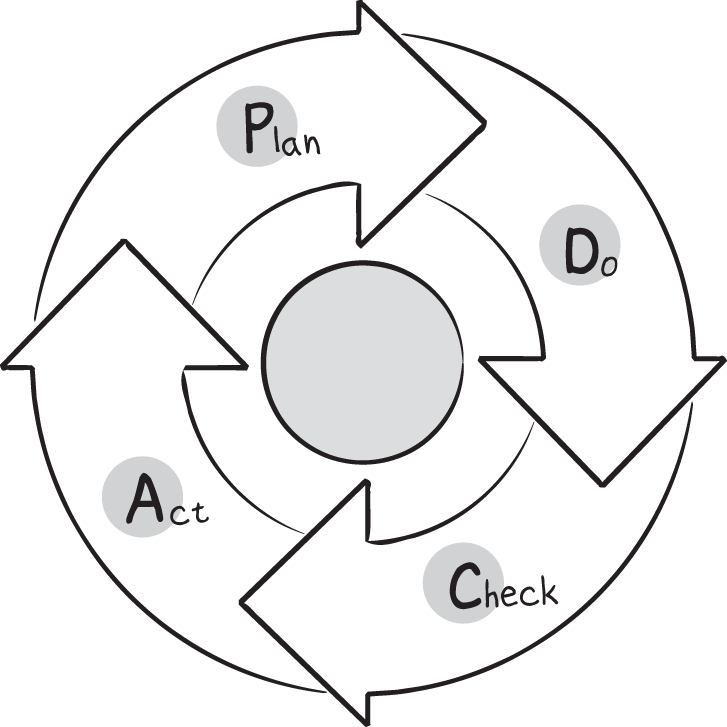
Business theories have been developed to recognize and capture these optimization opportunities, such as the Shewhart Cycle. Systematic processes like this for planning new ways of doing things, checking the results, and following the better-performing actions have improved business quality dramatically in the past half century.
The Shewhart Cycle for continuous production improvement
As in life and business, our websites have opportunities to receive feedback and improve on a continuous basis.
Continuous Improvement Is Key to Success
There is an unfortunate misconception that conversion optimization immediately results in a perfect, “optimized” page or website. It’s tempting to hope for an ideal page to quickly emerge from one or two test rounds. That perfect page doesn’t appear instantly, however. Conversion optimization is best approached as an ongoing process of improvement.
Companies that view their optimization efforts as a one-time project don’t get the best results. They’re easily discouraged if the first test doesn’t give immediate leaps in their conversion rate and miss learning opportunities that can be gained from each experiment. Each test is an exciting opportunity to learn how your real visitors respond to new experiences, and those insights can have powerful effects if you let them.
Our experience at WiderFunnel shows that the companies that plan with us for an ongoing series of experiments get the best results. The compound learning that is gained from each test leads to even more ideas for improvement and often much larger conversion-rate gains on the third and fourth test rounds on a page.
The seven-step Funnel Experiment cycle

One of the most important keys to testing success is having a consistent process to follow for executing tests. According to Econsultancy research:
…four variables most strongly correlated with improved overall conversion in the last year are perceived control over conversion rates, a structured approach to CRO, having someone directly responsible for conversion and incentivising staff based on conversion rates.
Econsultancy Conversion Rate Optimization Report, October 2011, emphasis mine
Progress from Macro to Micro
The great sculptor Michelangelo began by removing large chunks from a granite block. He gradually progressed to removing smaller bits with finer tools and eventually to sanding and polishing to reveal the finished sculpture, as in his David.
Michelangelo’s David began as a rough granite block.

It would have been a wasted effort for him to polish the rough granite block before chiseling away the large chunks. The form needs to be defined before the detail. Similarly, your conversion optimization should begin with testing the overarching concepts and major page elements before moving in to refine the fine details.
We often begin by testing the layout, funnel flow, or value-proposition concept of a landing page. Once we’ve determined the best approach, the details of the containing elements can be tested, including headlines, imagery, copywriting details, and call-to-action buttons.
In the next chapter, you’ll learn how to prioritize your conversion-optimization opportunities using data and the three-component prioritization framework.