Chapter 13: Bringing Zabbix to the Cloud with Zabbix Cloud Integration
For the last chapter, we have prepared something special. As a long-time Zabbix user, the importance of cloud integration for tools such as Zabbix has not gone unnoticed. For some people, the cloud can be daunting, and thus with this chapter, I want to show you just how easy it can be to start working with the most popular cloud providers and Zabbix.
We are going to start by talking about monitoring the Amazon Web Services (AWS) cloud with Zabbix. Then we will also see how the same things are done using Microsoft Azure so we can clearly see the differences.
After going through these cloud products, we'll also check out container monitoring with Docker, a very popular product that can also benefit greatly from setting up Zabbix monitoring. Follow these recipes closely and you will be able to monitor all of these products easily and work to extend the products using Zabbix. This chapter comprises the following recipes:
- Setting up AWS monitoring
- Setting up Microsoft Azure monitoring
- Building your Zabbix Docker monitoring
Technical requirements
As this chapter focuses on AWS, Microsoft Azure, and Docker monitoring, we are going to need a working AWS, Microsoft Azure, or Docker setup. The recipe does not cover how to set these up, so make sure to have your own infrastructure at the ready.
Furthermore, we are going to need our Zabbix server running Zabbix 6. We will call this server zbx-home in this chapter.
You can download the code files for this chapter from the following GitHub link: https://github.com/PacktPublishing/Zabbix-6-IT-Infrastructure-Monitoring-Cookbook/tree/main/chapter13.
Setting up AWS monitoring
A lot of infrastructure is moving toward the cloud these days and it's important to keep an eye on this infrastructure as much as you would if it were your own hardware. In this recipe, we are going to discover how to monitor Relational Database Service (RDS) instances and S3 buckets with our Zabbix setup.
Getting ready
For this recipe, we are going to need our AWS cloud with some S3 buckets and/or RDS instances in it already. Of course, we will also need our Zabbix server, which we'll call zbx-home in this recipe.
Then, last but not least, we will require some templates and hosts, which we can import. We can download the XML files here: https://github.com/PacktPublishing/Zabbix-6-IT-Infrastructure-Monitoring-Cookbook/tree/main/chapter13.
Important Note
Using Amazon CloudWatch is not free, so you will incur costs. Make sure you check out the Amazon pricing for AWS CloudWatch before proceeding: https://aws.amazon.com/cloudwatch/pricing/.
How to do it…
Setting up AWS monitoring might seem like a daunting task at first, but once we get the hang of the technique it's not that difficult. Let's waste no more time and check out one of the methods we could use:
- Let's start by logging in to our Zabbix server with the hostname zbx-home.
- On the Zabbix server, download the AWS CLI installation package with the following command:
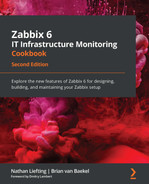
curl https://awscli.amazonaws.com/awscli-exe-linux-x86_64.zip -o "awscliv2.zip"
The result will look like this:
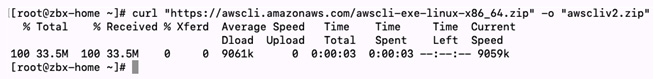
Figure 13.1 – curl command execution for AWS CLI
- If you haven't already done so, install unzip with the following command.
For RHEL-based systems:
dnf install unzip
For Ubuntu systems:
apt install unzip
- After installing the unzip application, we can use it to unzip our AWS CLI installation package with the following command:
unzip -q awscliv2.zip
- We are now ready to install our AWS CLI with the following command:
./aws/install
The output will look like this:

Figure 13.2 – AWS CLI install command execution
- Next up, log in to your AWS account by navigating to the following URL in your browser: https://signin.aws.amazon.com/.
- Once logged in, we can navigate to My Security Credentials listed in your user profile in the top-right corner:
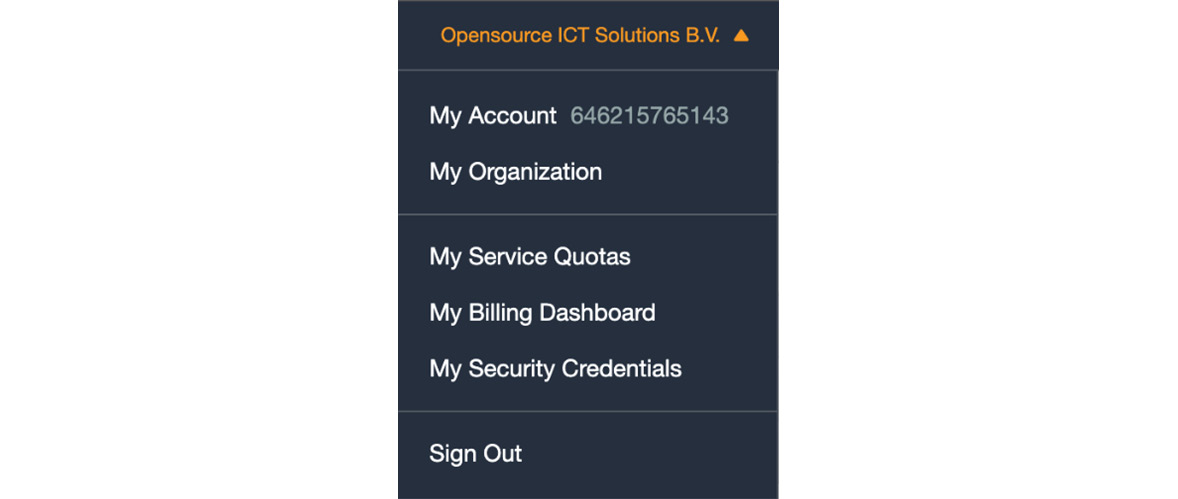
Figure 12.3 – AWS web frontend user profile
- On the next page, click on Access keys (access key ID and secret access key). This will open up the following screen:
Figure 13.4 – AWS access keys page
- Click on Create New Access Key to create a new access key. You should see the following:
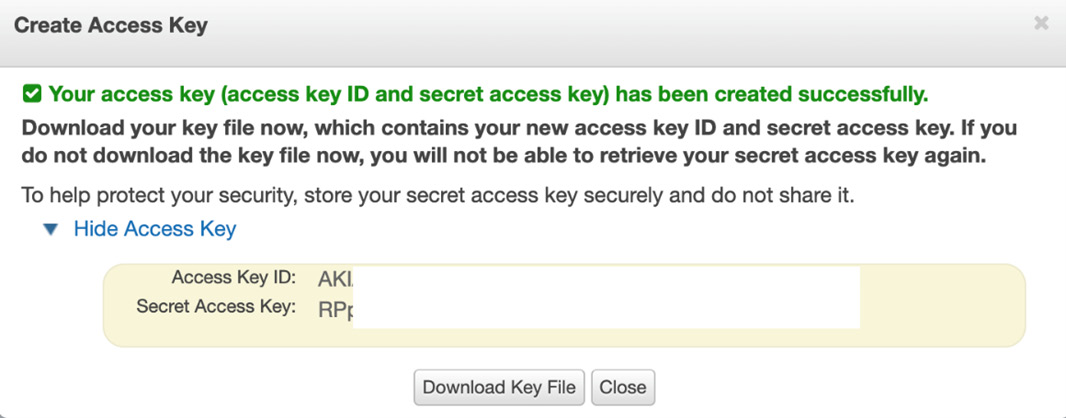
Figure 13.5 – AWS access key details
- Make sure to note down the access key ID and the secret access key as we will need them later.
- Back in the Linux CLI, let's create some folders:
mkdir /var/lib/zabbix
chown zabbix:zabbix /var/lib/zabbix/
- Then, let's log in to our zabbix user. It is important to execute the following commands on the correct Linux users, so switch to the zabbix user with the help of the following command:
su -s /bin/bash zabbix
- Under the zabbix user, enter the following command:
aws configure
- Fill in the AWS Access Key ID and AWS Secret Access Key fields we noted down earlier. Also, make sure to change your default region to your preferred region and set the output format to json. It will look like this:

Figure 13.6 – AWS configure command on the Linux CLI
- Configuration under the zabbix user is now complete and you can switch back with the following command:
exit
- Now, switch directories with the help of the following command:
cd /usr/lib/zabbix/externalscripts
- Then, create a new script file called aws_script.sh in this directory with the help of the following command:
vim aws_script.sh
- Add the following lines to the script and save the file:
#!/bin/bash
instance=$1
metric=$2
now=$(date +%s)
aws cloudwatch get-metric-statistics --metric-name $metric --start-time "$(echo "$now - 300" | bc)" --end-time "$now" --period 300 --namespace AWS/RDS --dimensions Name=DBInstanceIdentifier,Value="$instance" --statistics Average—dimension Name=DBInstanceIdentifier,Value="$instance" --statistics Average
- Make sure the zabbix Linux user can execute this script by setting the permissions with the following command:
chown zabbix:zabbix aws_script.sh
chmod 700 aws_script.sh
- We also need to add functionality to the Zabbix agent. Do this by adding user parameters. On the Zabbix server Linux CLI, switch directory with the help of the following command.
cd /etc/zabbix/zabbix_agentd.d/
For the Zabbix agent 2:
cd /etc/zabbix/zabbix_agent2.d/
- Now, create a new file with the following command:
vim userparameter_aws.conf
- Then, insert the following lines:
#Buckets
UserParameter=bucket.discovery,aws s3api list-buckets --query "Buckets[]"
UserParameter=bucket.get[*], aws s3api list-objects --bucket "$1" --output json --query "[sum(Contents[].Size), length(Contents[])]"
#RDS
UserParameter=rds.discovery,aws rds describe-db-instances --output json --query "DBInstances"
UserParameter=rds.metrics.discovery[*],aws cloudwatch list-metrics --namespace AWS/RDS --dimensions Name=DBInstanceIdentifier,Value="$1" --output json --query "Metrics"
- Reload your Zabbix agent user parameters as follows:
zabbix_agentd -R userparameter_reload
Tip
Using user parameters will work with both the Zabbix agent and Zabbix agent 2. This means that irrespective of whether you are required to run the old or new agent, you can set up AWS monitoring without any issues.
- Let's now confirm whether it is working. Navigate to your Zabbix frontend and go to Configuration | Templates.
- Click on the blue Import button and add the template_aws.xml file, which we can download from Packt's GitHub repository at the following link: https://github.com/PacktPublishing/Zabbix-6-IT-Infrastructure-Monitoring-Cookbook/tree/main/chapter13/template_aws.xml.
- Then, navigate to Configuration | Hosts, click on the blue Import button, and import the aws_hosts.xml file, which we can download from Packt's GitHub repository at the following link: https://github.com/PacktPublishing/Zabbix-6-IT-Infrastructure-Monitoring-Cookbook/tree/main/chapter13/aws_hosts.xml.
- This will import an AWS template called Template AWS discovery and add two AWS hosts – Bucket discovery and RDS discovery.
That's the final step for this recipe. Check out the new templates, hosts, and how it all fits together in the How it works… section.
How it works…
Now that we've done all the setup at the Linux CLI level and have imported the templates and hosts, let's see what they do. Under Configuration | Hosts, we can now see two new hosts.
First, let's look at the AWS Bucket discovery host. This host will discover our AWS buckets, such as the S3 bucket. We can see that the host only has one configuration, which is a discovery rule. If we go to this discovery rule, called Bucket discovery, we can see that it uses the item key bucket.discovery. This item key is defined by us in the user parameters and executes the following command:
aws s3api list-buckets --query "Buckets[]"
We do this to get every single AWS bucket and put it in the {#NAME} LLD macro.
Furthermore, there are three item prototypes on the discovery rule. The most important item prototype is the one called {#NAME}, which will use the Zabbix agent to execute the user parameter with the bucket.get item key for every bucket found for the {#NAME} LLD macro we just discovered in the discovery rule.
The bucket.get item key then executes the command we defined, which is the following:
aws s3api list-objects --bucket "$1" --output json --query "[sum(Contents[].Size), length(Contents[])]"
This command gets all of our information from the AWS buckets found and adds them to an item on our AWS Bucket discovery host. We can then use dependent items as in the two examples cited to extract the information from the item and put them in different items. Check out Chapter 3, Setting Up Zabbix Monitoring, for more information on dependent items.
We also have our AWS RDS discovery host, which will discover AWS RDS instances. If we check out the host, we can see only one configuration, which is the discovery rule Instance discovery. This discovery rule has one host prototype on it to create new hosts from every RDS found in our AWS setup. It uses the rds.discovery item key, which executes the following command:
aws rds describe-db-instances --output json --query "DBInstances"
This puts every RDS instance in the {#NAME} LLD macro and creates a new Zabbix host for it. After creating the host, it will also make sure that the AWS RDS discovery template is linked to the new host. The template has a discovery rule to get some RDS metrics from the RDS instance using the item key rds.metrics.discovery, which executes the following command:
aws cloudwatch list-metrics --namespace AWS/RDS --dimensions Name=DBInstanceIdentifier,Value="$1" --output json --query "Metrics"
What we are doing here is using the AWS CLI to execute commands on our Zabbix server through the Zabbix agent user parameters. The Zabbix agent runs the AWS CLI command and retrieves data from AWS CloudWatch. These metrics are stored in the database and then used in our items.
Now that we've seen how to use AWS CloudWatch, we can extend the Zabbix agent further by adding extra user parameters or by creating more dependent items and using this information.
There's more…
It takes time to start monitoring with AWS CloudWatch as we need a good understanding of the AWS CLI commands with the use of CloudWatch. When you use the templates provided in this recipe as a basis, you have a solid foundation on which to build.
Make sure to check out the AWS documentation for more information on the commands that we can use at the following link:
https://docs.aws.amazon.com/cli/latest/reference/#available-services
Setting up Microsoft Azure monitoring
The Microsoft Azure cloud is a big player in the cloud market these days and it's important to keep an eye on this infrastructure as much as you would your own hardware. In this recipe, we are going to discover how to monitor Azure instances with our Zabbix setup.
Getting ready
For this recipe, we are going to need our Azure cloud with an Azure DB instance in it already. The recipe does not cover how to set up an Azure DB instance, so make sure to have this in advance. We will also need our Zabbix server, which we'll call zbx-home in this recipe.
We have split up the Azure CLI installation aspect into RHEL-based and Ubuntu systems. Make sure to use the guide that is appropriate for you.
Then, last but not least, we will require some templates and hosts, which we can import. We can download the XML files here: https://github.com/PacktPublishing/Zabbix-6-IT-Infrastructure-Monitoring-Cookbook/tree/main/chapter13.
How to do it…
For Azure monitoring, we face some of the same techniques as we do for AWS monitoring. It is a bit daunting, but easier than it looks. Let's check out one of the techniques we can use for Azure monitoring:
- First things first, log in to the Zabbix server Linux CLI.
- We are going to install the Azure CLI on our Zabbix server.
Let's cover RHEL-based systems first.
RHEL-based Azure CLI installation
First things first, let's check out the installation process on a RHEL-based host:
- Let's import the Azure repository key:
rpm --import https://packages.microsoft.com/keys/microsoft.asc
- Then, create the repository file with the following command:
echo -e "[azure-cli]
name=Azure CLI
baseurl=https://packages.microsoft.com/yumrepos/azure-cli
enabled=1
gpgcheck=1
gpgkey=https://packages.microsoft.com/keys/microsoft.asc"| tee /etc/yum.repos.d/azure-cli.repo
- Now, run the installation command to install the Azure CLI with the following command:
dnf -y install azure-cli
Ubuntu Azure CLI installation
Now, let's check out the installation process on a Ubuntu host:
- Install the required dependent packages with the following command:
apt install ca-certificates curl apt-transport-https lsb-release gnupg
- Now, download and install the Microsoft signing key with the help of the following command:
curl -sL https://packages.microsoft.com/keys/microsoft.asc |gpg --dearmor | tee /etc/apt/trusted.gpg.d/microsoft.gpg > /dev/null
- Then, add the Azure CLI repository with the following command:
AZ_REPO=$(lsb_release -cs)
echo "deb [arch=amd64] https://packages.microsoft.com/repos/azure-cli/ $AZ_REPO main" | tee /etc/apt/sources.list.d/azure-cli.list
- Then, update the repository information and install the Azure CLI with the following command:
apt update
apt install azure-cli
Setting up Azure monitoring
Now that we've installed the Azure CLI we can start setting up the Azure monitoring:
- We will need to log in as the zabbix user. Make sure to use a Bash terminal with the zabbix user. Use the following command:
su -s /bin/bash zabbix
- As the zabbix user, we can now use the following command to log in to the Azure CLI:
az login
- You will be asked to provide Azure with the key and a token shown in the Azure CLI. Use the Key and Token options on the following web page: https://aka.ms/devicelogin.
- Once you've logged in successfully, log out from the zabbix user with the help of the following command:
exit
- Now, let's add some functionality to the Zabbix agent on our Zabbix server by using user parameters.
- Still on the Zabbix server CLI, switch to the Zabbix agent directory with the help of the following command.
For the Zabbix agent:
cd /etc/zabbix/zabbix_agentd.d/
For the Zabbix agent 2:
cd /etc/zabbix/zabbix_agent2.d/
- Create a new file with the following command:
vim userparameter_azure.conf
- In this file, insert the following lines:
UserParameter=azure.db.discovery,az resource list --resource-type "Microsoft.DBforMySQL/servers"
- We will also require a Zabbix externalscript. Let's switch directory with the following command:
cd /usr/lib/zabbix/externalscripts/
- Then, create an azure_script.sh script by executing the following command:
vim azure_script.sh
- We then need to add the following lines:
#!/bin/bash
id=$1
metric=$2
curr=$(date --utc +%Y-%m-%dT%H:%M:%SZ)
new=$(date --utc -d "($curr) -5minutes" +%Y-%m-%dT%H:%M:%SZ)
az monitor metrics list --resource $id --metric "$metric" --start-time "$new" --end-time "$curr" --interval PT5M
- Save the file and make sure to set the correct permissions with the help of the following command:
chown zabbix:zabbix azure_script.sh
chmod 700 azure_script.sh
- We can now restart our Zabbix agent with the following command.
For the Zabbix agent:
systemctl restart zabbix-agent
For the Zabbix agent 2:
systemctl restart zabbix-agent2
- We can now configure our Zabbix frontend by importing a template and a host.
- Open your Zabbix frontend and navigate to Configuration | Templates. Here, we need to click on the blue Import button and import the template_azure.xml file, which we can download at https://github.com/PacktPublishing/Zabbix-6-IT-Infrastructure-Monitoring-Cookbook/tree/main/chapter13/template_azure.xml.
- We will also need to import a host. Go to Configuration | Hosts and click on the blue Import button to import the azure_host.xml file, which can be downloaded here: https://github.com/PacktPublishing/Zabbix-6-IT-Infrastructure-Monitoring-Cookbook/blob/main/chapter13/azure_host.xml.
That's the final step for this recipe. Let's stay with the frontend and check out the new templates, hosts, and how it all fits together in the How it works… section.
How it works…
If you've followed the recipe regarding AWS monitoring, you might think that Azure monitoring works the same. In fact, we employ a different Zabbix monitoring technique here, so let's check it out.
After adding the template and the host to our Zabbix server, we can go to Configuration | Hosts and check out our new host. We can see one new host here called Discover Azure DBs. When we examine this host, we can see that it only has one configuration, which is a discovery rule called Discover Azure DBs, like the host.
Under this discovery rule, we find a single host prototype called {#NAME}. This host prototype uses the discovery rule's azure.db.discovery item key to execute the following command:
az resource list --resource-type "Microsoft.DBforMySQL/servers"
With this command, the {#NAME} LLD macro is filled with our Azure DB instances, and we create a new host for every single Azure DB instance found. The new hosts then get the Azure DB template added to it.
When we check out the template under Configuration | Templates, we can see that it has 12 items. Let's check out the item CPU Load. This item is of the External check type, which uses its azure_script.sh[{$ID},cpu_percent] item key to execute the external script azure_script.sh and feed it the parameters {$ID} and cpu_percent. The script that is executed uses the Azure CLI to retrieve the values and we put this value in the Zabbix database.
There's more…
We can discover way more from Azure using the method applied in this recipe. The script we employed is used to get metrics from Azure, which we can put in items by feeding them the correct parameters.
Check out the Azure CLI documentation for more information on the metrics retrieved using the script at the following link:
https://docs.microsoft.com/en-us/cli/azure/monitor/metrics?view=azure-cli-latest
Building your Zabbix Docker monitoring
Ever since the release of Zabbix 5, monitoring your Docker containers became a lot easier with the introduction of Zabbix agent 2 and plugins. Using the Zabbix agent 2 and Zabbix 6, we are able to monitor our Docker containers out of the box.
In this recipe, we are going to see how to set this up and how it works.
Getting ready
For this recipe, we require some Docker containers. We won't go over the setup of Docker containers, so make sure to do this yourself. Furthermore, we are going to need Zabbix agent 2 installed on those Docker containers. Zabbix agent does not work in relation to this recipe; Zabbix agent 2 is required.
We also need our Zabbix server to actually monitor the Docker containers. We will call our Zabbix server zbx-home.
How to do it…
Let's waste no more time and dive right into the process of monitoring your Docker setup with Zabbix:
- First things first, log in to the Linux CLI of your Docker container.
- Add the repository for installing Zabbix components.
For RHEL-based systems:
rpm -Uvh https://repo.zabbix.com/zabbix/6.0/rhel/8x86_64/zabbix-release-6.0-1.el8.noarch.rpm
dnf clean all
For Ubuntu systems:
wget https://repo.zabbix.com/zabbix/6.0/ubuntu/pool/main/z/zabbix-release/zabbix-release_6.0-1+ubuntu20.04_all.deb
dpkg -i zabbix-release_6.0-1+ubuntu20.04_all.deb
apt update
- Now, install Zabbix agent 2 with the following command.
For RHEL-based systems:
dnf install zabbix-agent2
For Ubuntu systems:
apt install zabbix-agent2
- Following installation, make sure to edit the configuration file of the newly installed Zabbix agent 2 with the help of the following command:
vim /etc/zabbix/zabbix_agent2.conf
- Find the line that says Server and add your Zabbix server IP address to the file as follows:
Server=10.16.16.102
- Make sure to save the file and then restart Zabbix agent 2 with the following command:
systemctl restart zabbix-agent2
- Now, we need to add the zabbix user to the Docker group by executing the following command:
gpasswd -a zabbix docker
- Now, navigate to your Zabbix server frontend. Go to Configuration | Hosts and click on the blue Create host button.
- Let's create a new host called Docker containers and make sure to link the Docker by Zabbix agent 2 template to the host.

Figure 13.7 – New Docker host configuration
That's all there is to monitoring Docker containers with Zabbix server. Let's now see how it works.
How it works…
Docker monitoring in Zabbix these days is easy, due to the new Zabbix agent 2 support and default templates. On occasion though, a default template does not cut it, so let's break down the items used.
Almost all the items we can see on our host are dependent items, most of which are dependent on the master item, Docker: Get info. This master item is the most important item on our Docker template. It executes the docker.info item key, which is built into the new Zabbix agent 2. This item retrieves a list with all kinds of information from our Docker setup. We use the dependent items and preprocessing to get the values we want from this master item.
The Docker template also contains two Zabbix discovery rules, one to discover Docker images and one to discover Docker containers. If we check out the discovery rule for Docker containers called Containers discovery, we can see what happens. Our Zabbix Docker host will use the docker.containers.discovery item key to find every container and put this in the {#NAME} LLD macro. In the item prototypes, we then use this {#NAME} LLD macro to discover statistics with another master item, such as docker.container_info. From this master item, we then use the dependent items and preprocessing again to include this information in other item prototypes as well. We are now monitoring a bunch of statistics straight from our Docker setup.
If you want to get values from Docker that aren't in the default template, check out the information collected with the master items on the template. Use a new dependent item (prototype) and then use preprocessing to get the correct data from the master item.
There's more…
If you want to learn more about the Zabbix agent 2 Docker item keys, check out the supported item key list for Zabbix agent 2 under the Zabbix documentation: