
Chapter 4: Working with Triggers and Alerts
Now, what use would all of that collected data in Zabbix be without actually doing some alerting with it? Of course, we can use Zabbix to collect our data and just go over it manually, but Zabbix gets a lot more useful when we actually start sending out notifications to users. This way, we don't have to always keep an eye on our Zabbix frontend, but we can just let our triggers and alerts do the work for us, redirecting us to the frontend only when we need it.
In Zabbix 6, you will find a new trigger expressions syntax compared to Zabbix 5. This syntax has been available since Zabbix 5.4, so this is the first time we'll be working with it in an LTS release. If you've worked with Zabbix before version 6, keep in mind that you might need to get used to this new syntax.
We will learn all about setting up effective triggers with the new expression format and about alerts in the following recipes:
- Setting up triggers
- Setting up advanced triggers
- Setting up alerts
- Keeping alerts effective
- Customizing alerts
Technical requirements
For this chapter, we will need a Zabbix server—for instance, the one used in the previous chapter, which would be the following:
- A server with Zabbix server installed on a Linux distribution of your choice, such as CentOS or Ubuntu, but a distribution such as Debian or any other will suit you just as well
- MariaDB set up to work with your Zabbix server
- NGINX or Apache set up to serve the Zabbix frontend
We will also need a Linux host to monitor so that we can actually build some cool triggers to use.
Setting up triggers
Triggers are important in Zabbix because they notify you as to what's going on with your data. We want to get a trigger when our data reaches a certain threshold.
So, let's get started with setting up some cool triggers. There are loads of different options for defining triggers, but after reading this recipe you should be able to set up some of the most prominent triggers. Let's take your trigger experience to the next level.
Getting ready
For this recipe, we will need our Zabbix server ready and we will need a Linux host. I will use the lar-book-agent_simple host from the previous chapter because we already have some items on that.
We'll also need one more host that is monitored by the Zabbix agent with the Zabbix agent template. We'll use one of the items on this host to create a trigger. This will be the lar-book-agent_passive host from the previous chapter.
On this host, we will already have some triggers available, but we will extend these triggers further to inform us even better.
How to do it…
In this section, we are going to create three triggers to monitor state changes. Let's get started by creating our first trigger.
Trigger 1 – SSH service monitoring
Let's create a simple trigger on the lar-book-agent_simple host. We made a simple check on this host called Check if port 22 is available, but we haven't created anything to notify us on this yet:
- First, let's get started by going to Configuration | Hosts, then clicking the host and going to Triggers. This is where we will find our triggers and where we can create them. We want to create a new trigger here by clicking the blue Create trigger button in the top-right corner.
- Let's create a new trigger with the following information:
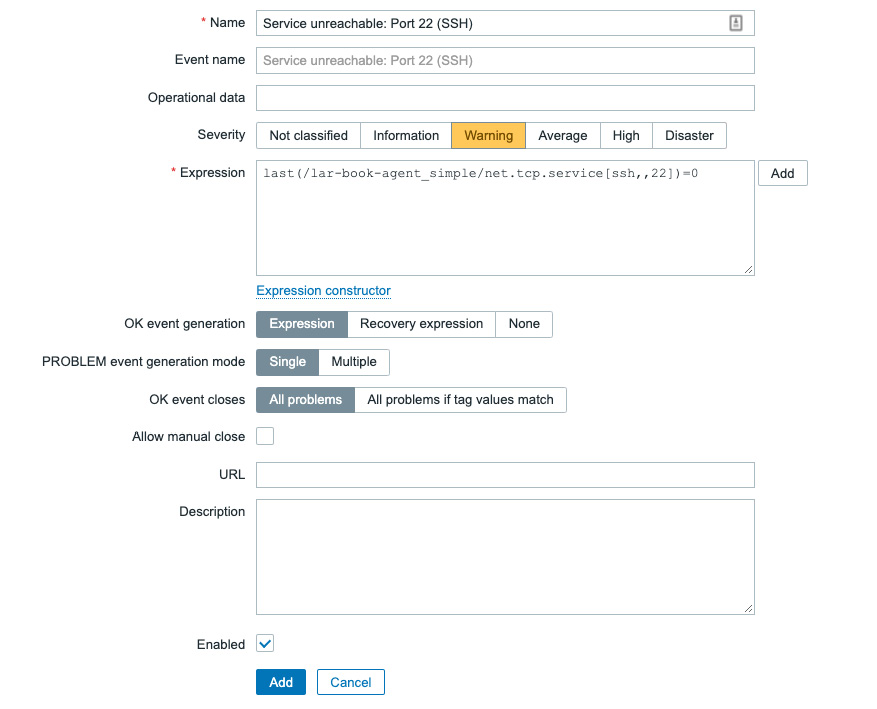
Figure 4.1 – The Zabbix trigger creation page, Service unreachable
- Click on Add and finish creating the trigger. This will create a trigger for us that will fire when our Secure Shell (SSH) port goes down.
- Let's test this by navigating to our host command-line interface (CLI) and executing some commands to shut our Zabbix server off from port 22. We will add an iptables rule to block off all incoming traffic on port 22 (SSH):
iptables -A INPUT -p tcp -i ens192 -s 10.16.16.152
--destination-port 22 -j DROP
- Make sure to change the network card ens192 and the IP address 10.16.16.152 to your own values respectively. You can use the following command to get that information:
ip addr
- Now, if we check out Monitoring | Dashboard, after a while we should see the following:

Figure 4.2 – The Zabbix problem page, port 22 down
Trigger 2 – Triggering on-page visitor count
Now, to create our second trigger, let's ramp it up a bit. If you followed Chapter 3, Setting Up Zabbix Monitoring, in the recipe titled Setting up HTTP agent monitoring, we created an item that polls one of our website pages for its visitor count. Now, what we probably want to do ourselves is keep an eye out for how well all of our readers are doing reaching the web page part of the book and building an item for it:
- Let's navigate to Configuration | Hosts and click the lar-book-agent_simple host.
- Now, go to Triggers and click the Create trigger button. We will build our trigger with the following settings:
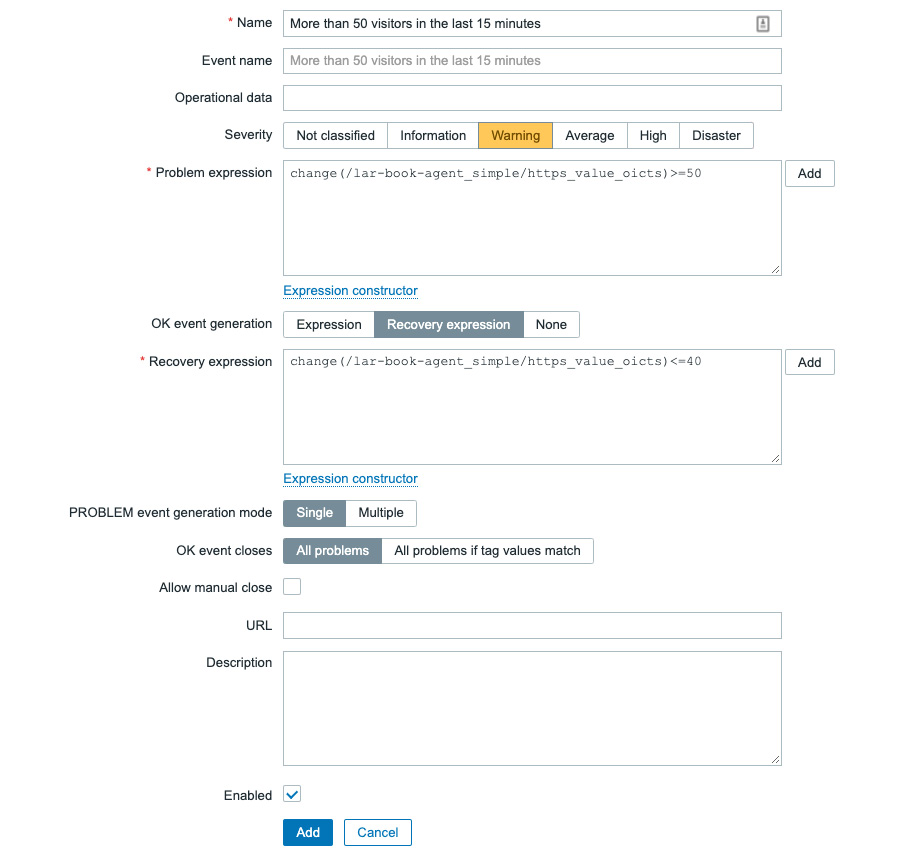
Figure 4.3 – The Zabbix trigger creation page, More than 50 visitors trigger
- Click on Add and finish creating the trigger.
- Now, this might not actually trigger for you in the frontend, but I'll explain to you just how this trigger works in the How it works… section of this recipe.
Trigger 3 – Using multiple items in a trigger
We have seen triggers that use one item, but we can also use multiple items in a single trigger. Let's build a new trigger by using multiple items in the same expression:
- Let's navigate to Configuration | Hosts and click the lar-book-agent_ passive host. Now, go to Triggers and click the Create trigger button.
- We are going to create a trigger with the following settings:
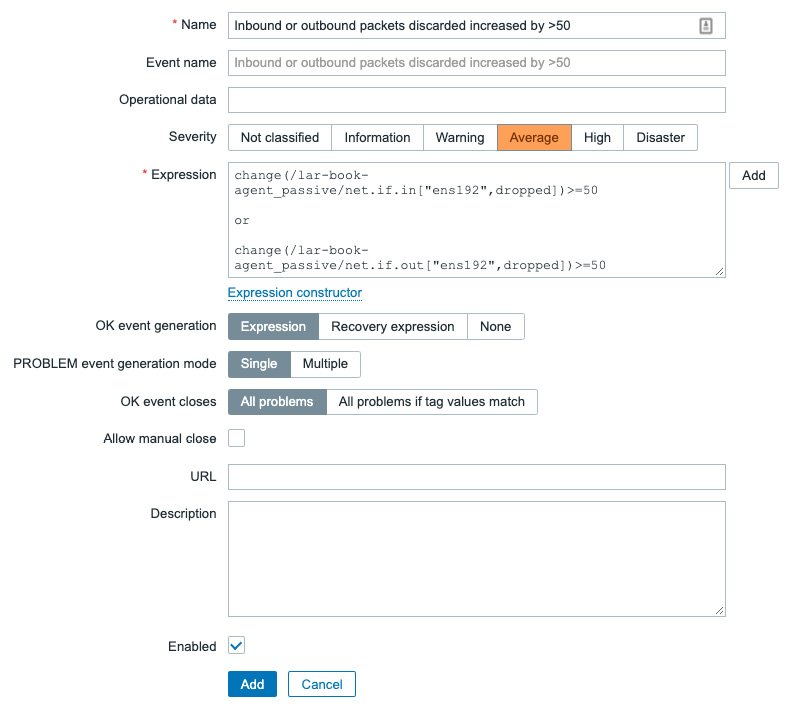
Figure 4.4 – The Zabbix trigger creation page, inbound or outbound packets trigger
- Please note that your item keys might actually need different interface names. In my case, the interface is called ens192, so use the correct name for your interface in its place. Use the following Linux command to get the interface on your host:
ip addr
- Click on Add and finish creating the trigger.
Tip: On the trigger creation page, use the Add button next to the Expression field to add a condition and build your expression easily. For example, we can use the Select button to pick an item from a list. Also very useful, when using the Function drop-down menu, there's a short explanation for every trigger function included:
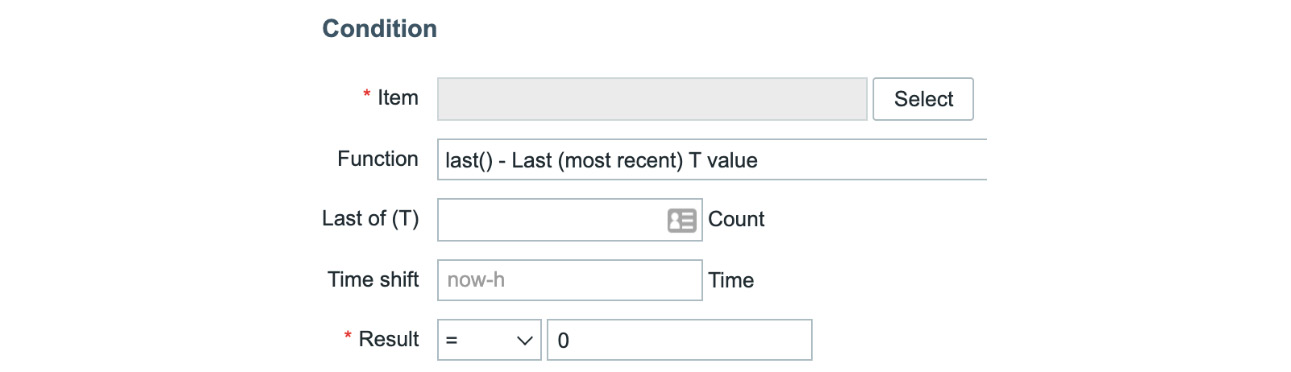
Figure 4.5 – Trigger creation page
How it works…
We need a good understanding of how to build triggers and how they work, so we can create a well-set-up monitoring system. Especially important here is that we make sure that our triggers are set up correctly and we test them well. Triggers are a very important part of Zabbix as they will be informing you of things actively. Configure your triggers too loosely and you will be missing things. Configure them too strictly and you will be overloaded with information.
In all of these triggers, we have also included a trigger severity, as we can see in the screenshot below.

Figure 4.6 – A Zabbix trigger severity selector
These severities are important to make sure your alerts will be correctly defined by importance. We can also filter on these severities in several places in the Zabbix frontend and even in things like actions.
Now, let's discover why we built our triggers as we did.
Trigger 1 – SSH service monitoring
This is a very simple but effective trigger to set up in Zabbix. When our value returns us either a 1 for UP or a 0 for DOWN, we can easily create triggers such as these—not just for monitoring logical ports that are up or down, but for everything that returns us a simple value change from, for example, 1 to 0 and vice versa.
Now, if we break down our expression, we will see the following:
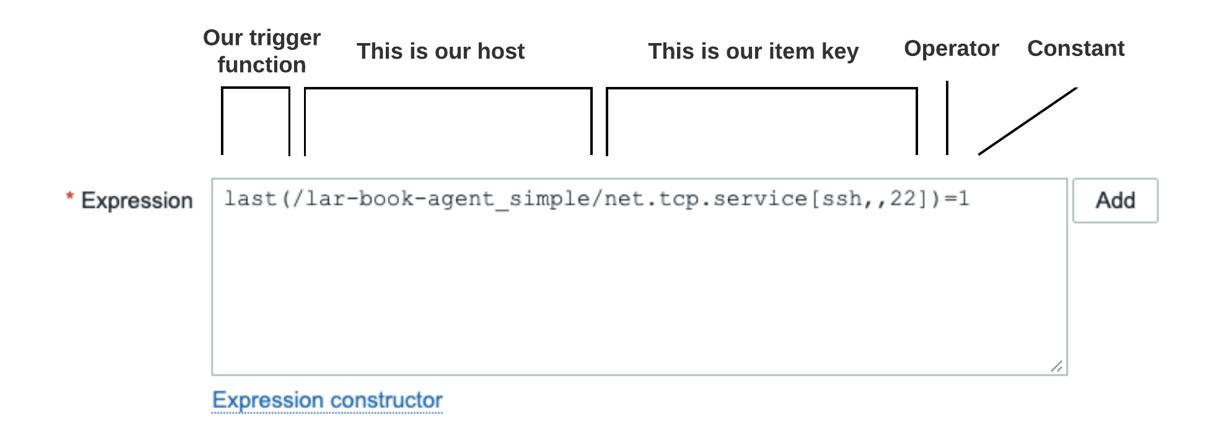
Figure 4.7 – A Zabbix trigger expression, port 22 (SSH)
When building an expression, we have four parts:
- Trigger function: The trigger function is the part of the expression that determines what we expect of the value, such as whether we want just the value or an average value over a period of time.
- Host: The host part of the expression is where we define which host we are using to trigger on. Most of the time, it's simply just the host (or template) we are working on.
- Item key: The item key is the part of the expression where we define which item key we'll be using to retrieve a value on a host.
- Operator: The operator determines what our function will use to calculate the trigger expression against the constant or another item. The operator can be anything like the following:
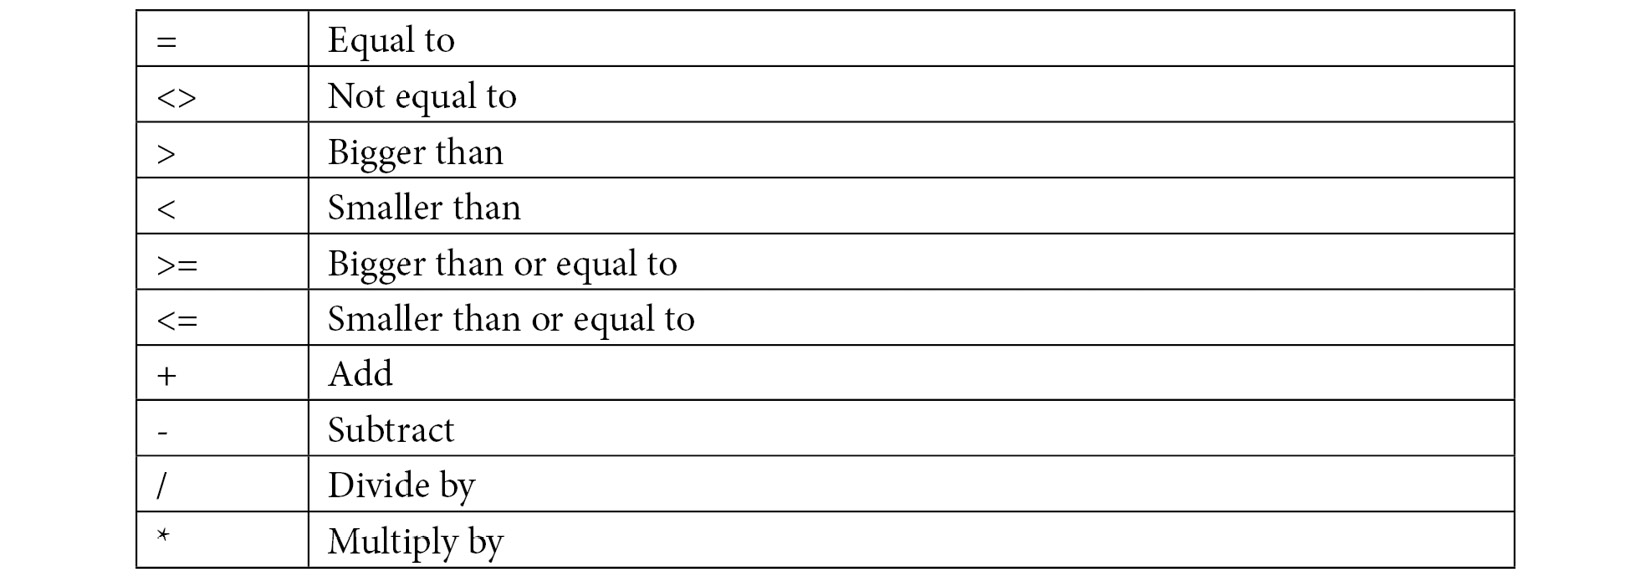
Table 4.1 – Operators and their functions
- Constant: The constant is the actual constant (often a value) that our trigger function uses to determine whether the trigger should be in an OK or a PROBLEM state.
Now, for our first trigger, we defined our host and the item that gives us the SSH status. What we are asking in the trigger function is that we want the last value to be 0 before triggering it.
For this item, that would mean it would trigger within a minute because in our item we specified the following:
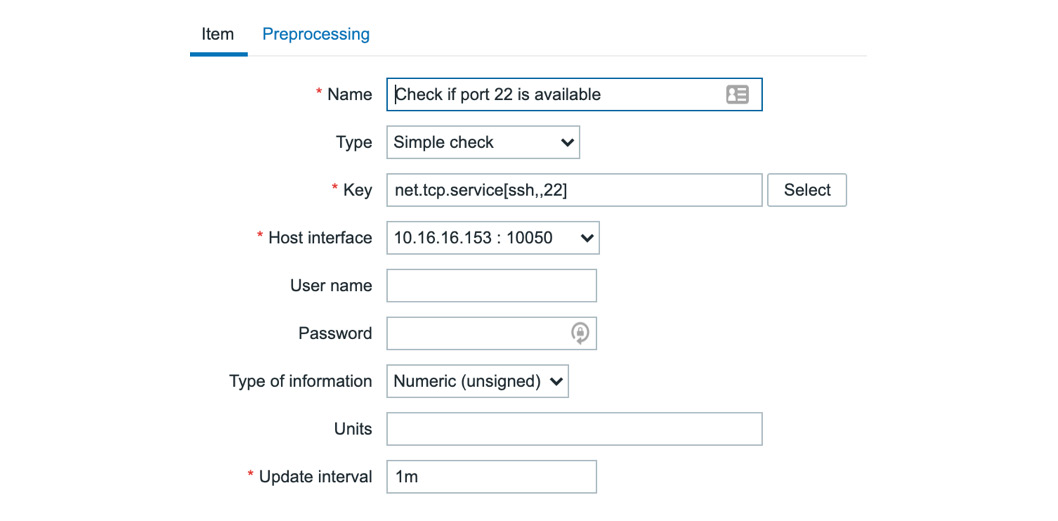
Figure 4.8 – The Zabbix item configuration page, port 22 availability item
Looking at the Update interval field on the Item configuration page, we can determine that when building this trigger, we are expecting our value to be 0 and that it will take a maximum of 1 minute of SSH port 22 downtime due to the 1-minute interval.
Trigger 2 – Triggering on-page visitor count
Now, for our second trigger, we did something different. We not only made an expression for triggering this problem, but also one for recovering from the trigger. What we do in the Problem expression option is define a trigger function, telling our host to compare the last value with the latest value and calculate the difference between the values. We then state this trigger function has to be >=50, meaning equal to or higher than 50.
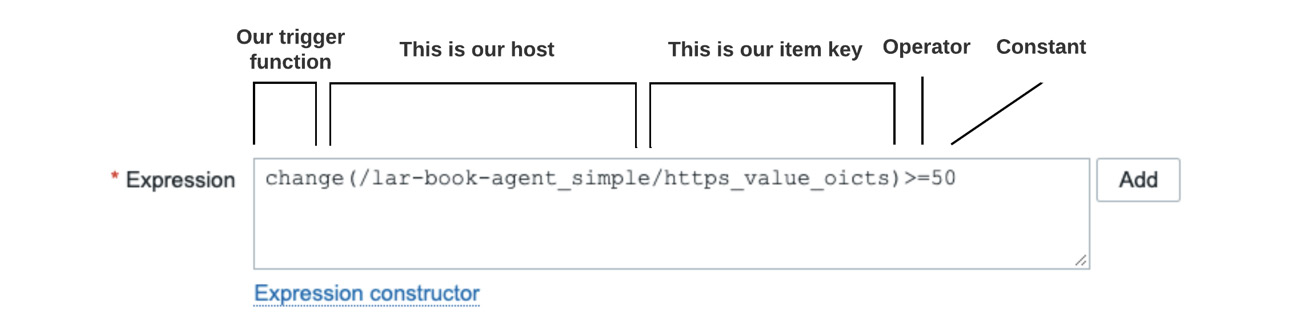
Figure 4.9 – A Zabbix trigger expression, HTTPS check
So, our trigger will only be activated when we have more than or equal to 50 visitors between the last and previous value for this specific page. Now, we could do the same with the previous trigger and let it recover once it hits the same value again, but the other way around. This means that, for this trigger, it would recover once our visitor count between the last and previous value drops below 50 again. But I want to keep this trigger in the PROBLEM state just a little longer.
Therefore, I defined a recovery expression as well. I'm telling it that this problem can only recover if the visitor count between the last and previous value has dropped below or was equal to 40. Check out the recovery expression up close:
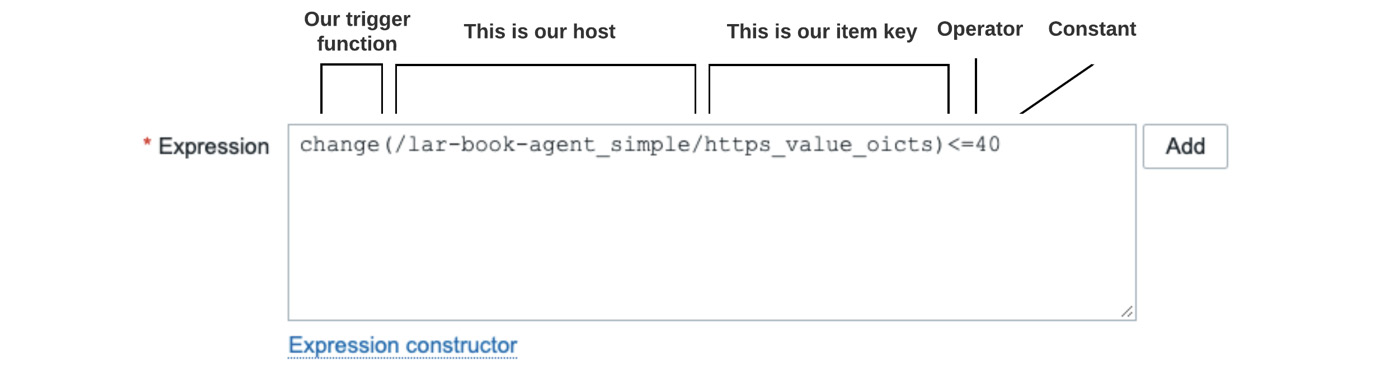
Figure 4.10 – Another Zabbix trigger expression, HTTPS check with different value
Recovery expressions are powerful when you want to extend your trigger functionality with just a bit more control over when it comes back into the OK state.
Tip
You can use the recovery expression for extending the trigger's PROBLEM state beyond what you defined in the Problem expression option. This way, we know we are still close to the PROBLEM state. We define that we only want the trigger to go back to the OK state after we've reached another threshold as defined in the recovery expression.
Trigger 3 – Using multiple items in a trigger
Now, trigger 3 might seem complicated because we've used more than one item, but it's basically the same setup:
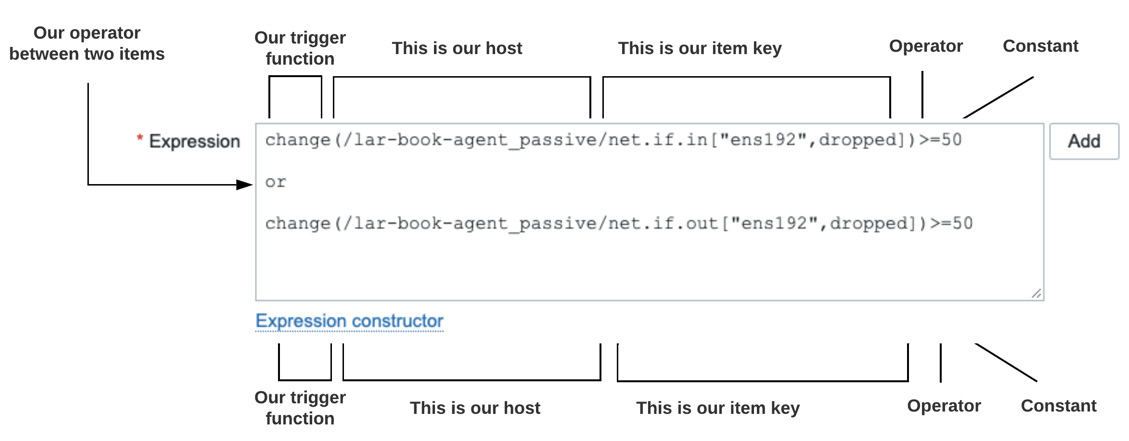
Figure 4.11 – A Zabbix trigger expression using several items
We have the same setup for the expression, with function/host/item key/value. Yet when we are working with multiple items, we can add an or statement between the items. This way, we can say we need to match one of the items before triggering the PROBLEM state. In this case, we trigger when either item reaches above the threshold.
Important Note
In this trigger expression, we have some empty lines between the different item expressions. Empty lines between item expressions are totally fine and actually make for good readability. Use this wisely when building triggers.
Old versus new trigger expression syntax
Now if you've worked with Zabbix before, the next part might be interesting to you. As mentioned in our introduction, there is a big update to expressions within Zabbix. Trigger expressions now work in a new way, which is the same way as you will see in calculated items and other places for a unified experience.
Let's take a look at the old expression syntax as seen in Zabbix 5.2 and older versions:
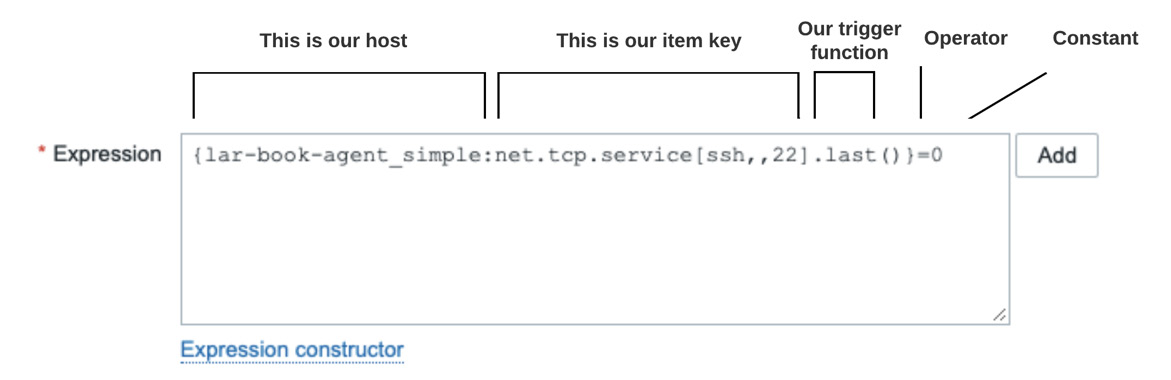
Figure 4.12 – A Zabbix trigger expression using the old syntax
In the old syntax, we always started with a curly bracket and then the hostname or template name. Between the hostname or template name and the item key, we had a colon. Marking the end of the item key we had a dot, but item keys can also include dots themselves. Then after the dot, we have the trigger function followed by the ending curly bracket. Then all we have left is the operator and constant we want to hold the expression against.
As you might see, this could become confusing at times, especially when using dots in item keys. Now let's check out the new trigger syntax:
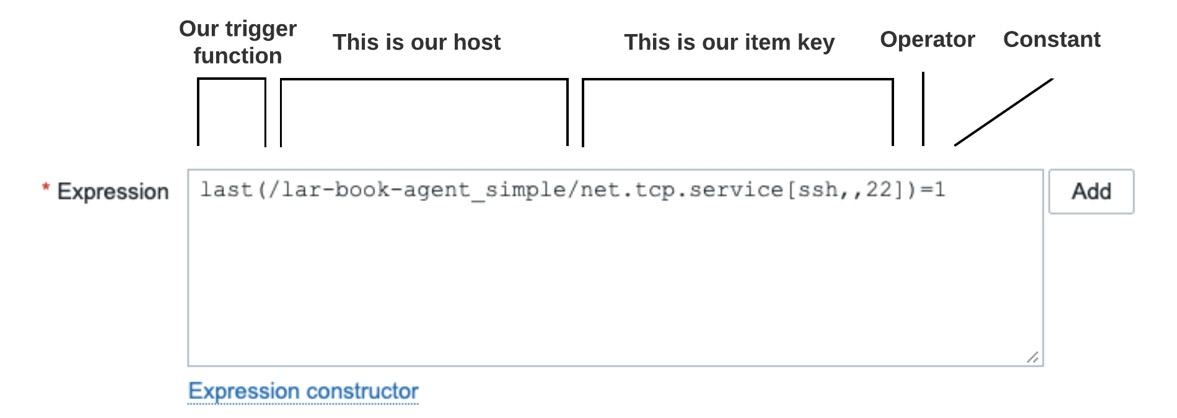
Figure 4.13 – A Zabbix trigger expression using the new syntax
Our new trigger syntax starts off right away with our trigger function; no hassle, just immediately showing you what we're doing with this line. This is followed by a bracket and a forward slash before entering the host or template name. We then use another forward slash to divide the hostname or template name and the item key. We end with a bracket and then all we have left is the operator and value we want to hold the expression against.
Starting with the trigger function makes for a clear indicator of what your line is doing. Putting the hostname or template name into brackets and then dividing it with forward slashes from the item key make for a more cohesive experience when writing expressions. We also don't have confusing extra dots any longer. Altogether a very nice change to the trigger syntax, which in all honesty might take a bit of time to get used to.
It's the small stuff that makes the entire software feel more professional and thought out. Zabbix including changes like these really helps that along.
There's more…
Not only can we match one of the items in a trigger expression—but we can also do an and statement. This way, you can make sure our trigger only goes into a PROBLEM state when multiple items are reaching a certain value. Triggers are very powerful like this, allowing us to define our own criteria in great detail. There's no predefinition—we can add as many and/not/or statements and different functions as we like in the trigger expressions. Customize your triggers to exactly what you need, and suddenly you are going to have a lot more peace of mind because you know your triggers will notify you when something is up.
See also
To know more about trigger expressions, check out the Zabbix documentation. There's a lot of information on which functions you can use to build the perfect trigger. For more details, go to https://www.zabbix.com/documentation/current/en/manual/config/triggers/expression.
Setting up advanced triggers
Triggers in Zabbix keep getting more advanced and it might be hard to keep up. For people working with Zabbix 5.2 or older and upgrading to Zabbix 6, not only is there a new Zabbix trigger syntax but there's also a whole new array of functions.
Let's dive into setting up some more advanced triggers in Zabbix 6.
Getting ready
For this recipe, we will need our Zabbix server ready and we'll need one host that is monitored by a Zabbix agent with the Zabbix agent template. We'll use the items on this host to create triggers. Let's use the lar-book-agent_passive host from the previous chapter.
If you don't have this host from the previous chapters, simply hook up a new host with the default passive Linux monitoring template called Linux by Zabbix agent.
We'll also be touching on some more advanced topics that are discussed later in the book. If you don't know how to use Low-Level Discovery (LLD) for example, it might be smart to dive into Chapter 7, Using Discovery for Automatic Creation, first.
How to do it…
Let's take a look at three more advanced triggers, compared to the three we've seen in the previous recipe: trendavg for going through trend data, timeleft to predict values in the future, and time shifting to compare to the past.
Advanced trigger 1 – Trend average function
First, we'll take a look at one of the newer trigger functionalities, the trend average function:
- Let's start off by creating a new trigger in our frontend. Navigate to Configuration | Hosts and select lar-book-agent_passive.
- Navigate to Triggers and click on the blue Create trigger button in the top-right corner.
- Next to the Expression field, click on the white Add button. Fill out the trigger using the expression builder:
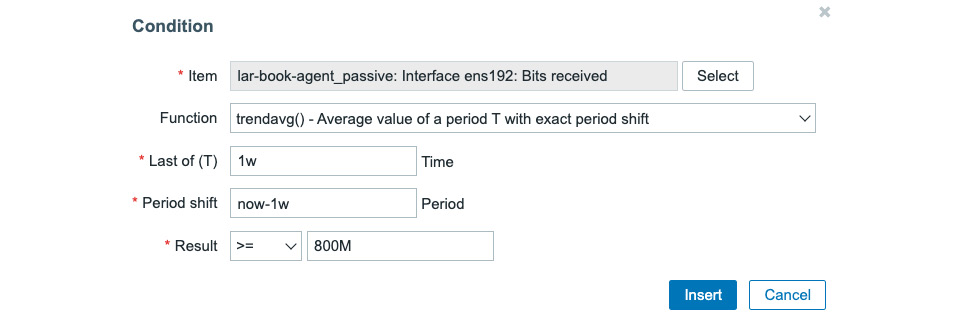
Figure 4.14 – trendavg trigger expression builder

Figure 4.15 – trendavg trigger form filled out
- Now let's click the blue Add button at the bottom of the page to finish creating this trigger.
That's all for creating this trigger. Check out the How it works… section of this recipe to get more information about the trigger.
Advanced trigger 2 – Time left function
Next up is our timeleft function, which is very useful for things like space utilization. Let's take a look:
- We'll create a new trigger in our Zabbix frontend. Navigate to Configuration | Hosts and select lar-book-agent_passive.
- Navigate to Discovery rules and click on Trigger prototype next to Mounted filesystem discovery.
Important Note
In this case, we are creating the trigger prototype directly on the host, using an existing template discovery rule. If you want to apply a trigger like this to every host using a template, make sure to create the trigger on a template level. Furthermore, discovery rules are explained further in Chapter 7, Using Discovery for Automatic Creation, of this book.
- Click on Create trigger prototype.
- Next to the Expression field, click on the white Add button. Fill out the trigger using the expression builder:
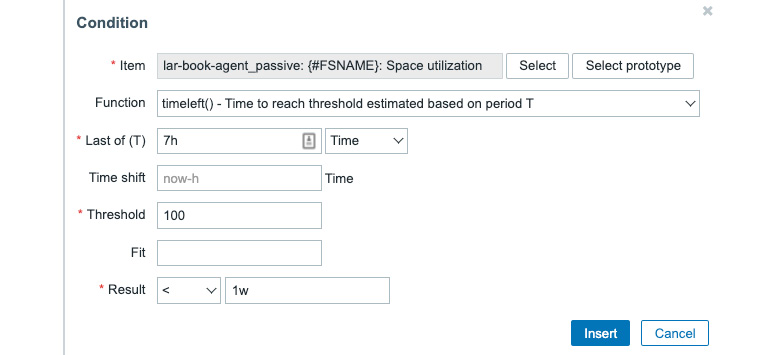
Figure 4.16 – timeleft trigger expression builder
Important Note
Using short intervals in predictive triggers to predict long time periods is not recommended. Make sure to use the right data set for the time period we want to use in relation to the time we want to predict.

Figure 4.17 – timeleft trigger form filled out
- Click the blue Add button at the bottom of the page to finish setting up the trigger.
We now have a new trigger using the timeleft function to tell us when hard disks are filling up within a week. Check out the How it works… section of this recipe to get more information about the trigger.
Advanced trigger 3 – Time shifting using mathematical functions
Lastly, we are going to work with time shifting and in this case, we'll do so in combination with a mathematical function. Time shifting is a little bit of a difficult example, so bear with me.
- Let's navigate to Configuration | Hosts and select our host lar-book-agent_passive.
- Go to Triggers and click the blue Create trigger button.
- Add the following trigger, as seen in the screenshot.
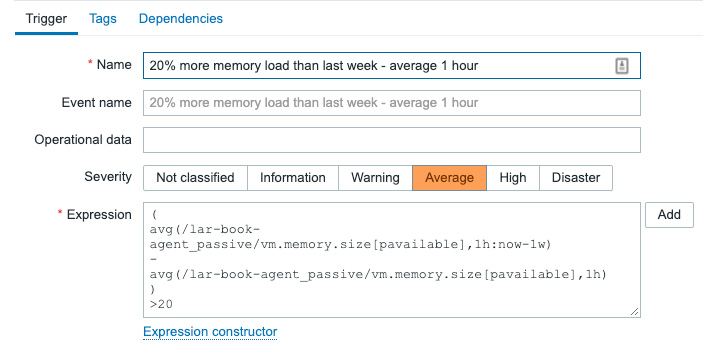
Figure 4.18 – Time shifting average trigger form filled out
This is a very complex trigger to set up, so let's dive right into how it's set up in the How it works… section.
How it works…
Advanced triggers can get very complex. The triggers we have just set up are just the tip of the iceberg. Do not worry if these triggers seem intimidating, as there is plentiful documentation out there to help you set them up, which we can find here: https://www.zabbix.com/documentation/current/en/manual/config/triggers.
It's near impossible to cover every single use case in this book, so the triggers we set up will show you what's possible. Use what you have learned in the examples in your own scenarios, but make sure to apply your own thinking to it.
Advanced trigger 1 – Trend average function
Let's start off the How it works… section with the trend average. Trend average is one of the few trigger functions that use trend data instead of history data. Let's do a short crash course on the history and trend data in Zabbix. History data is the exact value every time an item reaches its configured update interval. Trend data is the average, minimum, and maximum value over one hour (1h) created from the history data and a count of the number of values.
Now, let's look at the available functions for creating triggers using trend data:
- trendavg: For getting the average value from trend values within a time period.
- trendmax: For getting the maximum value from trend values within a time period.
- trendmin: For getting the minimum value from trend values within a time period.
- trendcount: For getting the number of retrieved trend values within a time period.
- trendsum: For getting a sum of trend values within a time period.
As I said, all of these will use our trend values. The values used are stored in a special Zabbix trend cache, for use in our trigger. We've used the trendavg function. Let's check out how we used it in our trigger expression again.
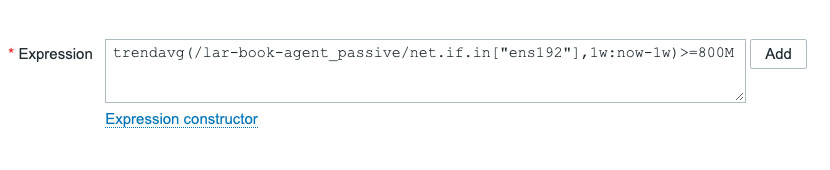
Figure 4.19 – trendavg trigger expression
We start off our trigger with the function trendavg and then the host/template and item key as we've seen earlier in our last recipe. What's new here is the part where we state 1w:now-1w. This is the time period where we state to use a value from one week ago.
What this means is that, if the average value from our trends 1 week ago is above 800 Mbps, then this trigger will go into a problem state.
Advanced trigger 2 – Time left function
timeleft is another very interesting trigger function. We can use timeleft to create triggers that only fire when it expects something to reach a certain threshold in the future. This is called a predictive trigger, as it makes a prediction based on older data.
Let's check out our trigger expression again.
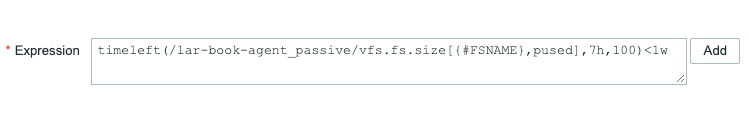
Figure 4.20 – timeleft trigger expression
As we can see, we start our expression as usual: the trigger function, host/template, and our item key. In this case, we combine that with a time period we want to use for our predictive trigger to define its prediction. We use 7h, to tell this expression to use 7 hours of historic data. Combine that with a threshold of 100, to make sure this will trigger if we expect to reach 100% disk space usage. Now we only need one more element to complete this, the expected result, which in this case is <1w.
To sum it all up, this trigger expression looks at 7 hours of historic data and if it expects to reach 100% disk space in less than 1 week, it will go into a problem state, alerting you that you will need to make sure your disks don't run out of space.
Tip: Combine the timeleft trigger function with other functions to limit how many times you get alerted. For example, with disk space, we might expect a disk to fill up in a week, but you might not want to see that unless the used space is at least less than 50 Gigabytes. Add another expression and you are golden:

Figure 4.21 – timeleft trigger function expression
Advanced trigger 3 – Time shifting using mathematical functions
As a Zabbix trainer, time shifting trigger expressions is where I and my students always need to spend some additional time on what they are all doing exactly. This makes sense, as it is one of the more complex expressions, and in this example, we even combined it with some mathematical functions.
So let's take another look at our expression and break it down.
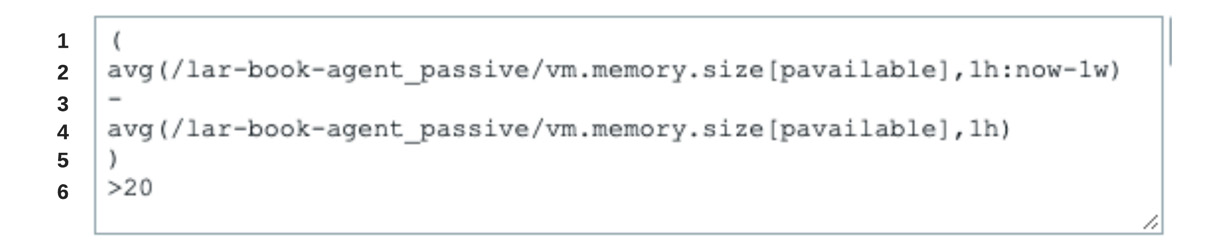
Figure 4.22 – Time shifting trigger expression
I've added line numbers for our convenience. Now we can go over each line and explain what they mean.
- This is the opening bracket for our mathematical statement, using the operator between two items.
- Our first item, using the time shift function. This item will get our memory availability as a percentage from 1 week ago starting from this moment exactly. If the current date and time is Monday the 24th of November at 14:00, it will get the 1-hour average value for Monday the 17th of November between 13:00 and 14:00.
- Our mathematical operator, stating a minus. Meaning, we'll subtract the first item from the second item.
- This is our second item, not using a time shift. This item will be filled with a 1-hour average value of the last hour.
- The closing bracket ends our mathematical statement.
- Finally, an operator and constant. Stating that this trigger will only trigger if the mathematical result is higher than 20.
That's it for looking at the lines. Now that we know what they do, let's take a look at how it performs in a real-life scenario. We're going to fill out the values manually and see if the expression is TRUE or FALSE. TRUE means that there is a problem and FALSE means everything is fine. So the math is as follows:
(Last week - This week) = Result
If the Result is higher than 20 then the expression is True
This expression is: TRUE/FALSE
Filling it out with 80% memory available last week and only 50% available this week, we can see the following happening:
(80 - 50) = 30
If 30 is higher than 20 the expression is TRUE
This expression is TRUE
Let's do it one more time but with 80% memory available last week and 70% this week:
(80 - 70) = 10
If 10 is higher than 20 the expression is TRUE
This expression is FALSE
This is how you should go about setting up your time shifting expressions. Simply use a notebook or whatever you like, write down your expression in simple text for yourself, and do the calculations.
There's more…
Trigger expressions can also be tested within Zabbix itself. If we go to Configuration | Hosts, then Triggers and we select any of our three advanced triggers, we can do a little test. For example, using the time shifting trigger, we can click Expression constructor.
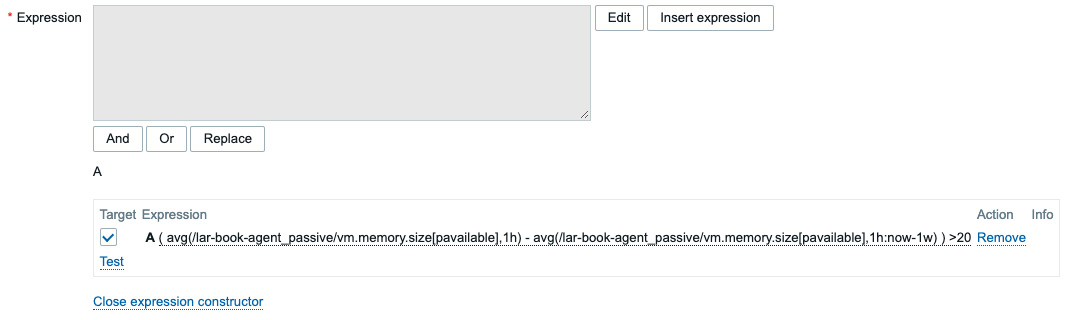
Figure 4.23 – Time shifting trigger expression constructor
Over here, we can select Test and then fill out our values. Let's use the same 80% and 50% we did in the earlier example.
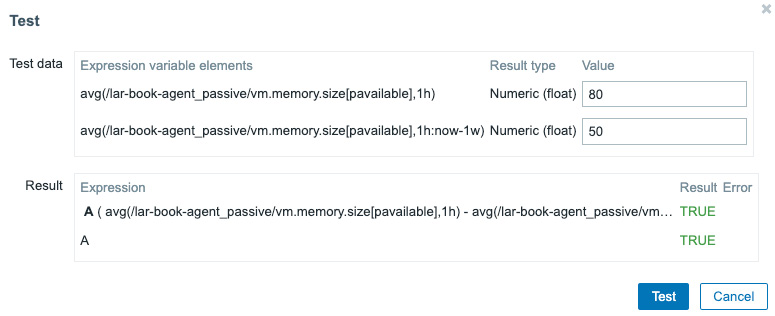
Figure 4.24 – Time shifting trigger expression constructor, Test
As you can see, this will tell us whether our expression ends up being TRUE or FALSE, using any values we want to fill. In short, if you want to be sure your math on paper is doing the same thing directly in Zabbix, use the Expression constructor to test it.
Setting up alerts
Alerting can be a very important part of your Zabbix setup. When we set up alerts, we want the person on the other end to be informed of just what is going on. It's also important to not spam someone with alerts; we want it to be effective.
So, in this recipe, we will go over the basics of setting up alerts, so we know just how to get it right from the start.
Getting ready
For this recipe, we will only need two things. We will have to use our Zabbix server to create our alerts and we will need some triggers, like the triggers from the previous recipe. The triggers will be used to initiate the alerting process to see just how the Zabbix server will convey this information.
How to do it…
- Let's start by setting up our action in the Zabbix frontend. To do this, we will navigate to Configuration | Actions and we will be served with this screen:

Figure 4.25 – The Zabbix Trigger actions page with 1 trigger action
There already is one action set up to notify Zabbix administrators of problem events. In Zabbix 6, a lot of features such as Actions and Media are predefined. Most of the time, all we need to do is enable them and fill out some information.
- We will set up our own action, so let's create a new action to notify a user in the Zabbix administrators group of our new triggers. Click the blue Create action button to be taken to the next page:
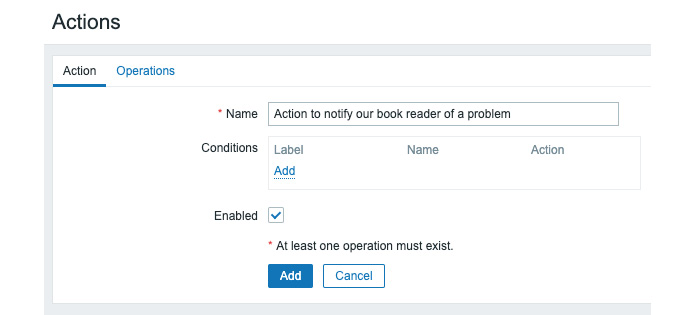
Figure 4.26 – The Zabbix Action creation page, notify book reader
- On this page, we are going to want to check the Enabled checkmark to make sure that this action will actually do something. Make sure to name your action clearly so that you won't have any issues differentiating between actions.
- Now, move on to our Operations tab:
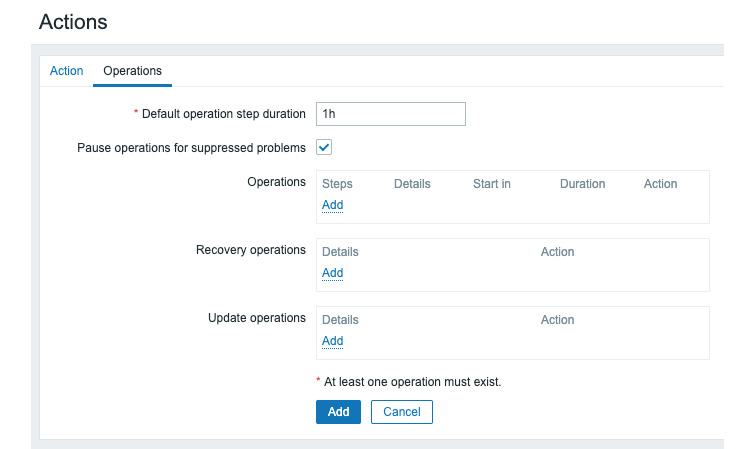
Figure 4.27 – The Zabbix Action creation page at the Operations tab, notify book reader
- The Operations tab is empty by default, so we are going to want to create some operations here. There are three forms of operation that we are going to create here—let's start with the Operations operation by clicking Add:
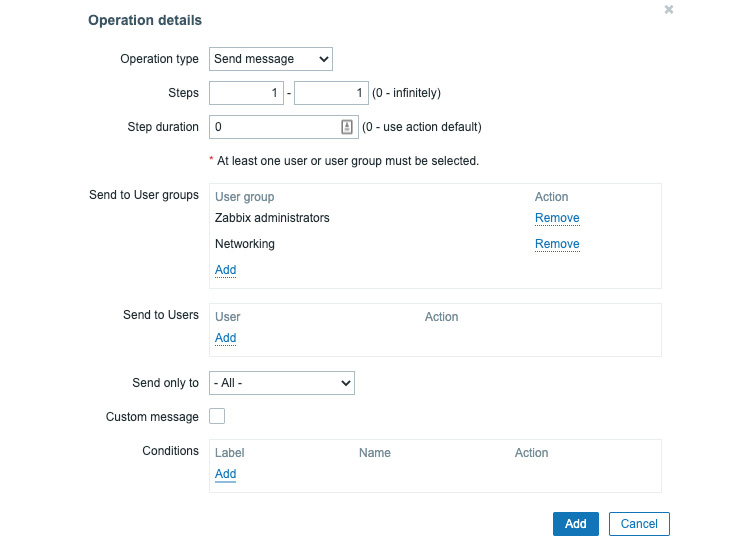
Figure 4.28 – Zabbix Operation details page, notify book reader
- We have the option to add Users and User groups here that we want to alert. If you've followed along with Chapter 1, Installing Zabbix and Getting Started Using the Frontend, we can just select the Networking user group here. If not, selecting just your Zabbix administrators group is fine.
- After clicking the blue Add button at the bottom of the form, we will be taken back to the Actions screen.
- Now, we will create the next operation, named Recovery operations. What we do here is create an operation, as follows:

Figure 4.29 – Zabbix Recovery operations details, notify book reader
- This option will notify all users involved in the initial operation defined earlier. All users that got a PROBLEM generation notification will also receive the recovery this way. Click Add, and let's continue.
Now, if you're like me and you want to stay on top of things, you are able to create an update notification. This way, we know that—for instance—someone acknowledged a problem and is working on it. Normally, I would select different channels for stuff such as this—for instance, using SMS for high-priority alerts and a Slack or Teams channel for everything else.
- Let's click Add under Update operations to add the following to our setup:

Figure 4.30 – Zabbix Update operation details, notify book reader
- We will do the same thing here as we did for the Recovery operations option. Notify all users involved of any update to this problem. After clicking Add here, click the blue Add button again on our Actions screen to finish creating the action.
- Now, the next thing we want to do is create a media type for actually notifying our users of the issue. Go to Administration | Media types, and you will be presented with the following screen:

Figure 4.31 – The Zabbix Media types page with predefined media options
As you can see, there are quite a lot of predefined media types in Zabbix 6. We have them for Slack, Opsgenie, and even Telegram. Let's start with something almost everyone has, though: email.
- Click the Email media type and let's edit this one to suit our needs:
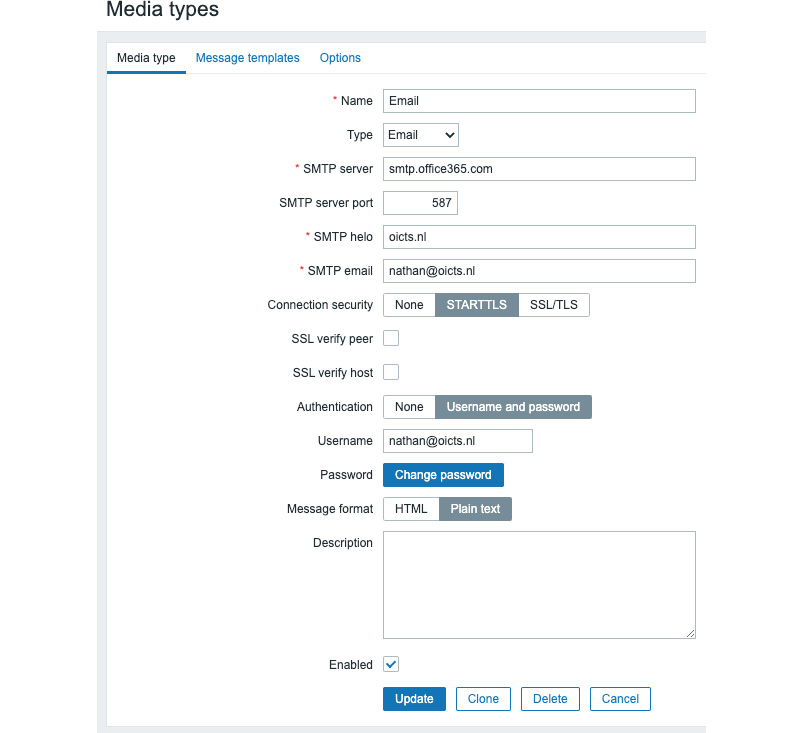
Figure 4.32 – The Zabbix Media type creation page for email
- I set it up to reflect my Office 365 settings, but any Simple Mail Transfer Protocol (SMTP) server should work. Fill in your SMTP settings, and we should be able to receive notifications.
- Be sure to also check the next tab, Message templates. For example, the message template for a Problem generation event looks like this:
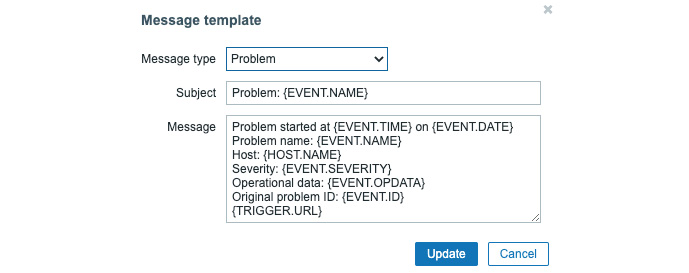
Figure 4.33 – The default Zabbix Message template page for problems
We set this up like this so that we get a message telling us just what's going on. This is fully customizable as well, to reflect just what we want to know.
- Let's keep the default settings for now. Last, but not least, go to Administration | Users and edit a user in the Zabbix administrators or Networking group. I will use the Admin user as an example:
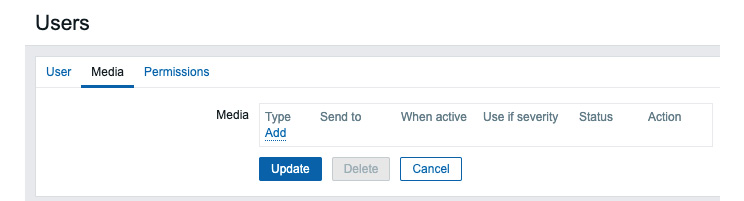
Figure 4.34 – The Zabbix User Media page for the Admin user
- At this Users edit window, go to Media and click the Add button. We want to add the following to notify us of all trigger severities at our email address:
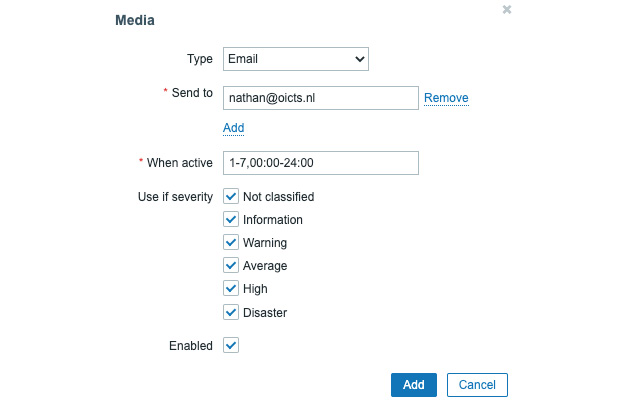
Figure 4.35 – The Zabbix User Media creation page for the Admin user
- Now, click on the blue Add button and finish creating this user media.
How it works…
Now, that's how we set up alerts in Zabbix. You will now receive alerts on your email address, as shown in the following flowchart:
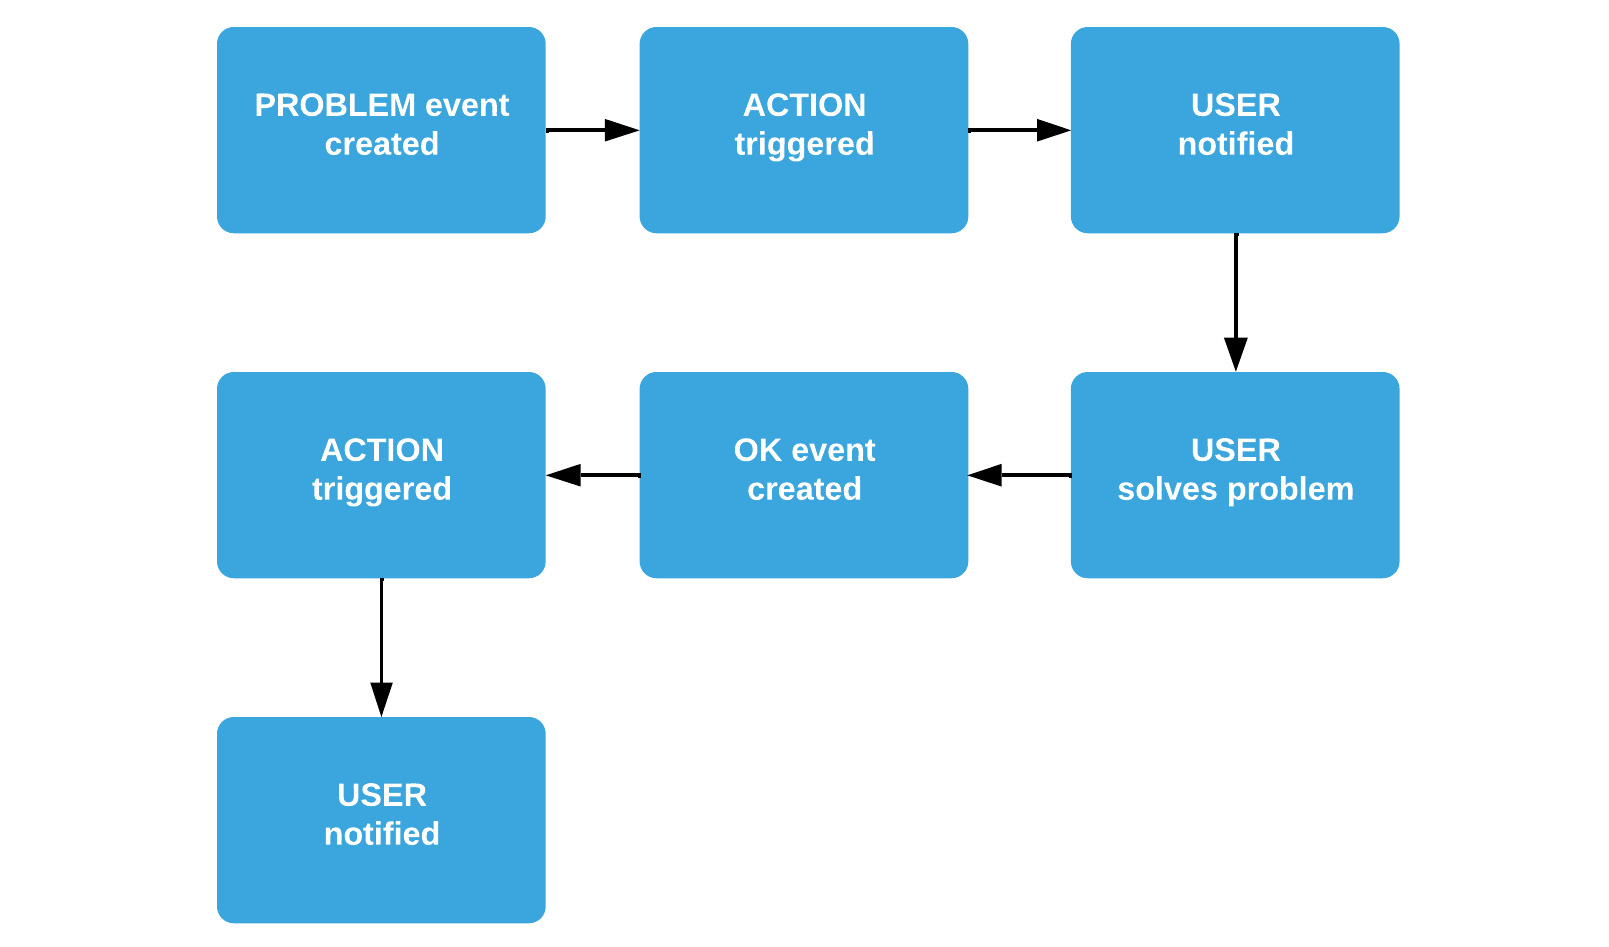
Figure 4.36 – Diagram showing Zabbix problem flow
When something breaks, a PROBLEM in Zabbix is triggered by our trigger configuration. Our ACTION will then be triggered by our PROBLEM event and it will use the Media Type and User Media configuration to notify our user. Our user then fixes the issue (for instance, rebooting a stuck server), and then an OK event will be generated. We will then trigger the ACTION again and get an OK message.
Tip
Before building alerts such as this, make a workflow (as shown in Figure 4.36) for yourself, specifying just which user groups and users should be notified. This way, you keep it clear for yourself just how you will use Zabbix for alerting.
There's more…
There are loads of media types and integrations, and we've just touched the tip of the iceberg by seeing a list of predefined ones. Make sure to check out the Zabbix integration list (https://www.zabbix.com/integrations) for more options or build your own using the Zabbix webhooks and other extensions available.
Keeping alerts effective
It's important to keep our alerts effective to make sure we are neither overwhelmed nor underwhelmed by notifications. To do this, we will change our trigger and the Email media type to reflect just what we want to see.
Getting ready
We will be using Trigger 1 from the first recipe and the default email media type in Zabbix.
Furthermore, of course, we'll also be using our Zabbix server.
How to do it…
To create effective alerts, let's follow these steps:
- Let's get started on Trigger 1, which we created in this chapter's Setting up triggers recipe. Navigate to our lar-agent-simple host by going to Configuration | Hosts and clicking Trigger for the host.
- Here, sometimes people use a different trigger name like the one we see below:
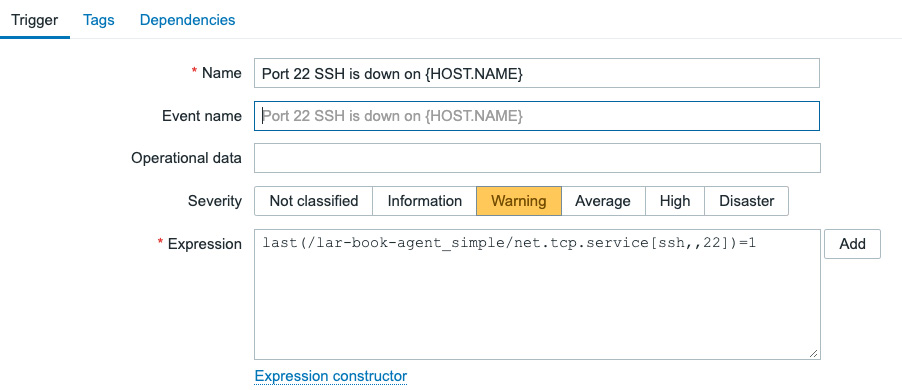
Figure 4.37 – Trigger 1 from the previous recipe
Even when you've used the macro {HOST.NAME} in the trigger, it's quite simple, so fortunately there isn't a lot to change here. If you've used the hostname in the trigger name, we can change the name to reflect a message that is clearer.
- Make sure to use a short and descriptive trigger name, like the following:
Figure 4.38 – New trigger 1 name
- Next, navigate to the Tags page to add a tag for keeping the triggers organized. Let's add the following:
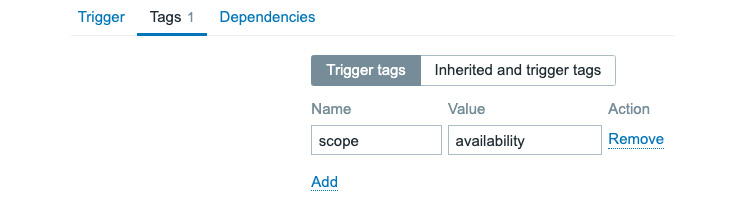
Figure 4.39 – Trigger 1 tags
- Another great way of keeping everything organized is changing media type messages. Let's change a media type to reflect our own structured needs. Navigate to Administrations | Media types and select our media type named Email.
- Select Message templates and click Edit next to our first problem. This will bring us to the following window:

Figure 4.40 – Standard email media type message
Now, Zabbix uses the default configured message under the media type when we do not use a custom message. But if we want to change that message, we can do that here by creating a custom message. Our default under the Email media type looks like the previous screenshot.
- We can change the message on the media type. For instance, if we don't want to see the Original problem ID or when we want a more customized message, simply remove that line, as shown in the following screenshot:
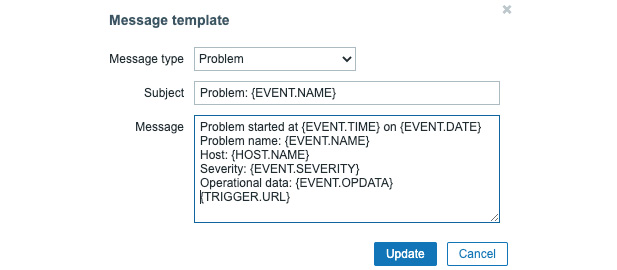
Figure 4.41 – Custom email media type message
How it works…
We've done two things in this recipe. We've changed our trigger name and we've added a tag to our trigger.
Keeping trigger names clear and defined in a structured way is important to keeping our Zabbix environment structured. Instead of just naming our trigger Port 22 SSH down on {HOST.NAME}, we've added standardization to our setup and can now do cool structuration such as this with our future triggers:

Figure 4.42 – Trigger structure diagram
Our triggers are all clear and we can immediately see which host, port, and service are down.
On top of that, we've added a tag for the service that is down, which will now immediately display our service in a clear way, alerting us to exactly what is going on:

Figure 4.43 – Trigger down, structured
In Zabbix 6.0 there is a new tag policy. As we created the item used in the trigger with a component tag and we just added a trigger tag for scope, we followed the new standard. In the problem view in the screenshot above, it becomes immediately apparent that we have a problem affecting the availability of the TCP service SSH. The scope tag generally contains either one of 5 options: availability, performance, notification, security, and capacity.
For more information about the new Zabbix 6.0 tag policy, check out the link below:
https://blog.zabbix.com/tags-in-zabbix-6-0-lts-usage-subfilters-and-guidelines/19565/
Another thing we've done is remove the macro {HOST.NAME} if you've used it before. As we can already see which host this trigger is on by checking the Host field, we do not need to add the {HOST.NAME} macro. We need to keep trigger names short and effective and use the hostname macros in Media or simply use the field already available in the frontend.
We've also changed our action in this recipe. Changing a message on Media types is a powerful way to keep our problem channels structured. Sometimes, we want to see less or more information on certain channels and changing media type messages is one way to do this.
We can also create custom messages on an Action level, changing all the messages sent to the selected channels.
There's more…
What I'm trying to show you in this recipe is that although it might be simple to set up Zabbix, it is not simple to set up a good monitoring solution with Zabbix—or any monitoring tool, for that matter—if you don't plan. Carefully plan out how you want your triggers to be structured before you build everything in your Zabbix installation.
An engineer that works in a structured way and that takes time to build a good monitoring solution will save a lot of hours in the future because they will understand the problem before anyone else.
Customizing alerts
Alerting is very useful, especially in combination with some of the tricks we've learned in this book so far to keep everything structured. But sometimes, we need a little more from our alerts than what we are already getting from Zabbix out of the box.
In this recipe, we'll do a small bit of customization to make the alerts more our own.
Getting ready
For this chapter, all we are going to need is our current Zabbix server installation.
How to do it…
To customize alerts, follow these steps:
- Let's create some custom severities in our Zabbix server to reflect our organization's needs. Navigate to Administration | General and select Trigger displaying options from the side menu:
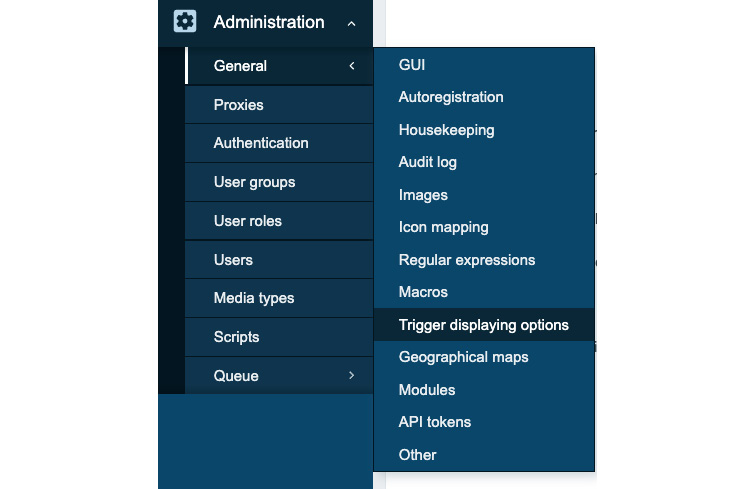
Figure 4.44 – Side menu at Administration | General
After selecting this, we'll be taken to our next page. This window contains the default Zabbix Trigger severities, as shown in the following screenshot:
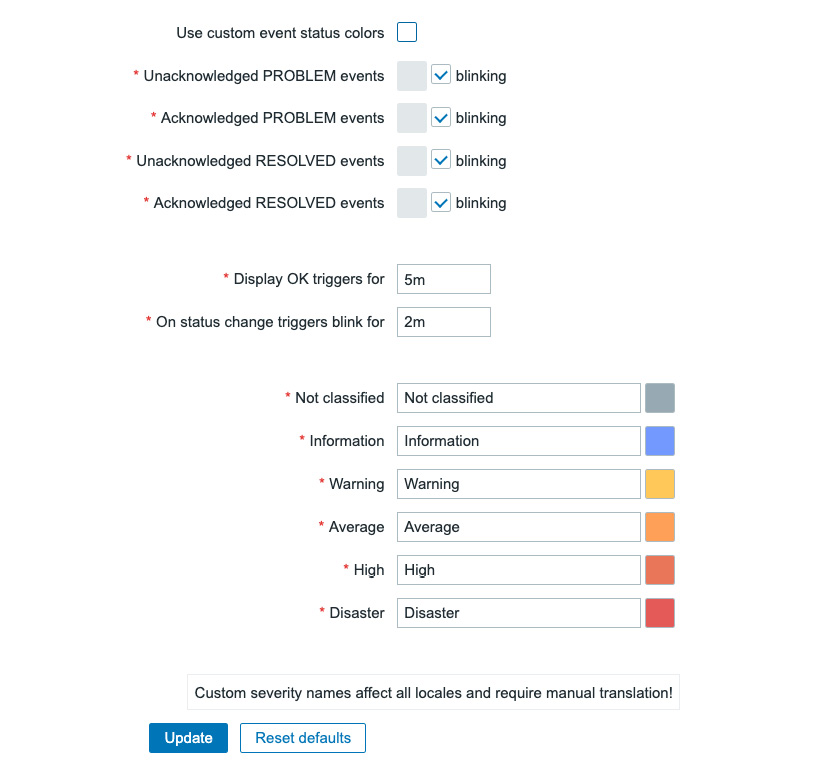
Figure 4.45 – Default Trigger severities window page
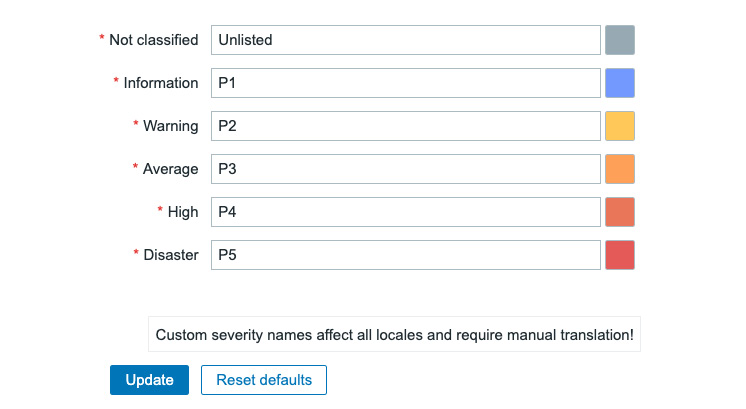
Figure 4.46 – Custom Trigger severities window page
- Do not forget to click the blue Update button at the bottom of the page to save the changes.
How it works…
Not all companies like using terms such as High and Disaster, but prefer using different severities such as P1 and P2. Using custom severities, we can customize Zabbix to make it more our own and thus reflect what we've already been using in different tools, for example.
Changing custom severities is not a necessity by any means, but it can be a good way to adopt Zabbix more easily if you are used to something different.