Chapter 4. Xcode and debugging
In the last chapter, you created your first HelloWorld application and an Apple-Stock application with Xcode. In this chapter, you’ll build on this foundation of iOS application programming with a focus on how to create the custom view class in Xcode and how to use the Debugger to eliminate bugs during the project development lifecycle.
First, let’s work on how to create a custom class together with Xcode. New programs are usually full of new classes. Here are three major reasons you may want to create new classes:
- You can create a totally new class, with different functionality from anything else. If it’s a user interface class, it’ll probably be a subclass of UIView. If it’s not a view class, it’ll probably be a subclass of NSObject.
- You can create a new class that works similarly to an old class but with some standardized differences. This new class will generally be a subclass of the old class.
- You can create a new class that has specific event responses built in. This class will also generally be a subclass of the old class.
4.1. Creating a new class in Xcode
Creating a new class with Xcode is easier than you think. In this example, you’ll create a project called NewClass that will include a new class called LabeledWebView. It will be a subclass of UIView. When LabeledWebView is initialized, it’ll display both a web page and the URL of that web page on the iPhone screen by linking together some existing classes that you used in the last chapter, such as label and webview. It will also display a toolbar at the top behind the label. In a way, it’s similar to the Safari browser window on the iPhone.
Again, you’ll build this project using the Window-Based Application template, and the device family is iPhone.
4.1.1. Creating a new class
When you have your new project going, the process of creating a new class (see table 4.1) is simple, with Xcode doing most of the work for you in creating the file.
Table 4.1. Three steps to create a new class in Xcode
|
Step |
Description |
|---|---|
| 1. Create your new file. | Choose File > New File. Choose the class to use as your parent from among the Cocoa Touch Classes options. Select a filename, preferably an intuitive name reflecting your object. When a subclass prompt window shows up, choose the subclass if there is one. Xcode should automatically create the header and source code files. |
| 2. Modify your files. | If you weren’t able to select your preferred class to subclass, change that now by modifying the parent class in the @interface line of the header file. |
| 3. Import your object. | Add an #import line for your class’s header in whatever file will be using it. |
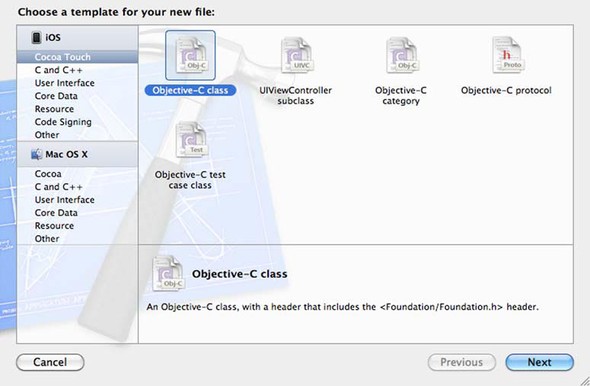
In the NewClass application, choose File > New File to create a new Objective-C class (as shown in figure 4.1). Select Objective-C class, and then click Next.
Figure 4.1. Create a new Objective-C class under iOS.
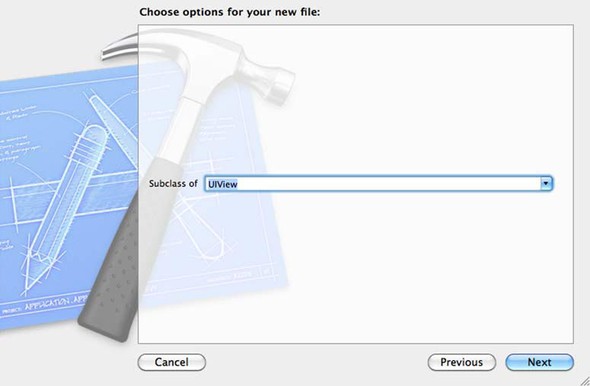
After clicking the Next button, you’ll be presented with a screen to select what class the new class is inheriting from (see figure 4.2). Under the Subclass drop-down menu, choose UIView as the subclass option for the new class, and then click Next.
Figure 4.2. Choose UIView as the subclass option of the new file.
When the Save window appears, type in the name of the new class. In this example, use LabeledWebView.
Now import your new LabeledWebView.h file into your application delegate’s .m (NewClassAppDelegate.m) file:
#import "LabeledWebView.h"
Click the Run button to make sure there are no errors in the code.
Afterward, it’s a simple matter of designing your new LabeledWebView class with the desired functionality. As we mentioned earlier, you’ll create an object that will display both a web page and the URL of that web page on the iPhone screen by linking together some existing classes.
The process has three steps, all of which we touch on in this section: you need to write your new header file, write your new source code file, and use the new class in your program.
4.1.2. The header file
As usual, you have the start of a header file already, thanks to Xcode. The following listing shows how to expand it to create your new class.
Listing 4.1. Header file for the LabeledWebView class
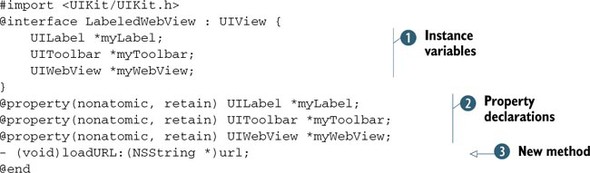
Within the header file, you make use of some common patterns that you saw back in the last chapter. First, you declare some
instance variables ![]() that you want to use throughout your class. In this case, you have a label, a toolbar, and a web view. Then you define those
instance variables as properties
that you want to use throughout your class. In this case, you have a label, a toolbar, and a web view. Then you define those
instance variables as properties ![]() .
.
Finally, you declare a method loadURL: ![]() that you want to make available outside the class. You plan to use this method to define the URL for the web view. Now you’re
ready to edit the source code.
that you want to make available outside the class. You plan to use this method to define the URL for the web view. Now you’re
ready to edit the source code.
4.1.3. The source code file
The source code file contains the guts of your new class. With all the new instances and properties declared in the header file, it’s time to define the content inside the source code, as shown in the following listing.
Listing 4.2. Source code file for a new class
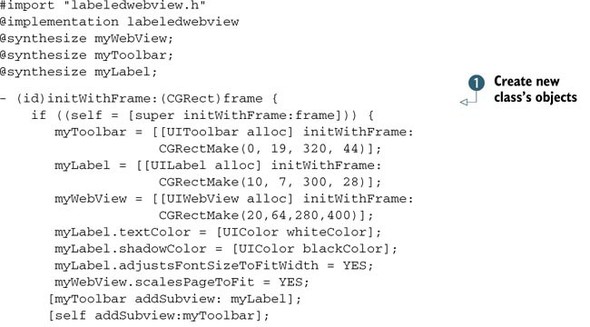
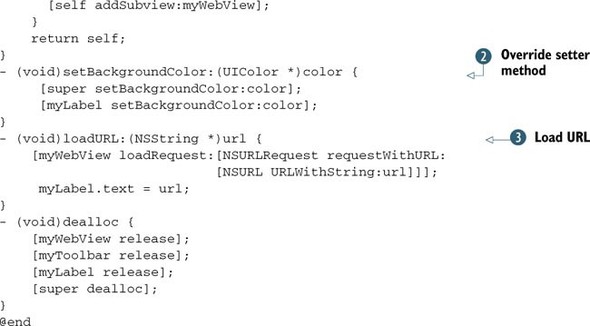
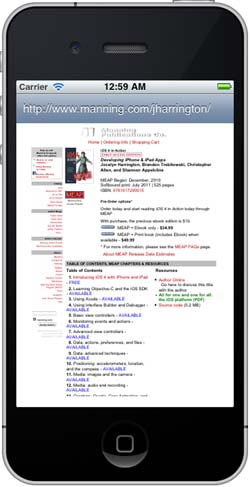
Figure 4.3 shows the results of the class creation in use. Next, we’ll explain the parts of the code that get you there before you put it all together in the app delegate.
Figure 4.3. Brand-new class makes it easy to display a URL and call it up on the screen. You’ve finished the first step in building a web browser.
Inside the source code, you first synthesize the three properties so the compiler will automatically create the setter and
getter methods. You put together the pieces of your new class in the initWithFrame: method. As usual, you call the parent’s init. Then, you create the three objects your new class will contain: a label, a
toolbar, and a web view ![]() . After setting some basic values for each, you make them subviews of your new LabeledWebView class. The code in
. After setting some basic values for each, you make them subviews of your new LabeledWebView class. The code in ![]() will override the setter method for background color property. When it’s called, you first pass the message to super and then set the label background color to match that of the parent view.
will override the setter method for background color property. When it’s called, you first pass the message to super and then set the label background color to match that of the parent view.
The real work occurs in the new loadURL: method ![]() . You should be familiar with this method because you used a similar method to load the URL in the AppleStock application.
(You can find more information on how webView loads URLs in chapter 14.) That’s all you need to generate a fully functional web page, which is pretty amazing. If you play with it, you’ll find
that it has much of the iPhone’s unique output functionality: you can pinch, tap, and zoom just like in Safari. You finish
the method by setting the label to match your URL.
. You should be familiar with this method because you used a similar method to load the URL in the AppleStock application.
(You can find more information on how webView loads URLs in chapter 14.) That’s all you need to generate a fully functional web page, which is pretty amazing. If you play with it, you’ll find
that it has much of the iPhone’s unique output functionality: you can pinch, tap, and zoom just like in Safari. You finish
the method by setting the label to match your URL.
Your new class ends with the standard dealloc: method, where you clean up the objects that you allocated as part of your object creation.
In less than a page of code, you created an object that would require a lot more work if you were programming it by hand. So many tools are available to you in the iOS SDK that knocking out something like this is, as you can see, simplicity itself. You could definitely improve this example: you could link into the web view’s delegate protocol to update the label whenever the web view changes. But for now, we’re pleased with this example of Safari browser mockup.
4.1.4. Linking it in
Creating a new class isn’t enough: you also need to use it. Add the bolded code in the following listing into the application delegate (NewClassAppDelegate.m) to use your new subclass.
Listing 4.3. Using the new class in the app delegate file
#import "NewClassAppDelegate.h"
#import "LabeledWebView.h"
@implementation NewClassAppDelegate
@synthesize window=_window;
- (BOOL)application:(UIApplication *)
  applicationdidFinishLaunchingWithOptions: (NSDictionary *)launchOptions
{
    LabeledWebView *myBook = [[LabeledWebView alloc]
    initWithFrame:[[UIScreen mainScreen] bounds]];
    [myBook loadURL:@"http://www.manning.com/jharrington/"];
    [myBook setBackgroundColor:[UIColor clearColor]];
    [_window addSubview:myBook];
    [myBook release];
    [self.window makeKeyAndVisible];
    return YES;
}
...
The code is pretty simple. First, initialize the subclass of UIView with the full screen size. Then load the URL of this book, iOS 4 in Action, and set the background color to transparent. The most important step is to add this new subview to the window.
That’s all! Click the Run button on Xcode toolbar, and without errors during the build you should see the iOS Simulator launch with the screen shown in figure 4.3.
Now you know how to create a new Objective-C file under Xcode. In the next section, we’ll cover the details of creating a new nib.
4.2. Creating objects with Interface Builder
In the last section, you built your first UIView subclass: the LabeledWebview class. You’ll be building a lot more subclasses in your application development, and you’ll often want to use Interface Builder to create a new nib file so you can connect outlets and actions to the object directly. Additionally, you don’t need to crunch numbers for each subview’s size because Interface Builder provides a visual design experience. How do you create a new nib file in Interface Builder? We’ll cover the details in this section.
4.2.1. Creating new nib files
To create a new nib file under Xcode, navigate to the menu under Xcode, and choose File > New File to begin. Select User Interface under the template prompt window, as shown in figure 4.4.
Figure 4.4. Create a new nib file under Xcode.
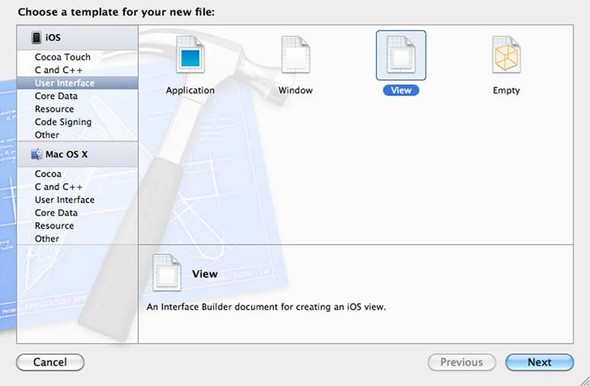
You’re then asked to choose a template: Application, Window, View, or Empty. You’ll most often create new .xib files for view controllers, in which case you should select View. (You’ll learn more about view controllers in chapter 5.) To make your new .xib file part of your existing project, save the .xib file to the main project directory.
Table 4.2 outlines the two-step process. We say that you start the process with an “appropriate object.” For a totally new object, this will probably be the blank object. But if you’re making a subclass of an existing object, you should start with that object.
Table 4.2. Creating a new proxy object to link to in Interface Builder takes a couple of steps.
|
Step |
Description |
|---|---|
| 1. Create a new object. | From the Controllers section of the library, drag an appropriate object to the nib document window. |
| 2. Change the class. | Open the Identity inspector tab, and change the class name to your new class. |
After you type your new subclass name into your object’s Class field (CustomWebView for example), things are automatically linked up. You’ll use this technique in future chapters.
4.2.2. Initializing Interface Builder objects
Eventually, you’ll want to do some initialization when an Interface Builder object is created. But if you try to build your setup into a standard init method, it won’t work. As we’ve mentioned, Interface Builder objects use a special init method called initWithCoder:. You must create it by hand, as follows:
- (id)initWithCoder:(NSCoder *)decoder {
    if (self = [super initWithCoder:decoder]) {
        // Setup code goes here
    }
    return self;
}
Other than its decoder argument (which you should be able to ignore), it should work like any other init method.
4.2.3. Accessing .xib files
Finally, we come to the .xib file. We’ve taken it for granted so far, but there are ways you can specify a different .xib file than MainWindow.xib and even ways to specify the use of multiple .xib files.
The Main Nib File
The main .xib file is defined in <project name>-Info.plist, which you saw in the last chapter. You can look at its contents in Xcode, or you can read the XML from the command line or any text editor. It’s easy to find where the main .xib file (or rather, its compiled nib twin) is defined:
<key>NSMainNibFile</key>
<string>MainWindow</string>
If you ever need to change the name of your main .xib file, do it here, using either Xcode or any text editor. Generally, we’ll leave it the way it’s generated by the project template.
Multiple Files
As we’ve mentioned, a .xib file should generally lay out the contents of a single program view. Although this has been fine for the programs so far, it becomes a limitation when you want to create more-complex programs. Fortunately, it’s easy to build multiple .xib files into a single program.
New .xib files are usually loaded through view controllers, which is the topic of the next chapter. As we’ve discussed previously, view controllers tend to control a pageful of objects, and it makes sense that they use .xib files to help manage that. To use a new .xib file for a new page in your program, all you need to do is associate the new .xib file with the appropriate view controller.
The easiest way to do that is through Xcode’s File menu. Select File > New File, and under Cocoa Touch Class select the UIViewController subclass. Make sure you select the With Xib for User Interface check box.
If you create a view controller, you can link in a new .xib file through its init method:
FlipsideViewController *viewController = [[FlipsideViewController alloc]
        initWithNibName:@"FlipsideViewController" bundle:nil];
If you feel a little fuzzy on the concept of view controllers, don’t worry, because we’re about to dive into this topic wholeheartedly in chapter 5. For now, note this connection between view controllers and the nib files.
4.2.4. More tips under Xcode
There’s one more important window under Xcode we haven’t covered yet: the Organizer window. You can launch the Organizer (see figure 4.5) by choosing Window > Organizer or by clicking the Organizer button on the Xcode toolbar.
Figure 4.5. Organizer window with the Documentation tab selected

As shown in figure 4.5, the Organizer window is used for organizing your projects and reading documentation. You can look up the Xcode 4 Developer documentation here as well.
For iOS projects, the Organizer window is also used for managing devices for development. You’ve learned how to run the application on the iOS Simulator, but this is the solution for launching the application on your iPhone or iPad.
Note that if you haven’t created the certificate file under the iOS Provisioning Portal, you need to first head over to the iOS developer member center at http://developer.apple.com/membercenter/; then follow the step-by-step instructions under the iOS Provisioning Portal to generate the certificate for both Developing and Distributing Provisioning profiles (needed for development/personal testing and ad hoc distribution/submitting to the App Store, respectively).
Now head back to the Xcode Organizer window, go to the Devices tab, select Provisioning Profiles, and then select the Automatic Device Provisioning option (you may need to click the Refresh button to allow the new provisioning file to be downloaded to your Mac, as shown in figure 4.6).
Figure 4.6. Select Automatic DeviceProvisioning under the Xcode Devices Organizer window.
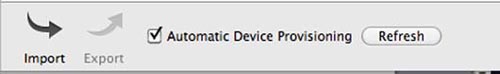
Xcode will use your login credentials to automatically generate the provisioning file under the iOS Provisioning Portal. Now you can plug in your device and select Use for Development to allow Xcode to automatically provision the device for development.
In the next section, we’ll cover another important aspect of iOS development: debugging. You may not need all the debug functions under Xcode right now, but debugger knowledge will be handy when you inevitably encounter a bug in your application.
4.3. Debugger and Instruments
Now that we’ve covered some of the fundamental features in Xcode, let’s talk about an important part of writing an application: debugging. Although you may have some reservations about the debugging process as a developer, it’s critical to discover and remove bugs in the product development lifecycle.
Xcode provides a handy tool for debugging: Debugger. The iOS SDK package provides another important application: Instruments. These tools will provide you with a better debugging experience.
In this section, we’ll cover the basics of Debugger in Xcode, such as monitoring the value of an object under the console window and setting up a breakpoint. Then we’ll explore the functions under Instruments.
4.3.1. Fix-it function
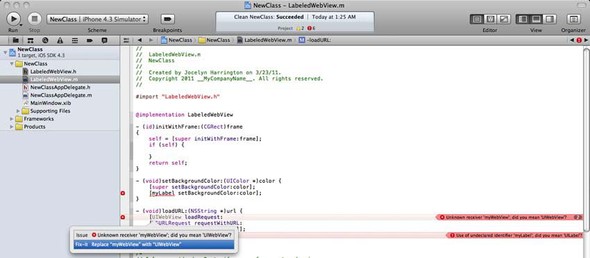
While you’re typing the demo application in Xcode, you’ll notice the Fix-it function, as shown in figure 4.7. Under the hood, when your target is set to use the LLVM compiler, Fix-it scans your source code as you type. It’s handy for correcting mistakes. When there’s an error, you can see the red highlight, and if you click the icon in the gutter, you may discover the solution to your bug.
Figure 4.7. Fix-it solutions under Xcode
Another way to discover bugs early is by using static analysis under Xcode.
4.3.2. Analyze
Use static analysis to examine the semantics of your code to capture bugs early. Xcode lets you perform the analysis, examine the results, and edit your source files all from within the workspace window.
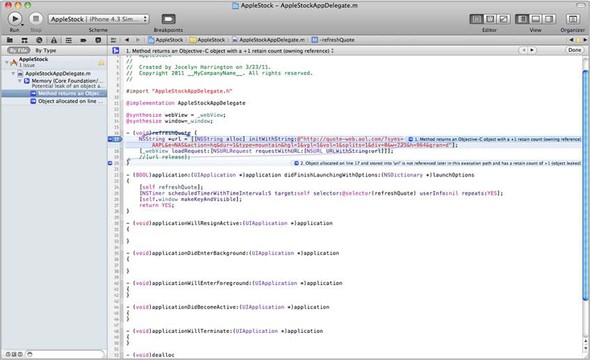
In Xcode, navigate to Product > Analyze (or click the Run button on the Xcode toolbar to activate the drop-down menu and then select Analyze). By static-analyzing code, you may discover a potential leak of an object or mismatching arguments, as shown in figure 4.8.
Figure 4.8. Static analysis under Xcode reports a potential leak for an object.
When you need to trace the variables inside the project, it’s time to use the Debugger.
4.3.3. Debugger essentials
Under the Xcode menu, navigate to View > Show Debug Area (or click the debug view on the Xcode toolbar). When you select to show the debug area, Xcode will automatically launch the Debugger toolbar on the top, the variable window at lower left, and the console window at lower right, as shown in figure 4.9.
Figure 4.9. Debugger console window
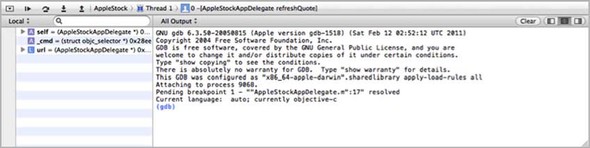
The Xcode Debugger is a graphical interface for GDB, the underlying debugger used by Xcode. Now let’s add a breakpoint to the code. You can add a breakpoint at any line in your code by single-clicking at the line number in the gutter. When that line of code is about to execute during runtime, Xcode will pause at the breakpoint so you can trace local variables, function output, and so on. Once a breakpoint is added, you’ll see a blue breakpoint marker at the line number. When the Debugger is running with breakpoints on, you can trace the program’s variables in the Debugger window, as shown in figure 4.10.
Figure 4.10. The Debugger window with breakpoints on pause
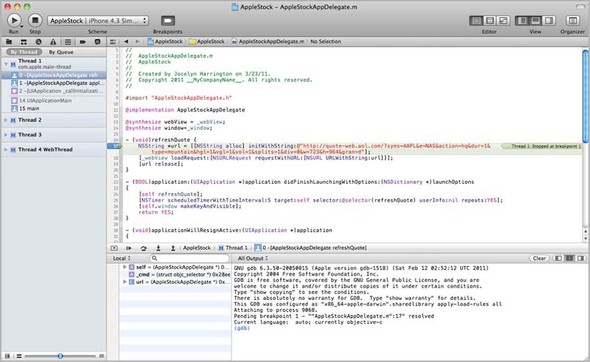
When the code is paused at the breakpoint, you can use the toolbar to step into the code line by line. If you select a thread or a stack within a thread in the debug bar, Xcode will display the corresponding source file or assembly code in the main editor. Notice that all of the variables will show up in the variable window on the bottom left.
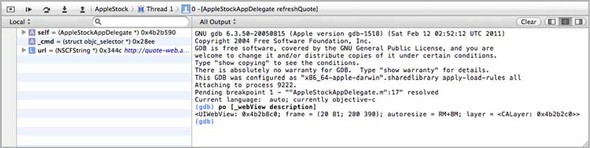
Although you can read out the memory address for every variable, it would be nice to read out the content from the NSString on the fly. You can print out the object by typing po under the GDB console window. For example, try printing out the web view’s description at the breakpoint, as shown in figure 4.11.
Figure 4.11. How to print out an object’s details in the Debugger console window
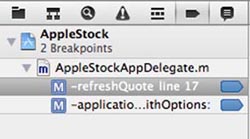
You can also manage all the breakpoints under the Breakpoints Navigator, as shown in figure 4.12.
Figure 4.12. Breakpoints Navigator window
In the next section, we’ll cover some basics under Instruments.
4.3.4. Running Instruments from Xcodeb
In the previous section, you learned how to use the Debugger under Xcode; but certain memory-allocation bugs are hard to discover with the Debugger, and that’s when Instruments is useful. Under Xcode, navigate to Product > Profile (or click the Run button to bring up the drop-down menu, and then select Profile). Selecting Profile will launch Instruments with the application running on the iOS Simulator, as shown in figure 4.13.
Figure 4.13. Launching instruments from Xcode
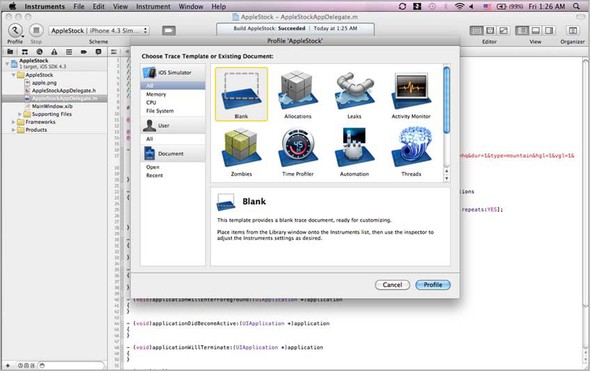
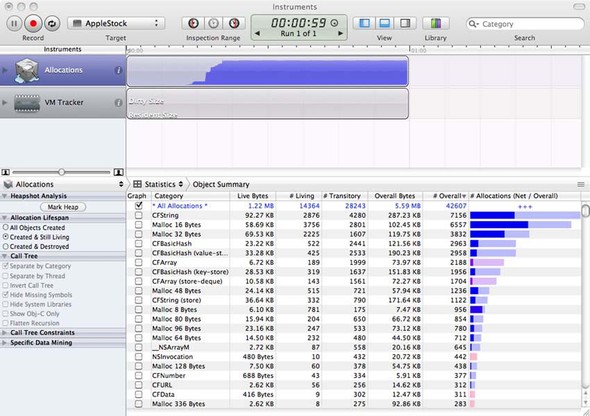
Select Allocations under the iOS Simulator. With this runtime memory-analysis tool, you can monitor and improve memory allocations (see figure 4.14).
Figure 4.14. Use Allocations under Instruments to analyze the memory allocations during application runtime.
Leaks is another trace tool under Instruments, which comes in handy for memory-related bugs. Select Leaks when Instruments launches under the template prompt window. Leaks runs with a sample of every 10 seconds by default; you can manually check for leaks by clicking the Check for Leaks Now button on the bottom-left control panel (see figure 4.15).
Figure 4.15. Instruments with Leaks to trace leaked blocks
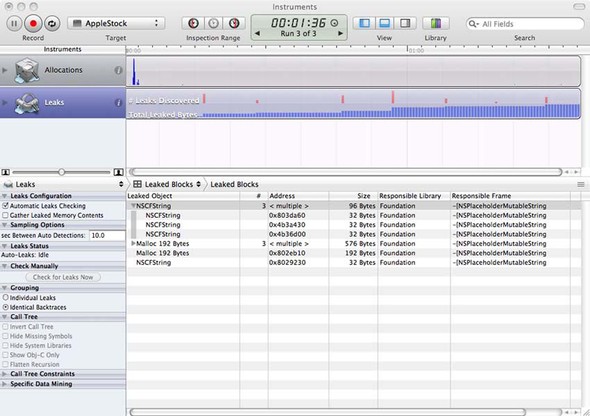
Once you find a leaked object, double-click that object. Instruments will show you the function name related to the memory leak.
In this section, we covered some essential debugging tools for your application development. Try to play with each tool in order to discover your preferred debugging procedure.
4.4. Summary
In the previous chapter, we showed you how to create some simple programs using Xcode. You also have access to Interface Builder, a powerful graphic design program that allows you to lay out objects by dragging and dropping and then linking those objects back to Xcode for use there.
The example you created in this chapter, which focused on creating a new class in Xcode, provided a demo of how to mock up the iPhone Safari browser with a subclass of UIView. You may not use the Debugger for your application right away, but it will come in handy when the time comes for debugging.
Although you now have the fundamental development tools of the iOS SDK well in hand, we’ve neglected two of the SDK building blocks you’ll use to create projects: view controllers and events. In the next three chapters, we’ll cover those topics, and in the process, we’ll complete our look at the iOS classes you’ll use in almost any iOS program you write.