Chapter 16
Visual Comfort and Fatigue in Stereoscopy
16.1. Introduction
The development of three-dimensional (3D) video has impacted each part of the transmission chain, from acquisition to reproduction. It also strongly impacts user experience through the sensation of perceived depth. In this context, the Quality of Experience (QoE) [QUA 12] may be defined using three major factors [LAM 11]: visual quality, which refers to the quality of each view taken separately and corresponds to quality evaluated in terms of two-dimensional (2D) viewing; quality of the depth effect, qualified by a variety of indicators such as the reproduction quality of the 3D scene and the sense of presence induced by the 3D effect; and visual fatigue and visual (dis)comfort, often induced by technical constraints related to viewing stereoscopic content.
While recent progress in terms of capture and reproduction has enabled the use of high-quality 3D content according to the first two criteria (visual quality and quality of the depth effect), fatigue and discomfort continue to present significant limitations in the deployment of 3D video. Certain studies have shown that users tend to prefer the 2D version of a video to its 3D equivalent in cases where the latter may induce fatigue or discomfort [BAR 10].
In this chapter, we will provide an overview of visual fatigue and discomfort, both in terms of the mechanisms involved in the human visual system (HVS) and in terms of 3D content and processing technologies. We will begin by defining the notions of fatigue and discomfort (see section 16.2). To facilitate understanding of the rest of the chapter, section 16.3 will provide an overview of cognitive and optical manifestations of fatigue and discomfort. Section 16.4 is devoted to different sources of visual fatigue and discomfort, in connection with binocular vision. In section 16.5, we will consider the problems posed by 3D technologies and content.
16.2. Visual comfort and fatigue: definitions and indications
Few studies provide definitions of the notions of fatigue and discomfort and the associated terminology [LAM 07]. Our definitions in this section are inspired by the dominant medical technology, extended to a broader context. Figure 16.1 shows the way in which the analysis of objective and/or subjective data may be used to identify the presence of fatigue or discomfort. Recently, a considerable number of studies have focused on the construction of objective models for predicting fatigue or discomfort based on the nature of 3D content or related to processing and visualization conditions.
Figure 16.1. Visual fatigue and discomfort: context and terminology

16.2.1. Visual fatigue
We consider that visual fatigue is manifested and may be diagnosed by the presence of objective indications (signs) and subjective indications (symptoms). Signs correspond to the experimental measurement of one or more physiological reactions by the observer, and a measurement protocol is required in order to measure them. Symptoms are expressed by the observer and constitute an indication of his or her perceived mental or physical state. Visual fatigue is generally caused by the repetition of excessive visual effort, and can build up as these efforts are repeated. It disappears after a sufficient rest period. The nature, intensity and temporal characteristics (time of appearance, duration, rising slopes and falling edges) of signs and symptoms constitute parameters that may be used to evaluate the severity of visual fatigue. The terms asthenopia and eye strain may also be used in this context. Their differentiation from visual fatigue varies according to the context, and the terms are sometimes used interchangeably; precise definitions are generally based on the severity of signs and symptoms. In this chapter, the three terms will be considered as equivalent.
16.2.2. Visual comfort and discomfort
According to definitions used in the field of psychology [ROO 00], visual discomfort is made up of the integration of one or more sensations (multimodal construction) and depends on perception. Visual discomfort is, therefore, a percept constructed and evaluated by the user in reaction to an environment and a presented stimulus. It corresponds to the degree of immediate physical or mental unpleasantness. Discomfort may thus be linked to the experience of one or more symptoms, to difficulties experienced in the accomplishment of a visual task or to any other negative sensation associated with the visual treatment of presented information. Visual discomfort appears and disappears with the presence of these negative associations. Unlike visual fatigue, the rise and fall time of visual discomfort is comparably short. Comfort and discomfort are sometimes defined in separate, distinct ways (for example, in design) [VIN 07].
In these studies, comfort is not defined solely as the absence of discomfort, but also requires the presence of well-being.
In this context, we will consider the presence of comfort as the absence of discomfort.
16.2.3. Detection and evaluation of visual fatigue and discomfort
Symptoms linked to visual fatigue and discomfort are generally evaluated using questionnaires. The signs of fatigue, on the other hand, are commonly evaluated using appropriate examinations. Visual fatigue may be diagnosed by the presence of characteristic signs and/or symptoms, including the degree of fatigue reported, subjectively, by observers [YAN 02]. It may also be voluntarily provoked when an observer is required to make an excessive visual effort over a long period [WAN 02]. For observers, the only means of detecting discomfort is to subjectively evaluate and/or quantify it. In [YAN 02], for example, discomfort is evaluated continuously using the Single Stimulus Continuous Quality Evaluation (SSCQE) protocol [ITU 04]. Some studies have connected the sensation of discomfort to other characteristics involved in visual tasks, using symptoms or objective signs.
16.3. Signs and symptoms of fatigue and discomfort
Manifestations of visual fatigue may take different forms, most of which are ocular or cognitive. Other manifestations, such as shoulder stiffness, modifications in respiratory or cardiac rhythms [AND 02, NAG 08] or the concentration of cortisol in saliva [NAG 08] may also be taken into consideration.
16.3.1. Ocular and ocularmotor fatigue
There are a number of signs and symptoms of visual fatigue [CAI 92], including the presence of mucus or tear formation around the eyelids, modifications in blinking frequency and the sensation of ocular dryness. The near vision triad (accommodation, vergence and pupillary response) has been the subject of particular attention.
16.3.1.1. Accommodation disturbances
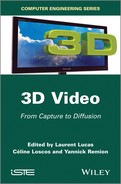
Accommodation (A) allows us to focus on a presented visual stimulus and is measured in accommodation diopters. In practice, the accommodation distance is not the exact distance from the target object, but generally shifts in the direction of the tonic accommodation distance, given by the state of refraction of the human eye at rest (≈ 1.0 δ -diopter-).
This accommodation adaptation thus introduces an accommodation lead or lag, depending on the context (see Figure 16.2(a)). The tonic accommodation distance varies from person to person. Jaschinski-Kruza [JAS 98] showed that individuals with high tonic accommodation are more susceptible to visual fatigue. In [HAS 01], the visual fatigue induced by monocular or binocular accommodation and vergence efforts led to a reduction in tonic accommodation (of up to 0.5 δ).
In [YAN 02, YAN 04], subjective scores (1–5) for perceived visual fatigue were correlated with a reduction in accommodation amplitude (for an accommodation demand of ≈ +5 δ) after viewing 2D or stereoscopic 3D video sequences. The reduction was higher in 3D (>0.5 δ) than in 2D (<0.5 δ).
Figure 16.2. Adaptation and conflicts between accommodation and vergence
16.3.1.2. Vergence disorders
(Con)vergence (C) involves the orientation of the eyes toward a target object and is measured in prismatic diopters. As in the case of accommodation, a vergence adaptation, or prismatic adaptation, mechanism exists. Vergence errors are known as fixation disparities or stability and introduce a shift toward the value at rest, or dark vergence. In [JAS 91], the author shows that in near vision, visual fatigue increases in line with the distance between the viewpoint and the dark vergence. In [NOR 81], the authors found that within a group of 15 patients presenting asthenopia or binocular vision problems, the majority showed deficient adaptation in the optometric prism facility test, both to base-in and base-out prisms. Similar results were observed after viewing stereoscopic 3D content [LAM 09].
16.3.1.3. Oculomotor control models
In real-world situations, the point of focus (accommodation) and the gaze point (vergence) are synchronized; within the oculomotor system, accommodation and vergence are mutually interdependent [HUN 01]. Convergence accommodation (CA) occurs when convergence induces an accommodative response, and accommodative convergence (AC) occurs when an accommodative change triggers vergence. Fusion convergence (C) is faster than accommodative convergence (AC): the former is based on the estimation of retinal disparity and the latter is based on retinal blurring [HOF 08]. This interdependence may be measured using the ratios CA/C and AC/A.
In [WAN 02], a reduction in the two ratios AC/A and CA/C was measured after visualization of depthwise movements of a 3D stimulus. In [SCH 87], however, the two relationships developed in opposite directions after a visual effort: the relationship associated with the fastest mechanisms (vergence or accommodation) increased, while the other decreased. The modification of these relationships may also be interpreted as the result of an adaptation process: vergence and accommodation may respond to the newly experienced conflicting demands in a more efficient manner.
16.3.1.4. Pupil diameter changes
In [MUR 01], perceived fatigue is correlated with a reduction in pupil diameter. The authors of [UKA 97] showed that in 30% of patients suffering from visual fatigue, an exaggerated alternation of pupil constriction (miosis) and dilation (mydriasis), known as hippus, was observed in near vision, with no connection to variations in lighting or fixation.
16.3.2. Cognitive fatigue
Visual fatigue may take the form of ocular disturbances, but may also create other signs such as headaches [AND 02]. Studies have shown that the visual fatigue induced by viewing a stereoscopic 3D video slows the event-related potentials P100 (after 100 ms) [EMO 05] and P700 (after 700 ms) [LI 08]. These results show that visual fatigue also has an impact on the cognitive processes of the HVS. In the context of stereoscopic 3D, cognitive fatigue may take the specific form of stereopsis problems. One particular stereopsis property, the fusion range, i.e. the retinal disparity range for which left and right images can be fused, is frequently used to measure stereopsis performance. Over a longer period, after viewing a 3D stimulus for 60 min, visual fatigue manifested through a reduction in the fusion range [EMO 04, EMO 05, NOJ 04b]; its extent returned to the initial value after a rest period of 5–10 min. However, in [LAM 09], the short-term visual fatigue induced by reading a 3D text (the Wilkins text) was shown to be positively correlated with an increase in the fusion range.
The fusion range may also be increased for a longer period by training [EMO 05]: repeated visualization of 3D content may thus contribute to a limitation of the signs and symptoms of fatigue. The fusion interval may be measured in two ways. In the first method, starting from a position where fusion is possible, we may increase retinal disparity until diplopia (double vision) is reached. In the second method, we begin from a position of diplopia and reduce the retinal disparity until binocular fusion occurs. These two methods do not produce the same values and lead to fusion hysteresis, which may also be used to detect visual fatigue [EMO 04]. In [EMO 05], instances of diplopia were used to detect fatigue. Other characteristics of stereopsis, such as stereoacuity [HOF 08, SCH 87] and binocular fusion speed [HOF 08], have also been linked to visual fatigue.
16.3.3. Signs and symptoms linked to discomfort
As discomfort is subjective, almost all studies evaluating discomfort use questionnaires. Certain studies [HOW 97, KEN 93] have aimed at detecting the presence of a number of characteristic symptoms, while others concentrate on evaluating comfort levels using a scale. Some symptoms have shown strong correlation, notably ocular pain or irritation [KIM 11, KUZ 08, LAM 09], double vision [LAM 09, YAN 11], a loss of sharpness [LAM 09, YAN 11], focusing difficulties [KIM 11, KUZ 08], nausea [KUZ 08] and headaches [KUZ 08]. In [KIM 11], the level of cerebral activity of the frontal eye field, which plays an important role in controlling eye movements, was correlated with perceived levels of discomfort. The authors of [LI 13] showed that blinking frequency is proportional to comfort when the visual stimulus is static and inversely proportional to comfort when the stimulus moves in a plane parallel to the screen; to our knowledge, these are the only studies to have established links between an objective sign and the existence of discomfort.
16.4. Sources of visual fatigue and discomfort
16.4.1. Ocular constraints
16.4.1.1. Accommodation/vergence conflicts
Using (auto)stereoscopic screens, accommodation and vergence demands are desynchronized: accommodation is fixed on the screen, whereas vergence varies with the disparity presented on the screen (see Figure 16.2(b)). These demands enter into conflict with the oculomotor coupling of accommodation and vergence. A certain number of studies have shown that accommodation/vergence conflict introduces instabilities into the behavior of the oculomotor system, which constantly oscillates between accommodation and vergence demands. However, this hypothesis is difficult to verify due to accommodation lead and lag. In [UKA 02], convergence difficulties and oculomotor instabilities were observed when a high degree of disparity was presented on screen (up to 2.6°). In [OKA 06], the authors showed that the role of convergence accommodation increases with the degree of conflict, whereas the role of focus accommodation decreases with an increase in retinal blurring. In [FUK 09], the authors suggest that the accommodation response follows convergence accommodation in a transient manner and is then corrected in relation to retinal blurring. This conflict is generally considered to be an important source of visual fatigue. A number of observations support this idea:
Finally, the visualization of stereoscopic images induces visual discomfort when the disparity is over 60 arc-minutes [NOJ 04b].
16.4.1.2. Depth and plane movements
Certain studies have shown that variations of the accommodation/vergence conflict are problematic, but not the conflict itself. Tracking depthwise movements, and the visualization of 3D scenes where the foreground and background are separated by a large depth interval, leads to variations in conflicting accommodation and vergence demands in the course of visualization. In [NOJ 04b], the temporal variations in the disparity of stereoscopic images, when they are discontinuous and larger than 60 arc-minutes, are shown to induce visual discomfort. In [EMO 05], visualization of a stereoscopic 3D sequence through a system of prisms induced visual fatigue when the power of the prisms varied repeatedly. In [YAN 02, YAN 04], visual discomfort and fatigue were induced when visualized stereoscopic sequences included strong depthwise movement, even when the accommodation/vergence conflict was minimized [YAN 04]. In [SPE 06], the speed of depthwise movement was shown to be a determinant for visual comfort. Visual comfort decreased as the speed of disparity variations increased.
Planar movements, with no depthwise changes, have also been considered. In [YAN 02, YAN 04], these movements were found to have no influence on fatigue or visual comfort when viewing stereoscopic 3D sequences. In [LI 11], however, visual discomfort was seen to increase with the angular speed of a stereoscopic stimulus moving in a plane parallel to the screen, and also with the depth interval separating the foreground from the background, with no connection to the degree of accommodation/vergence conflict.
16.4.1.3. Limited depth of field
The depth of field is the distance interval which is perceived in a sharp, non-blurred manner. It is localized around the accommodation distance. Its projection into optical space (eye, camera, etc.) is known as the depth of focus, and is generally evaluated at ±0.2 δ (diopters) [YAN 04]. For stereoscopic screens, the depth of field refers to the depth interval behind and in front of the screen in which objects are perceived sharply[CHE 10]. Thus, the disparity of the screen should be limited in order to reproduce 3D content within the limits of the depth of field [YAN 04].
The absolute distance range of the depth of field varies with optical parameters, notably the visualization distance, the aperture and optical aberrations. It increases monotonously with the visualization distance [CHE 10] so that the role of accommodation diminishes as the visualization distance increases. The eye aperture is given by the diameter of the pupil: the narrower the aperture, the greater the depth of field [CHA 77]. The pupil diameter itself is influenced by lighting: the more the light, the smaller the aperture and the greater the depth of field. With active (shutter) stereoscopic screens in particular, it is important to verify that the illumination level is sufficiently high to preserve the depth of field: active eyewear may reduce lighting levels by up to 80%. In [LI 05], the authors show that the pupillary reaction is also activated by the visualization of moving autostereograms, thus only by the disparity of the observed stimulus. Finally, optical aberrations in the eye also influence the depth of field. Refraction errors, for example, increase the likelihood of visual fatigue [BLE 05].
16.4.2. Cognitive constraints
16.4.2.1. Detecting disparity: cortical anomalies
Richards [RIC 71] suggests that each type of disparity – crossed, uncrossed or (quasi) null – stimulates a specific set of neurons (Figure 16.3). The final disparity is given by the disparity of the set (or channel) with the maximum response.
Unequal assignment of cortical neurons to the different channels may explain the observed variations in sensitivity to disparity between individuals. In degraded visualization conditions, for example, 20–30% of the population perceive crossed disparities as uncrossed disparities, and vice versa [RIC 71]. About 6–8% of the population are unable to perceive disparity; one hypothesis is that these individuals lack disparity channels [RIC 71]. Although this type of anomaly does not necessarily prevent relief perception, this can generate sporadic incoherence, inducing fatigue or discomfort.
Figure 16.3. Disparity channels: neurone based disparity calculation

16.4.2.2. Limited binocular fusion zones
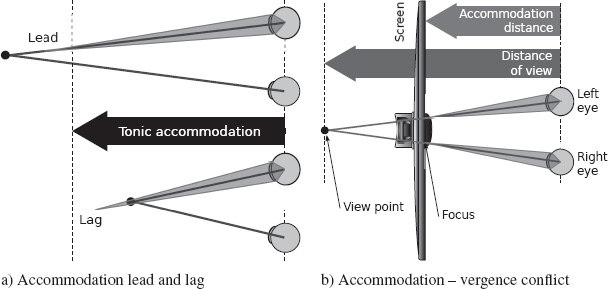
Binocular fusion, or stereopsis, constructs depth information in relation to a reference surface known as the horopter: the set of points in space which stimulate corresponding points on the left and right retinas. In the 19th Century, G. Vieth, followed by J. Müller, constructed a theoretical model of a surface of zero retinal disparity, i.e. the horopter, a model which later came to be known as the Vieth–Müller circle [SCH 06]. The set of points in space located in front of and behind the horopter for which fusion is possible forms a zone known as Panum’s area. Outside the Panum’s area, fusion is impossible, creating diplopia or binocular rivalry, and only one of the two views is seen at a time, either in alternation (binocular rivalry) or by suppressing one of the two views.
The size of Panum’s area is influenced by a variety of factors. The first studies on the subject gave variable measurements, from 14 [MIT 66] to 120 [FEN 67] arc minutes. The extent of the area, initially described as an elliptical surface [SCH 81], increases in line with the eccentricity of the visual stimulus [HAM 83]. The fusion interval, therefore, increases proportionally with the viewing angle [NAG 96]. The dimensions of Panum’s area increase with the size of the visual stimulus, illumination, viewing duration [WOO 74] and training [JON 89]. However, these dimensions decrease as the spatial frequency of the stimulus increases, and when disparity undergoes temporal modulations [SCH 81]. The visualization of 3D content with relief objects which are small, poorly lit, highly detailed or make frequent depthwise movements may, therefore, prove problematic, generating diplopia episodes and consequently visual fatigue [EMO 05]. It is, therefore, important to limit the disparity of 3D content in order to ensure its visualization within Panum’s area. This requires us to convert screen disparity into perceived disparity: while the first value is simply generated by a horizontal shift on the screen between the two views of the same stimulus, the second value depends on the shape of the retina and the form of the horopter, and therefore varies between individuals and stimulus properties.
The horopter is a surface which curves toward the exterior (see Figure 16.4(b)), of which the backwardly inclined profile [COO 11] (see Figure 16.4(a)) seems adapted to real-world scenarios in which the closest objects are situated in the lower part of the field of vision, and the most distant objects toward the top (clouds, for example). In [NOJ 04a], the visualization of stereoscopic 3D sequences respecting this property (crossed disparities at the bottom of the screen, uncrossed disparities at the top of the screen) was shown to reduce the visual discomfort. In [COO 11], the authors measured the form of the horopter before and after a period of five days during which subjects wore distorting glasses; the results showed that the horopter does not adapt to a presented distortion.
Figure 16.4. Shapes and orientations of Panum’s area and the horopter
16.4.2.3. Duality of binocular perception
The central and peripheral zones of the field of vision are treated in different ways by the visual cortex, and generate information of different natures. The parvocellular pathway transmits information from the center of the retina, the fovea, to the ventral stream of the visual cortex, where neuron responses are slow and sustained (perception of details and high spatial frequencies). The magnocellular pathway connects the periphery of the retina to the dorsal stream of the visual cortex, where neuron responses are rapid and transient (rough estimation of the optical flow, perception of movement). This duality is also encountered in stereopsis. In [SCH 81], a small fusion interval and high stereoacuity were observed during visualization of fixed or slow-moving stimuli presenting spatial details. Inversely, a large fusion interval and reduced stereoacuity were observed in cases involving stimuli in rapid movement presenting low detail levels. The first case seems to correspond to the use of the parvocellular pathway and the second case to the magnocellular pathway. Notions of patent and qualitative stereopsis are also used. In the first case, fusion is easy and the perceived depth increases monotonously with retinal disparity. In the second case, fusion is more difficult and only generates relative depth information (e.g. “behind” or “in front of” x), but operates in a disparity interval which largely exceeds the fusion interval. The authors of [STR 10] suggest that this dichotomy is the result of two different neuronal mechanisms. These observations may be correlated with the form of Panum’s area, the extent of which increases with the retinal eccentricity of the stimulus [HAM 83]. In terms of 3D content, it is thus highly possible that the perception of depthwise movement and major disparities would be facilitated if these aspects were perceived in peripheral vision. When high stereoacuity is required for visualization, however, foveal vision should be used.
16.4.2.4. Depth cues and cognitive conflicts
Depth perception is based on the estimation of retinal disparity and on a set of cognitive and physiological, monocular or binocular cues [CUT 95]. The HVS involves a set of mechanisms allowing these cues to be integrated in order to produce a final depth estimation. In [HOF 08, HEL 10], the authors suggest that the quantity of depth is something that best correlates with each cue taken individually (statistical inference). Certain authors, however, suggest that a deterministic process links a depth quantity to the value of individual cues [DOM 06]. The model proposed in [RIC 09] is mostly based on retinal disparity; other cues are only used to convert depth-related information (quantified by disparity) into an absolute depth percept. Certain studies propose that the visual system constructs a mental representation of the field of vision over time [UKA 08]. This representation would be used for prediction purposes, considerably simplifying the depth cue integration process.
Stereoscopic screens reproduce the depth effect by providing artificial binocular cues. While little work has been published on this subject, certain researchers have suggested that these artificial cues and their incoherences may pose problems in terms of integration [PAT 09], and may induce cognitive fatigue or discomfort.
Studies have been conducted to evaluate the limitations of current display technology. The inversion of the two stereoscopic views creates a conflict between binocular information and monocular cues, generating discomfort [KIM 12]. The violation of the stereoscopic window also induces visual discomfort [MEN 09].
Moreover, the scene as a whole is generally reproduced in a clear, sharp manner, whereas in the real world, zones outside the field depth are perceived in a blurred manner and thus do not require binocular fusion. In the absence of precise results, care should be taken to ensure that generated depth cues are as coherent as possible [HOF 08].
16.5. Application to 3D content and technologies
16.5.1. The comfort zone
To limit accommodation/vergence conflict and offer a suitable depth of field, a comfort zone should generally be respected. This is the depth interval behind and in front of the screen (see Figure 16.5(a)) in which content is perceived within the fusion interval (otherwise diplopia, binocular rivalry or view suppression occurs) and within the limits of the depth of field (any object located outside these limits is perceived blurred). The comfort zone is specified in different manners: ±0.2 diopters in terms of depth of field [CHE 10, YAN 02], ±1° of screen angle disparity [SPE 06], respectively, 1% and 2% of screen size in terms of crossed and uncrossed disparities [MEN 09]. All these values are similar as shown in Figure 16.5(b).
16.5.2. Reproduction artifacts
Camera, postprocessing or imaging flaws may produce mapping faults between two stereoscopic views. The use of convergent (toed-in) cameras, for example, generates erroneous vertical disparities. In [SPE 02], the global introduction of vertical disparity was shown to induce visual discomfort, which increased with the size of the vertical shift and the viewing duration.
Trapezoid distortions (keystoning), notably introduced by the use of toed-in cameras, also generate discomfort when they are higher than 1 prismatic diopter [KOO 04]. The same applies to rotations over 1° and changes in scale of over 2.5%.
Figure 16.5. The comfort zone a) and its definitions b)

Transmission errors, particularly packet loss, degrade left and right views in different ways and may induce binocular rivalry. In [BAR 10], the authors showed that the use of 2D error resilience mechanisms does not prevent these errors from causing visual discomfort. The resilience strategy which generates the least discomfort has been shown to be a temporary switch to 2D display. Finally, coding artifacts, particularly quantization effects, generate discomfort: in [BAR 10], the percentage of observers experiencing visual discomfort increased in line with the quantization step of the H.264 codec.
Interference between active (shutter) eyewear and certain light sources (e.g. neon lighting), which flicker with the frequency of the electrical network (50 Hz), or insufficient display refresh frequencies, generates flickering effects; these are particularly problematic when perceived in the periphery of the visual field.
When a depth map is used to synthesize stereoscopic views or when 2D to 3D conversion techniques are used, care is required to ensure temporal coherence and avoid the appearance of noise or depth oscillation in contours [CHO 12, LAM 07].
Crosstalk is a common effect encountered when using passive (polarized) and active displays when information destined for one eye is also perceived by the other eye. This generates blurring effects and may produce phantom images, leading to visual discomfort. In [KOO 04], the introduction of crosstalk of 5% produced slight discomfort, and at 25%, the discomfort was very significant. In [SIE 01], however, the author showed that controlled crosstalk can contribute to the reduction of picket fence effects when the observer changes viewpoint in front of an autostereoscopic screen.
16.5.3. Focus and blurring effects
Okada et al. [OKA 06] show that in the presence of accommodation/vergence conflicts, the role of accommodation (through focusing) reduces as the level of blurring increases. Inversely, when the visual stimulus is clear and contains high frequencies, precise accommodation is needed, requiring higher levels of effort. In [KOO 04], the authors showed that the introduction of slight blurring is a major source of discomfort. Blurring was long considered to be a marginal depth cue due to the ambiguity of its symmetrical behavior in relation to the focusing distance. In [HEL 10], the authors showed that blurring is proportional to the absolute value of disparity, and its introduction may be used to alter depth perception. The authors of [WAN 11] showed that the introduction of blurring allows an increase in perceived depth in relation to the distance between the foreground and background of a visualized scene. Thus, the introduction of blurring, for an identical perceived depth, allows a reduction in screen disparity. While further work is required on the subject, these results suggest that visual discomfort may be reduced without modifying perceived depth by reducing disparity and reducing the role of focus accommodation (and thus the accommodation/vergence conflict).
16.5.4. Visual attention
A number of perceptual mechanisms involved in visualizing 3D content are influenced by visual attention [HUY 11]. Visual attention carries out selection on elements presented in the field of vision and, thus, modifies perceived stimuli. The extent of Panum’s area, for example, is reduced in foveal vision but it is larger in peripheral vision. Zhang et al. [ZHA 10] propose a 3D visual attention model based on depth, brightness, color and movement contrast. In [SOH 11], the authors propose a visual comfort model based on a visual attention model developed for stereoscopic content.
16.5.5. Flaws or absence of the motion parallax
In the real world, observer movements generate a motion parallax. Stereoscopic 3D screens do not reproduce this effect, and the perceived flatness may enter into conflict with the disparity presented on screen [HOW 11]. Multiview display systems, on the other hand, may reproduce motion parallax cues when the user moves between viewpoints.
16.5.6. Exposure duration and training
As the duration of visualization increases, visual fatigue can accumulate. In [SUZ 04], accommodation speed remained unchanged after 15 min of 3D visualization; after 30 min, however, it was reduced. In the second case, a rest period of 90–120 min was required for accommodation to return to its initial speed. In [LAM 09], some measured visual properties showed short-term effects but rapidly returned to their initial state. In [LI 08], the cerebral activity of the beta band increased with the duration of visualization of a stereoscopic sequence.
However, the performances of the visual system may also increase with the duration of visualization. In [WOO 74], the authors showed that the extent of Panum’s area increased in line with visualization time. In [LAM 09], the fusion interval was shown to increase after short-term effort. Certain studies have also shown that training may contribute to a reduction in the signs and symptoms of visual fatigue. In [EMO 05], the fusion interval increased with repeated experimental sessions over the course of one month. In [JON 89], Panum’s area was shown to increase with training.
16.6. Predicting visual fatigue and discomfort: first models
Another subject of research activity in this field is the automatic prediction of visual fatigue and discomfort. Recent publications have provided objective models of discomfort [CHO 12, LI 13] and perceived fatigue [CHO 10], which allow us to predict perceived effects in certain cases.
16.7. Conclusion
In this chapter, we have considered the principal mechanisms involved in binocular vision from the perspective of visual fatigue and discomfort commonly experienced when viewing 3D content. We began by discussing the terminology, which is sometimes ambiguous, with a particular focus on the terms “visual fatigue” and “visual discomfort”. We then described the physical and psychological manifestations of fatigue, before studying the way in which the adaptations and limitations of the HVS are linked to fatigue and discomfort when faced with unusual stimuli. Finally, we considered the failings in 3D content and technologies which generate these unusual stimuli. Clearly, the whole of the 3D chain, from capture to viewing, via data representation, compression, transmission and display, requires careful mastery in order to limit stereoscopic faults and reproduce content in a suitable manner (within the zone of comfort, limiting the depthwise movement of objects). In this, the human factor is decisive due to the multitude of perceptual mechanisms involved. We, therefore, need to obtain the best compromise between the quantity or intensity of 3D effects and the level of visual fatigue and discomfort experienced by the majority of people.
16.8. Bibliography
[AND 02] ANDO T., TANAKA A., FUKASAKU S., et al., “Pupillary and cardiovascular responses to a video movie in senior human subjects”, Autonomic Neuroscience: Basic & Clinical, vol. 97, no. 2, pp. 129–35, 2002.
[BAR 10] BARKOWSKY M., WANG K., COUSSEAU R., et al., 18th International Packet Video Workshop, 2010, IEEE, Hong Kong, 2010.
[BLE 05] BLEHM C., VISHNU S., KHATTAK A., et al., “Computer vision syndrome: a review”, Survey of Ophthalmology, vol. 50, no. 3, pp. 253–262, 2005.
[CAI 92] CAIL F., SALSI S., La fatigue visuelle, Report no. 1–3, INRS, 1992.
[CHA 77] CHARMAN W.N., WHITEFOOT H., “Pupil diameter and the depth-of-field of the human eye as measured by laser speckle”, Journal of Modern Optics, vol. 24, no. 12, pp. 1211–1216, 1977.
[CHE 10] CHEN W., FOURNIER J., BARKOWSKY M., et al., “New requirements of subjective video quality assessment methodologies for 3DTV”, Proceedings of 5th International Workshop on Video Proceedings and Quality Metrics, Scottsdale, AZ, vol. 2010, 2010.
[CHO 10] CHOI J., KIM D., HAM B., et al., “Visual fatigue evaluation and enhancement for 2D-plus-depth video”, 17th IEEE International Conference on Image Processing, IEEE, pp. 2981–2984, 2010.
[CHO 12] CHOI J.-H., YUN M.-J., KIM A.-R., et al., “Visual comfort measurement for 2D/3D converted stereo video sequence”, 3DTV-Conference, IEEE, no. 1, pp. 1–4, 2012.
[COO 11] COOPER E.A., BURGE J., “The vertical horopter is not adaptable, but it may be adaptive”, Journal of Vision, vol. 11, no. 3, pp. 1–19, 2011.
[CUT 95] CUTTING J.E., VISHTON P.M., “Perceiving layout and knowing distances: the integration, relative potency, and contextual use of different information about depth”, in EPSTEIN W., ROGERS S.J. (eds), Perception of Space and Motion. Handbook of Perception and Cognition, 2nd ed., San Diego, CA, US: Academic Press, vol. 5, pp. 69–117, 1995.
[DOM 06] DOMINI F., CAUDEK C., TASSINARI H., “Stereo and motion information are not independently processed by the visual system”, Vision Research, vol. 46, no. 11, pp. 1707–1723, 2006.
[EMO 04] EMOTO M., NOJIRI Y., OKANO F., “Changes in fusional vergence limit and its hysteresis after viewing stereoscopic TV”, Displays, vol. 25, no. 2–3, pp. 67–76, 2004.
[EMO 05] EMOTO M., NIIDA T., OKANO F., “Repeated vergence adaptation causes the decline of visual functions in watching stereoscopic television”, Journal of Display Technology, vol. 1, no. 2, pp. 328–340, 2005.
[FEN 67] FENDER D., JULESZ B., “Extension of Panum’s fusional area in binocularly stabilized vision”, Journal of the Optical Society of America, vol. 57, no. 6, pp. 819–830, 1967.
[FUK 09] FUKUSHIMA T., WOLFFSOHN J.S., GILMARTIN B., “The relationship between CA/C ratio and individual differences in dynamic accommodative responses while viewing stereoscopic images”, Journal of Vision, vol. 9, no. 13, pp. 1–13, 2009.
[HAM 83] HAMPTON D.R., KERTESZ A.E., “The extent of Panum’s area and the human cortical magnification factor”, Perception, vol. 12, no. 2, pp. 161–165, 1983.
[HAS 01] HASEBE S., GRAF E.W., SCHOR C.M., “Fatigue reduces tonic accommodation”, Ophthalmic and Physiological Optics, vol. 21, no. 2, pp. 151–160, 2001.
[HEL 10] HELD R.T., COOPER E.A., O’BRIEN J.F., et al., “Using blur to affect perceived distance and size”, ACM Transactions on Graphics, vol. 29, no. 2, pp. 1–16, 2010.
[HOF 08] HOFFMAN D.M., GIRSHICK A.R., BANKS M.S., “Vergence - accommodation conflicts hinder visual performance and cause visual fatigue”, Journal of Vision, vol. 8, no. 3, pp. 1–30, 2008.
[HOW 97] HOWARTH P., COSTELLO P., “The occurrence of virtual simulation sickness symptoms when an HMD was used as a personal viewing system”, Displays, vol. 18, no. 2, pp. 107–116, 1997.
[HOW 11] HOWARTH P.A., “Potential hazards of viewing 3-D stereoscopic television, cinema and computer games: a review”, Ophthalmic & Physiological Optics: The Journal of the British College of Ophthalmic Opticians (Optometrists), vol. 31, no. 2, pp. 111–122, 2011.
[HUN 01] HUNG G.K., Models of Oculomotor Control, vol. 55, World Scientific Publishing Co. Pte. Ltd., 2001.
[HUY 11] HUYNH-THU Q., BARKOWSKY M., CALLET P.L., “The importance of visual attention in improving the 3D-TV viewing experience: overview and new perspectives”, IEEE Transactions on Broadcasting, vol. 57, no. 2, pp. 432–444, 2011.
[ITU 04] ITU-R-BT.500-11, Methodology for the subjective assessment of the quality of television pictures, Technical report, International Telecommunication Union, 2004.
[JAS 91] JASCHINSKI-KRUZA W., “Eyestrain in VDU users: viewing distance and the resting position of ocular muscles”, Human Factors, vol. 33, no. 1, pp. 69–83, 1991.
[JAS 98] JASCHINSKI-KRUZA W., “Visual strain during VDU work: the effect of viewing distance and dark focus”, Ergonomics, vol. 31, pp. 1449–1465, 1998.
[JON 89] JONES R., STEPHENS G.L., “Horizontal fusional amplitudes. Evidence for disparity tuning”, Investigative Ophthalmology & Visual Science, vol. 30, no. 7, pp. 1638–1642, 1989.
[KEN 93] KENNEDY R., LANE N., BERBAUM K., et al., “Simulator sickness questionnaire: an enhanced method for quantifying simulator Sickness”, The International Journal of Aviation Psychology, vol. 3, no. 3, pp. 203–220, 1993.
[KIM 11] KIM D., JUNG Y., KIM E., et al., “Human brain response to visual fatigue caused by stereoscopic depth perception”, 17th International Conference on Digital Signal Processing (DSP), 2011, IEEE, pp. 1–5, 2011.
[KIM 12] KIM W.-J., “Feature-based detection of inverted-stereo for stereoscopic 3D viewing comfort”, IEEE Transactions on Broadcasting, vol. 58, no. 2, pp. 296–300, 2012.
[KOO 04] KOOI F., TOET A., “Visual comfort of binocular and 3D displays”, Displays, vol. 25, no. 2–3, pp. 99–108, 2004.
[KUZ 08] KUZE J., UKAI K., “Subjective evaluation of visual fatigue caused by motion images”, Displays, vol. 29, no. 2, pp. 159–166, 2008.
[LAM 07] LAMBOOIJ M.T.M., IJSSELSTEIJN W.A., HEYNDERICKX I., “Visual discomfort in stereoscopic displays: a review”, Proceedings of SPIE, vol. 6490, SPIE, 2007.
[LAM 09] LAMBOOIJ M.T.M., FORTUIN M.F., IJSSELSTEIJN W.A., et al., “Measuring visual discomfort associated with 3D displays”, Proceedings of SPIE, vol. 7237, SPIE, 2009.
[LAM 11] LAMBOOIJ M.T.M., IJSSELSTEIJN W.A., BOUWHUIS D.G., et al., “Evaluation of stereoscopic images: beyond 2D quality”, IEEE Transactions on Broadcasting, vol. 57, no. 2, pp. 432–444, 2011.
[LI 05] LI Z., SUN F., “Pupillary response induced by stereoscopic stimuli”, Experimental Brain Research, vol. 160, no. 3, pp. 394–397, 2005.
[LI 08] LI H., SEO J., KHAM K., et al., “Measurement of 3D visual fatigue using event-related potential (ERP): 3D oddball paradigm”, 3DTV Conference: The True Vision-Capture, Transmission and Display of 3D Video, 2008, IEEE, pp. 213–216, 2008.
[LI 11] LI J., BARKOWSKY M., WANG J., et al., “Study on visual discomfort induced by stimulus movement at fixed depth on stereoscopic displays using shutter glasses”, Proceedings of 17th International Conference on Digital Signal Processing, pp. 1–8, 2011.
[LI 13] LI J., BARKOWSKY M., LE CALLET P., “Visual discomfort is not always proportional to eye blinking rate: exploring some effects of planar and in-depth motion on 3DTV QoE”, 7th International Workshop on Video Processing and Quality Metrics, pp. 1–6, 2013.
[MEN 09] MENDIBURU B., 3D Movie Making: Stereoscopic Digital Cinema from Script to Screen, Focal Press, 2009.
[MIT 66] MITCHELL D.E., “A review of the concept of ‘Panum’s fusional area’”, American Journal of Optometry, vol. 43, pp. 387–401, 1966.
[MUR 01] MURATA A., UETAKE A., OTSUKA M., et al., “Proposal of an index to evaluate visual fatigue induced during visual display terminal tasks”, International Journal of Human-Computer Interaction, vol. 13, no. 3, pp. 305–321, 2001.
[NAG 96] NAGATA S., “The binocular fusion of human vision on stereoscopic displays - field of view and environment effects”, Ergonomics, vol. 39, no. 11, pp. 1273–1284, 1996.
[NAG 08] NAGATANI H., HIRAYAMA Y., “Evaluation of the influence on the human body of the autostereoscopic display based on the integral imaging method”, Proceedings of SPIE, vol. 6803, SPIE, pp. 1–8, 2008.
[NOJ 04a] NOJIRI Y., YAMANOUE H., HANAZATO A., et al., “Parallax distribution and visual comfort on stereoscopic HDTV”, Proceedings of SPIE, vol. 25, SPIE, pp. 303–313, 2004.
[NOJ 04b] NOJIRI Y., YAMANOUE H., HANAZATO A., et al., “Visual comfort/discomfort and visual fatigue caused by stereoscopic HDTV viewing”, Proceedings of SPIE, vol. 5291, SPIE, pp. 303–313, 2004.
[NOR 81] NORTH R., HENSON D.B., “Adaptation to prism-induced heterophoria in subjects with abnormal binocular vision or asthenopia”, American Journal of Optometry and Physiological Optics, vol. 58, no. 9, pp. 746–752, 1981.
[OKA 06] OKADA Y., UKAI K., WOLFFSOHN J.S., et al., “Target spatial frequency determines the response to conflicting defocus- and convergence-driven accommodative stimuli”, Vision Research, vol. 46, no. 4, pp. 475–484, 2006.
[PAT 09] PATTERSON R., “Review paper: human factors of stereo displays: an update”, Journal of the Society for Information Display, vol. 17, no. 12, pp. 987–996, 2009.
[QUA 12] QUALINET, Qualinet white paper on definitions of quality of experience, Technical report, Dagstuhl Seminar, 2012.
[RIC 71] RICHARDS W., “Anomalous stereoscopic depth perception”, Journal of the Optical Society of America, vol. 61, no. 3, pp. 410–413, 1971.
[RIC 09] RICHARDS W., “Configuration stereopsis: a new look at the depth-disparity relation”, Spatial Vision, vol. 22, no. 1, pp. 91–103, 2009.
[ROO 00] ROOKES P., WILLSON J., Perception: Theory, Development and Organisation, Routledge Modular Psychology Series, 1st ed., London, 2000.
[SCH 81] SCHOR C.M., TYLER C.W., “Spatio-temporal properties of Panum’s fusional area”, Vision Research, vol. 21, no. 5, pp. 683–692, 1981.
[SCH 87] SCHOR C.M., TSUETAKI T.K., “Fatigue of accommodation and vergence modifies their mutual interactions”, Investigative Ophthalmology & Visual Science, vol. 28, no. 8, pp. 1250–1259, 1987.
[SCH 06] SCHREIBER K.M., TWEED D.B., SCHOR C.M., “The extended horopter: quantifying retinal correspondence across changes of 3D eye position”, Journal of Vision, vol. 6, no. 1, pp. 64–74, 2006.
[SIE 01] SIEGEL M., “Perceptions of crosstalk and the possibility of a zoneless autostereoscopic display”, Proceedings of SPIE, SPIE, pp. 34–41, 2001.
[SOH 11] SOHN H., JUNG Y.J., LEE S.-I., et al., “Attention model-based visual comfort assessment for stereoscopic depth perception”, 2011 17th International Conference on Digital Signal Processing (DSP), 2011, IEEE, pp. 1–6, 2011.
[SPE 02] SPERANZA F., WILCOX L.M., “Viewing stereoscopic images comfortably: the effects of whole-field vertical disparity”, Proceedings of SPIE Stereoscopic Displays and Virtual Reality Systems, vol. 4660, SPIE, pp. 18–25, 2002.
[SPE 06] SPERANZA F., TAM W.J., RENAUD R., et al., “Effect of disparity and motion on visual comfort of stereoscopic images”, Proceedings of SPIE, vol. 6055, SPIE, pp. 94–103, 2006.
[STR 10] STRANSKY D., WILCOX L., “Depth magnitude and binocular disparity: a closer look at patent vs. qualitative stereopsis”, Journal of Vision, vol. 10, no. 7, p. 330, 2010.
[SUZ 04] SUZUKI Y., ONDA Y., KATADA S., et al., “Effects of an eyeglass-free 3-D display on the human visual system”, Japanese Journal of Ophthalmology, vol. 48, no. 1, pp. 1–6, 2004.
[UKA 97] UKAI K., TSUCHIYA K., ISHIKAWA S., “Induced pupillary hippus following near vision: increased occurrence in visual display unit workers”, Ergonomics, vol. 40, no. 11, pp. 1201–1211, 1997.
[UKA 02] UKAI K., KATO Y., “The use of video refraction to measure the dynamic properties of the near triad in observers of a 3-D display”, Journal of the British College of Ophthalmic Opticians (Optometrists), vol. 22, no. 5, pp. 385–388, 2002.
[UKA 08] UKAI K., HOWARTH P.A., “Visual fatigue caused by viewing stereoscopic motion images: background, theories, and observations”, Displays, vol. 29, no. 2, pp. 106-116, 2008.
[VIN 07] VINK P., DE LOOZE M.P., “Crucial elements of designing for comfort”, in SCHIFFERSTEIN H. N.J., HEKKERT P., (eds), Product Experience, Elsevier Science, pp. 441–460, 2007.
[WAN 02] WANN J.P., MON-WILLIAMS M., “Measurement of visual aftereffects following virtual environment exposure”, STANNEY K.M., (ed.), Handbook of Virtual Environments: Design, Implementation, and Applications, Chapter 37, Lawrence Erlbaum Associates, Mahwah, NJ, USA, pp. 731–749, 2002.
[WAN 11] WANG J., BARKOWSKY M., RICORDEL V., “Quantifying how the combination of blur and disparity affects the perceived depth”, SPIE Electronic Imaging, vol. 7865, pp. 1–10, 2011.
[WAT 04] WATT S.J., AKELEY K., GIRSHICK A.R., et al., “Achieving near-correct focus cues in a 3-D display using multiple image planes”, ACM Transactions on Graphics - Proceedings of ACM SIGGRAPH 2004, vol. 23, no. 3, 2004.
[WOO 74] WOO G., “The effect of exposure time on the foveal size of Panum’s area”, Vision Research, vol. 14, no. 7, pp. 473–480, 1974.
[YAN 02] YANO S., IDE S., MITSUHASHI T., et al., “A study of visual fatigue and visual comfort for 3D HDTV/HDTV images”, Displays, vol. 23, no. 4, pp. 191–201, 2002.
[YAN 04] YANO S., EMOTO M., MITSUHASHI T., “Two factors in visual fatigue caused by stereoscopic HDTV images”, Displays, vol. 25, no. 4, pp. 141–150, 2004.
[YAN 11] YANG S., SHEEDY J.E., “Effects of vergence and accommodative responses on viewer’s comfort in viewing 3D stimuli”, Proceedings of SPIE Stereoscopic Displays and Applications XXII, vol. 7863, SPIE, pp. 78630Q1–13, 2011.
[ZHA 10] ZHANG Y., JIANG G., YU M., et al., “Stereoscopic visual attention model for 3d video”, 16th International Conference on Advances in Multimedia Modeling, Chongqing, China, pp. 314–324, 6–8 January 2010.