Chapter 20
3D Visualization for Life Sciences
20.1. Introduction
Stereoscopic and autostereoscopic techniques are not limited to the entertainment industry, and are widely used in numerous scientific applications.
Imaging has gained considerable importance in the field of medicine, where it is used to study organs or organisms in vivo with techniques that allow us to study the inside of the body without intervention: radiography, ultrasound, computerized tomography (CT) and Magnetic Resonance Imaging (MRI), radionuclide imaging, Single Photon Emission Computerized Tomography (SPECT) and Positron Emission Tomography (PET).
Imaging also plays an important role in biochemistry, where it is used for molecular modeling. Using computers, scientists are able to approach the structures they manipulate in an intuitive manner, and 3DTV has increased the ergonomics of the systems in question.
20.2. Scientific visualization
Within the domain of graphical information, visualization is often considered to be the simple action of showing the results of data processing on screen. However, the first meaning of visualization is “render visible”, and visualization consists of constructing graphical representations using data which are not necessarily of a visual nature. Work on visualization often differentiates between information visualization and scientific visualization. In the first case, abstract data are given visual attributes (position, color, size, etc.); the second case concerns the presentation of concrete data with an intrinsic representation.
20.2.1. 3D construction
The human sensory system is so well suited to the representation of perspective that it opts for a 3D interpretation, even when faced with a 2D representation. This occurs to the point where errors may be induced by ambiguous images, making us see impossible objects.
3D rendering engines generate images which are supposed to represent a 3D scene seen from a given angle, that of the observer. “Realistic” engines calculate images which appear real to the human eye using a number of techniques that imitate natural phenomena, such as lighting, depth of field and fog. The calculation of cast shadows is more costly, but significantly increases the perceptibility of an image.
Finally, other procedures such as environment mapping, Fresnel reflection or BRDF modeling1 produce indisputable levels of photorealism. However, it is not strictly necessary to use a multitude of perceptual tricks in order for the human visual system to invent a 3D representation; the careful use of certain metaphors is generally sufficient.
20.2.2. Interactivity
Interactivity is central to the visualization of complex data [FEK 02], as in virtual reality environments [BOW 99]. Visualization tools are not limited to the production of static representations of data. Users require a certain degree of freedom in order to manipulate the representation and understand the information space. Interactions may take two different forms:
The combination of these two approaches allows users to gain a clear understanding of the visualized data. A user will perceive the volume of a scene more clearly if he or she is able to modify the viewing angle, and will better understand data if he or she is able to intervene in the visualization process.
20.2.3. 3D visualization
No 2D visual artifice, however perfect, can equal real 3D perception. Autostereoscopic screens and glasses kits, such as Nvidia 3D Vision, have democratized “real” 3D solutions. The programming approach varies depending on the target material, and may require two or more views. Glasses-based solutions require two renderings, one per eye; this is known as quad buffering, as opposed to the double buffering generally used in graphical programming. This technique is supported by the OpenGL and Direct3D graphics libraries. Solutions for autostereoscopic screens, which are less invasive, require a minimum of five viewpoints and involve more “bulky” implementation, based on shaders, due to the absence of standardization (see Chapter 14).
While some applications can natively produce stereoscopic content, almost none of these approaches are designed to calculate the interleaved views needed for 3D display on autostereoscopic screens. One solution consists of modifying and recompiling the original code, but this is time consuming and not always feasible. To avoid rewriting and recompilation, we can use another application to transform the monoscopic output of the host application into multiscopic output.
The OpenGL call interception feature has been used for a variety of purposes, from debugging to code analysis. A number of OpenGL debuggers have been developed based on this principle, including SpyGLass, GLIntercept and BuGLe. Duca et al. [DUC 05] intercepted and recorded OpenGL command flows, storing the data taken from the pipeline in a relational database, allowing analysis of the whole rendering chain, including shaders. Mohr and Gleicher [MOH 01] have shown how to change the rendering mode in an OpenGL application without modifying the source code by intercepting OpenGL commands and changing drawing function calls. The Chromium [HUM 02] system also allows manipulation of graphical command flows. Its flexibility allows users to add multiscopic functions to generic OpenGL applications using configuration scripts written in Python.
20.3. Medical imaging
The use of imaging in medicine is constantly increasing due to progress being made in various techniques. The most spectacular and immediately visible progress in the domain relates to image acquisition techniques, which give access to an increasing variety of information; the benefits of technological advances are also apparent in data visualization. Scientific visualization may thus be applied to this particular field of imaging; medical imaging has clearly benefited from progress in terms of visualization techniques, notably as this imaging increasingly concerns a volumetric image representing the distribution of information in the human body.
Currently, objects studied using 3D imaging techniques are usually presented to users through the representation of information as a series of slices, and the doctor studying these slices has the mental imaging capacity to integrate and understand the presented information. In this way, we are generally able to clearly locate structures in relation to one another; certain tools exist which effectively represent the environment of a structure in an organism, due to rapid image processing methods (e.g. rapid and dynamic display of slices passing along an axis fixed by the operator). It is also possible to represent a set of 3D information as a whole using techniques such as volume rendering, although these are not the most widespread techniques. They require the use of information selection methods before visualizing acquired information in the whole volume, eliminating parasites (technical artifacts) and organs or tissues which are not important for a particular exploration. Threshold methods may be used, but access to the inside of organs, not just their surface, may involve a combination of 3D renderings and slices.
20.3.1. Volumetric visualization
Historically, the imperatives of interactivity have been achieved to the detriment of image quality. A number of methods have been developed with the aim of speeding up the rendering process [BRO 00], which is known for its high CPU usage2. The main innovations in the field appeared at the same time as the new generation of graphics maps, with powerful GPUs3 enabling us to obtain renderings of a quality formerly restricted to costly graphics stations [HAD 09]. These graphics stations took several minutes to calculate images, which can now be created in a fraction of a second by any home, personal computer (PC). The generalization of this type of material is one of the factors that enables high levels of user interaction [VAN 96].
At a time when mass texture use was not a possibility, the first methods for visualizing 3D images often made use of intermediary surfaces. This was the case with the famous marching cubes algorithm [LOR 87, WYV 86], which was able to extract the surface of structures contained in images based on their level of intensity. “Direct” volume rendering techniques, on the other hand Levoy [LEV 88], did not reduce the set of volumetric data to the surface of the observed objects, and allowed users to see the inside of these objects.
Shirley and Tuchman [SHI 90] were among the first to use graphics maps to produce an approximation of volume rendering. Based on a breakdown into simplicial cells, their projected tetrahedra (PT) algorithm involved five stages. First, it projected the tetrahedra (camera + perspective), then sorted projections (painter’s algorithm) and categorized them according to the obtained profile, before breaking them down into triangles and, finally, displaying the results. This idea has been reused on a number of occasions, for example by Stein et al. [STE 94], who attempted to improve these estimations using a more precise sorting algorithm.
Methods based on the use of textured slices may be considered as an additional approximation, where polygons show whole volume slices. Yagel et al. [YAG 96] proposed a technique for the volumetric rendering of non-structured grids by calculating intersections between data and a sweep plane. They showed that their algorithm generated visually comparable images in less time, without even needing to conserve vertex adjacency information, essential for other methods.
Textured slices constitute the most practical and efficient method as the material automatically carries out the bulk of essential calculations.
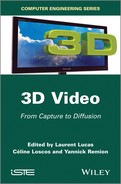
Nowadays, 2D texture placement is part of the standard range of functions of PCs. Moreover, the technique is perfectly integrated into the production process for slices aligned along object axes. The principle is similar to that applied in Lacroute and Levoy’s shear warp [LAC 94]. It requires the use of three variants of the 3D image: one series of slices aligned along x-axis, another along the y-axis and a third along the z-axis. These variants are then applied to the most appropriate pile of rectangles (see Figure 20.1). The choice of a pile to display is made based on the dominant axis, in order to produce slices with the least possible slant. The rendering is applied by placing textured quadrilaterals from back to front and mixing their colors by alpha blending [POR 84]. During this stage, the texture coordinates are bilinearly interpolated on the surface and transcribed in color.
Figure 20.1. Axis-aligned slices requiring several 2D textures (or one 3D texture)
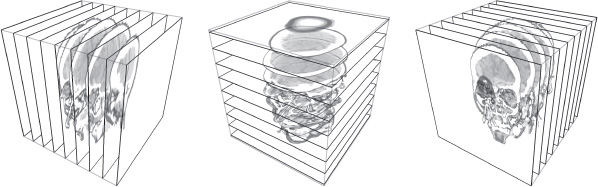
The use of material solutions for 3D texture application has taken over from 2D solutions in the domain of interactive volumetric rendering [CAB 94, WES 98]. The management of 3D textures and the subsequent trilinear interpolation makes it possible to select a slice plane at random in the volume for visualization. This allows us to select optimal slices by imposing new constraints. The flaws observed in 2D also disappear if slices are all calculated parallel to the screen (see Figure 20.2).
Figure 20.2. View-aligned slicing requiring a single 3D texture
The slice definition stage may be carried out by specifying englobing rectangles or by expressing exact intersection polygons. The first solution presents the advantage of being direct and requiring little calculation effort. The second is more complex, and requires calculation of all intersection points and the definition of polygons based on these points. However, the second approach is quicker, as it minimizes the calculations carried out by the GPU, which does not need to process fragments located outside of the data volume. Kniss et al. [KNI 01] took a pseudo-angle approach; unfortunately, this algorithm is dependent on the sequencing of the vertices of the polygon. Inversely, the method proposed in [BEN 05] provides pre-sorted vertex sequences, which may be used as they are and drawn using OpenGL functions.
Finally, Engel et al. [ENG 01] proposed a technique known as pre-integration, which notably reduces the artifacts produced during slicing. When a polygon is grafted, it is considered to be volumetric rather than planar, considering the ray traversing each fragment. An input point is calculated along the ray midway from the previous slice, and an output point midway toward the next slice. The texture is then sampled at these two points, and the obtained values act as an index in a pre-calculated 2D color table.
20.3.2. 3D medical imaging
3D visualization techniques, such as glasses or stereoscopic screens, are currently in their infancy. Their full potential should become clear with experience, refinements and technical progress which will facilitate their use and increase their power. Nevertheless, these techniques have begun to appear at specialist medical imaging conferences.
The passage from traditional imaging, using 2D projections, to 3D slicing techniques was revolutionary; the shift toward volumetric rendering for interpretation should be easier. However, outside of specific contexts, these techniques are not easy to implant into everyday practice, at least for now; the cost of essential software and materials limits their use to certain centers.
The same evolution may occur in the future for stereoscopic 3D visualizations, which, in theory, represent a relatively small step from volume rendering. Again, usage may be limited to centers with the means of purchasing costly equipment which is not strictly necessary in general practice. The advantages and disadvantages of these new techniques also need to be weighed against established techniques. All biological or medical activities which involve observation of all or part of the human body may, potentially, benefit from scientific visualization, whether at microscopic or macroscopic level. The initial field for identification of profitable applications is therefore vast.
In addition to biochemical and pharmacological applications, with 3D visualization of molecules, a deeper understanding of cellular biological processes may be obtained by visualizing cells during different phases of normal or pathological biological phenomena. 3D visualization of a single organism as a whole, potentially over time, should also allow a clearer understanding of certain phenomena in embryology. These examples demonstrate the degree to which different medical professions may be affected by 3D visualization techniques. Other possible applications exist in dentistry, both in surgical preparation and in the creation of implants and prosthetics.
In this section, we consider three domains, within a medical context, in which the advantages of these new techniques should become clear: teaching, diagnosis and certain treatment methods.
20.3.2.1. Teaching
The potential utility of 3D visualization methods in teaching is clear, for example in anatomy teaching. The ability to “look” at an organ in space, from different angles and magnifications, based on “real” data obtained from the natural world, would facilitate understanding of the relationships between organs. The teaching of pathology could also benefit from these visualizations, as realistic representations enable better comprehension of diseases. Pathological anatomy is not the only domain that would benefit, as dynamic visualizations would enable us to understand a pathological process over time, or consider the abnormal operation of an organ (such as the heart [HER 08]). As with research, scientific visualization in an educational context may lead to a better understanding of the shape and temporal evolution of a variety of structures, for example in embryology or cell biology (e.g. considering cell division) and for whole organs. The combination of morphological information with functional or metabolic information, an important trend in current medical imaging, should also benefit from 3D anatomical visualization, with, for example, the superposition of a spatial distribution of a metabolism (using a different range of colors), on condition that the inside of organs is represented in a suitable manner (e.g. by modifying transparency or showing slice planes within objects shown in 3D). This type of teaching may be envisaged in the near future for small groups (practical work), before being proposed for small lecture theaters, depending on screen possibilities. Clearly, the concept of collaborative visualization is perfectly suited to this context.
20.3.2.2. Diagnosis
In diagnosis, instant global visualization of data can be expected to increase comfort in the analysis of imaging data. This could lead to an increase in the speed of data evaluation for a volume, saving time in the interpretation of images, something which is clearly valuable from a professional perspective. The gains represented by the most advanced techniques in scientific visualization in terms of diagnostic precision (proportion of correct affirmations of the presence or absence of a disease) compared to attentive study of slice information, or volumetric rendering without stereoscopic vision, are not yet clear, and require methodical evaluation. As with all new techniques, this visualization method brings new disadvantages alongside the new possibilities it offers.
3D visualization requires a new mode of mental representation of anomalies, different to that used in slice visualization, for the correct recognition of anomalies for diagnostic purposes. New, or additional, science of diseases presentation and signs may emerge based on new visualization possibilities. A learning period is likely to be necessary, in addition to the time involved in learning to use the tool, due to the loss of normal reference points and the presence of particular artifacts in this mode of visualization. Any technique which moves away from raw data may amputate information and introduce artificial information. The realism of a representation, applied to a parasite signal or incomplete information, may lead to erroneous understanding of the structures in question. Poor knowledge of the artifacts generated by a technique and excessive trust in something which is merely an image of reality constitute potential pitfalls of these new techniques, as with all medical imaging methods.
In teaching anatomy, 3D visualization of the surface of organs is sufficient in a large number of circumstances. However, in diagnostics, the ability to visualize the inside of organs is important for the identification of lesions. The ease of use of software and the relevance of proposed tools in relation to this point are of crucial importance in developing the use of 3D visualization in practice. The limitations of use of 3D visualization for diagnosis are linked to the concrete conditions of use, not to speak of the material and its cost: these methods offer a more immediate understanding of the position of information in a space, but require the use of eye equipment, or limitations in user position in relation to the screen. Prolonged use of the tool may generate ocular fatigue. However, these limitations still need to be evaluated within the framework of everyday use. One potential stumbling block is the fact that different subjects may find it more or less difficult to gain an understanding of relief using these techniques.
While this mode of scientific visualization may not immediately become systematic in diagnosis, for some or all of the reasons mentioned above, it may play a role in certain complex cases where the possibilities offered by collaborative visualization would allow group study; it might also be used in training medical imaging specialists. The contribution made by new scientific visualization options is likely to vary depending on the selected imaging techniques, the organs studied or the diseases considered; this will become clearer as more experiments are carried out over the coming years. For the moment, 3D visualization in the context of medical diagnosis has been used with promising results in studying blood vessels, which have a complex spatial form and which may be isolated from the rest of the volume with relative ease, as we can obtain significant contrast between their contents and neighboring tissue [ABI 10, MAG 12].
20.3.2.3. Therapy
In terms of therapeutic applications, scientific visualization tools may be used to improve planning for certain treatments. This is particularly true in surgery, where the visualization of lesions and organs, with the possibility of interacting with these images, would allow “rehearsal” of an intervention within a virtual volume. The 3D visualization of morphological data recorded before the operation might also be used to guide the progression of surgical actions. Image preparation is likely to be necessary in this case, with an impact on the time required from specialists. The limitations of correlation between images, whatever their level of realism, and real objects need to be evaluated, along with the impact this “virtual reality” may have on the mental image of the operation site. In practice, the use of an autostereoscopic screen in operating theaters is easier to imagine than the use of goggles, which would disrupt the visual passage from the operating table to image observation. Radiotherapy is another domain where these new scientific visualization techniques may prove particularly useful. The current aim is to limit the irradiated zone as far as possible around the tumor zone, and new tools are increasingly able to do this. The establishment of contours around the treated zone when planning treatment implies a clear understanding of the shape and position of the tumor. The possible use of 3D visualization needs to be evaluated in this context, both in terms of the precision of delimitation and in the time required.
20.4. Molecular modeling
In chemistry and biochemistry, the understanding of molecular systems as 3D structures is crucial, not only in terms of spatial perception but also in terms of associated functional and mechanical consequences. 3D imaging enables us to “see”, understand and interpret chemical and biological phenomena, which are often highly complex and involve multiple aspects, usually in a dynamic manner. The 3D observation of atomic, molecular and macromolecular interactions allows scientists to go further in understanding and interpreting these phenomena and makes it possible to predict new functions. This vision also facilitates the assisted creation of new molecules, which may then be constructed chemically or through molecular biology before experimental testing.
Atomic components (from 10−18 to 10−10 m, for the electron and the atom, respectively) and molecular components (10−10 to 10−8 m from the atom to “standard”-sized macromolecules) are too small for direct “visualization” through experimentation to be possible in current conditions, except in the case of considerably larger macromolecular structures such as fibrillar systems, transcription machinery or transmembrane receptors, for which we are currently able to evaluate shapes using an ultrastructural (but non-atomistic) vision using electron or atomic force microscopes. The only remaining possibility is virtual representation, using the power of computers and graphics stations, using data obtained through crystallography or nuclear magnetic resonance.
Since the first structural resolutions of biological macromolecules were obtained by X-ray crystallography in the 1950s, as in the case of Watson and Crick’s work on DNA [WAT 53], Sanger’s resolution of insulin [SAN 53] and Perutz’s resolution of hemoglobin [PER 60], scientists have aimed at producing 3D reconstructions of these objects, either physical, using ball and stick models, or using early visualizations on oscilloscope screens in the 1970s. For 3D representation, the complexity of the objects in question and the fact that no real representation of these macromolecules was available led the scientific community to propose new models for representation and simplification, based on the work by Pauling and Corey [PAU 51a, PAU 51b], allowing easy understanding of associated 3D folding. While the sequence of basic components is generally linear (in proteins and nucleic acids), their spatial arrangement depends on the sequence and their physical properties, determining their folding functionality. Thus, for proteins, several graphical models have been used not only for helix representation of α helix amino acids, but also for β chains that may themselves be grouped into β sheets, and finally the bonds connecting all of these secondary structures. A 3D understanding of the arrangement of these secondary structural elements is essential in understanding the relative positions of domains and for the spatial interpretation of dynamics, which may be correlated with this 3D structure.
20.4.1. Classic visualization modes
Macromolecules are made up of several thousands or even tens of thousands of atoms. They are highly complex, and it is difficult to obtain information by simply observing them. For this reason, several different visualization modes are used to simplify the complexity of macromolecules based on the aspects we wish to observe.
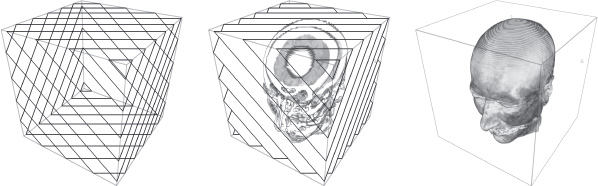
To represent the overall structure of a protein, we may use wireframe rendering, a historic visualization mode [LEV 66]. Using this type of rendering, atoms and their connections are represented by lines. Each atom has a color code, which may be represented on the line. In Figure 20.3, we see that while this mode of visualization is in 3D, it does not give an impression of depth, due partly to the fact that all lines, no matter how distant from the viewpoint, have the same thickness, and to the fact that they do not make use of lighting effects.
Figure 20.3. Basic visualization modes
Another mode often associated with wireframe rendering is licorice rendering, which uses cylinders instead of lines. Cylinders are surfacic objects, and may thus interact with light. The best-known type of visualization uses the ball and stick method. This method allows us to precisely locate atoms by representing them as spheres.
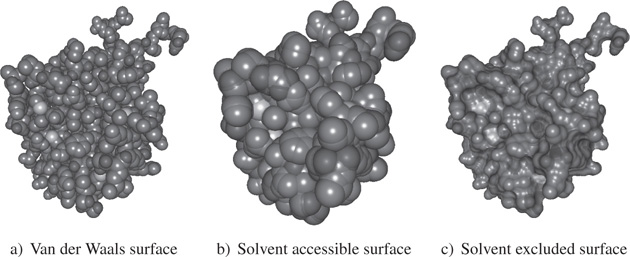
To represent the overall shape of a protein, we may use methods such as van der Waals visualization, representing van der Waals radii, or modes such as the solvent accessible surface model or the solvent excluded surface model [LEE 71]. The van der Waals surface is represented by the edge of the set of balls formed by spheres centered on an atom and with a radius determined by the van der Waals radius of the atom (see Figure 20.4). The solvent accessible surface is the set of possible positions of the center of a spherical probe representing a solvent, rolling on the van der Waals surface. The solvent-excluded surface takes account of the fact that the probe covers hollows.
Figure 20.4. Surfacic visualization modes
In cases where we only wish to present certain structures of a protein, we may use simplified or symbolic renderings.
The most widespread form of symbolic rendering is cartoon rendering, made popular by the 2D tracing possibilities of the Molscript program developed by Kraulis [KRA 91] in the 1990s. Using this type of rendering, we aim to represent secondary structures. The α helices take the form of coils, and β chains, the basic components of β sheets, are shown as arrows.
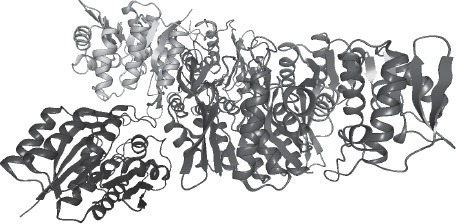
Other visualization modes exist [O’DO 10], but we have discussed the most important and widely used methods. However, these modes present certain drawbacks. Observing a protein using the licorice mode, for example, we are unable to observe secondary structures due to the complexity of the object. The cartoon mode appears to be the most appropriate, but we can only clearly distinguish the α helices (Figure 20.5), which are easy to identify even in a large-scale structure. The real difficulty comes from the fact that only β chains are represented, and not the β sheets. In Figure 20.5, we are able to see certain β chains, but it is impossible to locate, visualize, enumerate or characterize the corresponding sheets. To date, only Nolin et al. [NOL 09] have offered a visualization mode able to represent a β sheet as a whole.
Figure 20.5 Cartoon representation
20.4.2. Molecular modeling in 3D
The joint emergence of “office” computing, which gives everyone the ability to access structural models developed using graphics stations and computers with specialist software, and high-speed molecular biology, through a number of genome projects generating more and more solved 3D structures, have led users of biological molecules to consider 3D visualization. High-performance computers and 3D screens have been introduced in an increasing number of laboratories, and are consequently used in scientific projects. These tools are now used on a regular basis for teaching purposes, and allow students to rapidly come to grips with complex notions, giving access to invisible nanoscopic objects, which are difficult or impossible to materialize in a laboratory setting.
Stereoscopic vision is highly relevant, for example, in representing the interaction of a ligand in an active macromolecular site. Using 3D techniques, we can provide a symbolic representation of these macro-objects with a sequence of elements of secondary structures, alongside additional elements such as solvent accessible surfaces, and representations of the main elements involved in interactions, such as weak bonds (e.g. hydrogen bonds) between various partners, using different visualization modes. While a 2D representation allows us to locate atoms within a hydrogen bond, 3D vision allows us to consider both the structural location of this hydrogen bond and, for example, the immediate environment of other chemical groupings. It is then possible to evaluate the consequences of modifications to chemical groupings, amino acid mutations and the influence of these modifications. The use of 3D representation requires us to reconsider the objects in question and, where necessary, to propose new mechanisms or approaches, which may then be tested biologically. The recent possibility of augmenting reality by applying additional textures to show different physicochemical properties without losing information on atomic connectivity is also extremely useful, allowing us to add an interpretation of physicochemical phenomena.
Autostereoscopic displays make it easier to work with 3D images. The ability to work without goggles is important when using two screens: the command screen, used to supervise work and for console commands, is a standard screen that does not require goggles, whereas the second screen, used for visualization and as the graphical work zone, previously required specific eye wear. Autostereoscopic displays increase comfort levels and working efficiency, although there is still room for improvement in terms of definition and protocols. Learning times are somewhat longer for these displays, and workspace reorganization is often needed to gain the required distance from the screen, improving ocular relaxation for sessions of several hours. These new screens and visual techniques offer a range of possibilities and future applications which will allow us to progress in molecular graphics and, particularly, interact in real time with 3D movement through the use of augmented reality tools.
20.5. Conclusion
While costly, specialized systems have offered the possibility of 3D visualization for a number of years, these possibilities, with or without glasses, have only recently become available to a wider public. 3D content is clearer and easier to use than 2D images, as they remove the need for inference. In this chapter, we have seen the ways in which stereoscopic capacities may vastly improve biomedical imaging and molecular graphics; hospital practitioners have great hopes of applications for teaching, diagnosis and patient treatment, and biochemists hope to achieve a clearer structural understanding of the macromolecules which they study. Despite certain reservations concerning a prolonged learning period, the scientific community has welcomed 3D technology with open arms; this technology, far from being simply a new gadget, promises real progress in the observation, interpretation and manipulation of data.
20.6. Bibliography
[ABI 10] ABILDGAARD A., WITWIT A.K., KARLSEN J.S., et al., “An autostereoscopic 3D display can improve visualization of 3D models from intracranial MR angiography”, International Journal of Computer Assisted Radiology and Surgery, vol. 5, pp. 549–554, 2010.
[BEN 05] BENASSAROU A., BITTAR E., JOHN N.W., et al., “MC slicing for volume rendering applications”, Proceeding of the International Conference on Computational Science, Lecture Notes in Computer Science, Springer, Berlin, Heidelberg, Atlanta, GA, vol. 3515, pp. 314–321, May 2005.
[BOW 99] BOWMAN D.A., JOHNSON D.B., HODGES L.F., “Testbed evaluation of virtual environment interaction techniques”, Proceedings ACM Symposium on Virtual Reality Software and Technology, London, UK, pp. 26–33, 1999.
[BRO 00] BRODLIE K., WOOD J., “Recent advances in visualization of volumetric data”, Proceedings of Eurographics 2000, Interlaken, Switzerland, pp. 65–84, 2000.
[CAB 94] CABRAL B., CAM N., FORAN J., “Accelerated volume rendering and tomographic reconstruction using texture mapping hardware”, Proceedings of ACM Symposium on Volume Visualization ’94, Washington, DC, pp. 91–98, 1994.
[DUC 05] DUCA N., NISKI K., BILODEAU J., et al., “A relational debugging engine for the graphics pipeline”, ACM SIGGRAPH 2005 Papers, SIGGRAPH ’05, New York, ACM, pp. 453–463, 2005.
[ENG 01] ENGEL K., KRAUS M., ERTL T., “High-quality pre-integrated volume rendering using hardware-accelerated pixel shading”, Proceedings of the ACM SIGGRAPH/EUROGRAPHICS Workshop on Graphics Hardware, HWWS ’01, New York, ACM, pp. 9–16, 2001.
[FEK 02] FEKETE J., PLAISANT C., “Interactive information visualization of a million items”, Proceedings of IEEE Symposium on Information Visualization, Boston, MA, pp. 117–124, October 2002.
[HAD 09] HADWIGER M., LJUNG P., REZK-SALAMA C., et al., “Advanced illumination techniques for GPU-based volume raycasting”, ACM SIGGRAPH 2009 Courses, SIGGRAPH ’09, New York, ACM, pp. 1–166, 2009.
[HER 08] HERLAMBANG N., LIAO H., MATSUMIYA K., et al., “Real-time autostereoscopic visualization of registration-generated 4D MR image of beating heart”, in DOHI T., SAKUMA I., LIAO H., (eds), Medical Imaging and Augmented Reality, vol. 5128 of Lecture Notes in Computer Science, pp. 349–358, Springer, Berlin, Heidelberg, 2008.
[HUM 02] HUMPHREYS G., HOUSTON M., NG R., et al., “Chromium: a stream-processing framework for interactive rendering on clusters”, ACM Transactions on Graphics, vol. 21, no. 3, pp. 693–702, 2002.
[KNI 01] KNISS J., KINDLMANN G., HANSEN C., “Interactive volume rendering using multi-dimensional transfer functions and direct manipulation widgets”, Proceedings Visualization 2001, pp. 255–262, 2001.
[KRA 91] KRAULIS P.J., “MOLSCRIPT: a program to produce both detailed and schematic plots of protein structures”, Journal of Applied Crystallography, vol. 24, no. 5, pp. 946–950, 1991.
[LAC 94] LACROUTE P., LEVOY M., “Fast volume rendering using a shear-warp factorization of the viewing transformation”, Computer Graphics (SIGGRAPH’94 Proceedings), vol. 28, no. 4, pp. 451–458, 1994.
[LEE 71] LEE B., RICHARDS F., “The interpretation of protein structures: estimation of static accessibility”, Journal of Molecular Biology, vol. 55, no. 3, pp. 379–400, 1971.
[LEV 66] LEVINTHAL C., “Molecular model-building by computer”, Scientific American, vol. 214, pp. 42–52, 1966.
[LEV 88] LEVOY M., “Display of Surfaces from Volume Data”, IEEE Computer Graphics and Applications, vol. 8, no. 3, pp. 29–37, 1988.
[LOR 87] LORENSEN W., CLINE H., “Marching cubes: a high resolution 3D surface construction algorithm”, Computer Graphics (SIGGRAPH’87 Proceedings), vol. 21, no. 4, pp. 163–169, 1987.
[MAG 12] MAGALHES D.S.F., RIBEIRO F.H., LIMA F.O., et al., “3D brain MR angiography displayed by a multi-autostereoscopic screen”, Medical Imaging 2012: Image Perception, Observer Performance, and Technology Assessment, SPIE, pp. 83181P–83181P-6, 2012.
[MOH 01] MOHR A., GLEICHER M., “Non-invasive, interactive, stylized rendering”, Proceedings of the 2001 Symposium on Interactive 3D Graphics, I3D ’01, New York, ACM, pp. 175–178, 2001.
[NOL 09] NOLIN L., BENASSAROU A., DAUCHEZ M., et al., “Beta sheet simulation in molecular modeling”, in WEGHORN H., ISA P.T., (eds), IADIS Applied Computing 2009, Rome, pp. 259–266, 2009.
[O’DO 10] O’DONOGHUE S.I., GOODSELL D.S., FRANGAKIS A.S., et al., “Visualization of macromolecular structures”, Nature Methods, vol. 7, pp. S42–55, 2010.
[PAU 51a] PAULING L., COREY R.B., “Atomic coordinates and structure factors for two helical configurations of polypeptide chains”, Proceedings of the National Academy of Sciences of the United States of America, vol. 37, no. 5, pp. 235–240, 1951.
[PAU 51b] PAULING L., COREY R.B., “The pleated sheet, a new layer configuration of polypeptide chains”, Proceedings of the National Academy of Sciences of the United States of America, vol. 37, no. 5, pp. 251–256, 1951.
[PER 60] PERUTZ M.F., ROSSMANN M.G., CULLIS A.F., et al., “Structure of haemoglobin: a three-dimensional fourier synthesis at 5.5 angstroms resolution, obtained by X-Ray analysis”, Nature, vol. 185, no. 4711, pp. 416–422, 1960.
[POR 84] PORTER T., DUFF T., “Compositing digital images”, Computer Graphics (SIGGRAPH’84 Proceedings), vol. 18, no. 3, pp. 253–259, 1984.
[SAN 53] SANGER F., THOMPSON E.O.P., “The amino-acid sequence in the glycyl chain of insulin. I. The identification of lower peptides from partial hydrolysates”, Biochemical Journal, vol. 53, no. 3, pp. 353–366, 1953.
[SHI 90] SHIRLEY P., TUCHMAN A., “A polygonal approximation to direct scalar volume rendering”, Computer Graphics (SIGGRAPH’90 Proceedings), vol. 24, no. 5, pp. 63–70, 1990.
[STE 94] STEIN C., BECKER B., MAX N., “Sorting and hardware assisted rendering for volume visualization”, Proceedings of ACM Symposium on Volume Visualization ’94, Washington, DC, pp. 83–90, 1994.
[VAN 96] VAN GELDER A., KIM K., “Direct volume rendering with shading via three-dimensional textures”, Proceedings of ACM Symposium on Volume Visualization ’96, pp. 23–30, 1996.
[WAT 53] WATSON J.D., CRICK F.H., “The structure of DNA”, Cold Spring Harbor Symposia on Quantitative Biology, vol. 18, pp. 123–131, 1953.
[WES 98] WESTERMANN R., ERTL T., “Efficiently using graphics hardware in volume rendering applications”, Computer Graphics (SIGGRAPH’98 Proceedings), vol. 32, no. 4, pp. 169–179, 1998.
[WYV 86] WYVILL B., WYVILL G., MCPHEETERS C., “Data structure for soft objects”, The Visual Computer, vol. 2, no. 4, pp. 227–234, 1986.
[YAG 96] YAGEL R., REED D., LAW A., et al., “Hardware assisted volume rendering of unstructured grids by incremental slicing”, Proceedings of ACM Symposium on Volume Visualization ’96, pp. 55–63, 1996.
1 Bidirectional reflectance distribution functions.
2 Central processing unit.
3 Graphics processing unit.