
Chapter 21
3D Reconstruction of Sport Scenes
21.1. Introduction
Nowadays, the use of applications involving image analysis, geometric modeling or computer vision is common in transmitting sporting events. These applications allow, for example, annotation of sequences or the automatic selection of highlights of an event for a posteriori access [EKI 03, REN 09, YAN 08]. However, applications for three-dimensional (3D) reconstruction of sporting scenes remain extremely rare. This is due to the quantity of scientific issues caused by highly variable capture conditions (lighting, field, player kits, etc.) and the absence of information concerning acquisition parameters, leading to the use of a “raw” video flow (unknown camera parameters). Furthermore, the use of these applications during live events can only be envisaged if reconstruction is possible in real time (or almost real time). Complex systems have been proposed to overcome these difficulties, involving the use of multiple dedicated cameras; these systems represent a considerable outlay, can be difficult to implement and do not produce the desired automatic reconstruction [AMI 13, ORA 13, RED 13]. Certain research projects have focused on the automation of the reconstruction process using uncalibrated cameras and have offered innovative solutions [GRA 07, KIL 07, LE 06, LLU 11, TRI 13].
In this chapter, we will present the key stages of the reconstruction process, focusing on certain difficult points. In section 21.2, we will consider the analysis of color images with the aim of automatically selecting the playing surface. Section 21.3 concerns the extraction of markings on the playing field using Hough transforms. In section 21.4, we will consider the matching of primitives extracted from images with those used in the model of the scene.
21.2. Automatic selection of a region of interest (ROI)
21.2.1. ROI characterization
The ROI of a sporting scene is, naturally, the playing area. This playing area may often be characterized both as a region with a relatively uniform shade and as the largest quasi-connected component of the image under consideration (see Figure 21.1).
Figure 21.1. ROI of a football scene
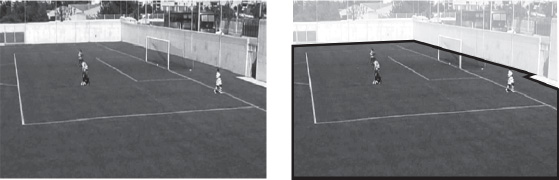
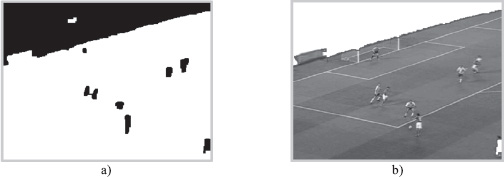
ROI characterization is an important stage in the reconstruction process. Images often include the environment of the playing area, such as stands, athletic tracks, security personnel and advertisements. Knowledge of the ROI, as shown in Figure 21.2, allows us to immediately validate elements present in the playing area.
Figure 21.2. Automatic pitch mark detection without ROI a) and with ROI b)

21.2.2. Color coherence
ROI determination, which is essentially defined by the notion of color coherence, may appear easy at first glance. However, the color is only apparently homogeneous. In fact, the discrete representation of color, in any representation space, uses discrete components that are not sufficiently similar. Various authors have proposed approaches to characterizing regions of the color space which support this homogeneity [DAI 95, LEF 00, LUC 01, VAN 00]. The interest of using a 3D space to segment a color image has been demonstrated on a number of occasions [CAR 95]. In this section, we use the hue lightness saturation (HLS) representation space to illustrate an entirely automated selection method for the color attributes of an ROI. In many respects, the methodology represented here is similar to those using Parzen windows [PAR 62]. It consists of grouping similar colors within the representation spaces and separating clouds of different colors in order to isolate and extract as many “dense” clouds as there are dominant color regions in the image: this is the color coherence criterion. The effectiveness of this approach lies in the continuous representation of the colors of pixels in the image [LE 04]. The use of computers engenders a discrete representation of color spaces, which creates difficulties in analyzing the distribution of colors associated with the pixels in an image.
The first idea consists of calculating a histogram of colors in an image, and retaining only the most common colors. Clearly, the results obtained using this method are not particularly satisfactory. However, based on this histogram, we can construct a continuous and efficient representation. First, we must divide the color space into cells, roughly representing a single color (see Figure 21.3).
During the second stage, the use of a potential function in this rough space allows us to define a continuous color representation space. The purpose of the potential function is to establish links not only between neighboring points, but also between similar regions (e.g. different greens), while separating characteristic clouds of each dominant color in the image. To do this, each point of the color space (corresponding to a pixel in the image) is considered as a source of potential. The potential function may be a simple decreasing linear function of the distance from the point, with a value of 1 at the point, supported by a disk of radius Dmax = R * (1 + ∊), where R represents the radius of the cell in question and ∊ represents an absorption value.
The retained dominant color regions are obtained by thresholding in the HLS space modified by the potential function. The threshold may be obtained automatically by segmenting the cumulated histogram of potential values. In cases where several dominant color regions are present in the image, these may be identified by propagation using neighborhood relationships from the rough partitioning chosen for the HLS space.
Figure 21.3. a) A slice of the HLS space; b) partition of this space into 554 cells
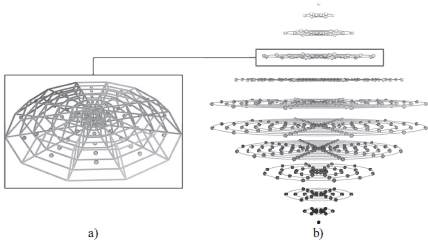
Figure 21.4. Influence of points P1, P2 and P3 on neighboring cells
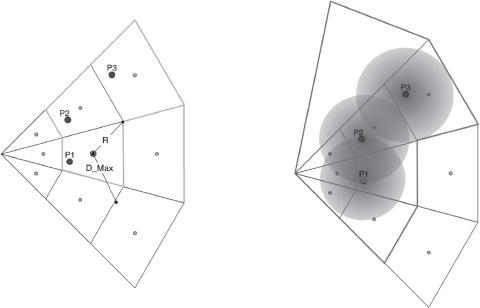
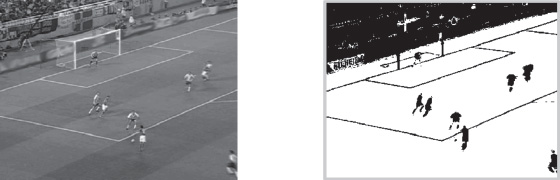
Figure 21.5 shows the results of fully automated selection for a football scene. These results show the desired region, and also show pitch markings, which need to be extracted for the purposes of 3D reconstruction.
Figure 21.5. On the right, the pixels retained by colorimetric analysis are shown in white
21.2.3. Spatial coherence
While ROI selection is essentially based on the notion of color, we also need to take into account the spatial coherence of this region. At the end of the color-based treatment, the binary mask produced may contain small regions associated with elements of the same color in the image (advertising boards, banners, flags etc.). The ROI is considered to be the largest connected component of the image. In reality, the region is “almost” connected: small channels remain, which must be filled without connecting elements from outside the pitch. Moreover, certain elements of the ROI are not of the same color, such as pitch markings. Elementary mathematical morphology operators [SER 88] may be used to remove these elements. The ROI is selected once the largest region has been filled (see Figure 21.6).
Figure 21.6. a) Binary image of Figure 21.5 after closing and opening; b) selected ROI
21.3. The Hough transform
A variety of methods may be used to extract characteristic elements from an image, but our goal in this section is not to provide a complete overview of these approaches. For sporting scenes, pitch markings are often made up of straight and ellipse arc segments, and the Hough transform [ILL 88] is ideally suited to characterizing these simple geometric primitives.
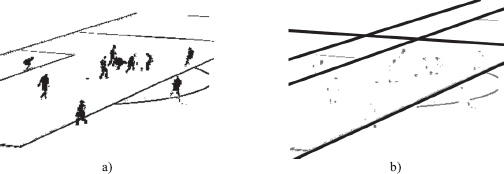
The detection of straight lines using the Hough transform is a textbook case. However, detection becomes more difficult when segments cross over, are affected by noise or are partially obscured. In sporting scenes, lines can be partially thickened or hidden by players. In these cases, pairs must be carefully selected from the retained characteristic points to participate in determining the Hough space. Figure 21.7 shows this type of image and demonstrates the effectiveness of pitch marking detection.
Figure 21.7. a) the results of colorimetric analysis; b) line detection after player deletion
21.3.1. Detection of ellipse arcs
The detection of ellipses or ellipse arcs is harder than the detection of straight lines. Certain methods use variable ellipses, which adapt to data according to different criteria [KAN 01, MAT 00] with a variable degree of success. In this section, we demonstrate the use of the Hough transform for such cases.
The most general Cartesian equation for an ellipse is expressed using six parameters connected by a proportionality relationship, meaning that an ellipse is characterized by five effective parameters. A Hough transform of 5–1 cannot be used for detection in these cases for reasons of complexity (parameter space of dimension 5), lack of precision and homogeneity in the parameter space. Several studies have been carried out based on the division of the Hough space into multiple sub-spaces [AGU 95, HO 95, PAO 93, YUE 89].
A characteristic property of the tangents of an ellipse is: “let M1 and M2 be two points of the ellipse, T1 and T2 the tangents at these points, I the point of intersection of T1 and T2, and J the middle of M1M2; the straight line (IJ) passes through the center O of the ellipse”. Using this property, it is possible to break the search down into two searches, one in dimension 2 and the other in dimension 3. Based on this breakdown, the main stages of the detection process are as follows:
– Characterization of relevant pairs (point, tangent): for each point, we use neighbors to determine whether or not we can associate an estimated tangent.
– Search for the center of ellipse: using the retained set of pairs (point, tangent) and the property described above, it is possible to detect the center of ellipses with arcs appearing in the image.
– Calculation of parameters a, b, θ: once the ellipse has been recentered, an expression exists as a function of the angle θ made by its long axis with axis Ox and the parameters a and b of its normalized expression (where a and b are half-lengths of the long and short axes).
– Calculation of the ellipse arc: once an ellipse has been detected, the corresponding ellipse arcs can be extracted by studying the distribution of points associated with the shape.
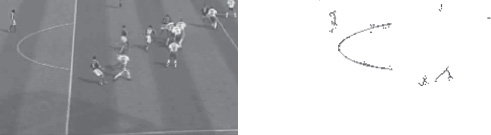
Figures 21.8 and 21.9 show the obtained results. In Figure 21.8, the detected ellipse is formed by four ellipse arcs.
Figure 21.8. Detection of the center circle
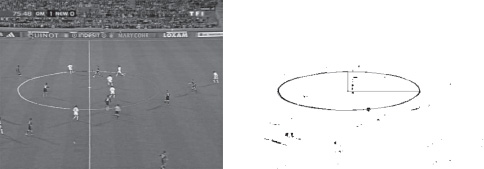
Figure 21.9. Detection of the 18 m arc
21.4. Matching image features to the geometric model
The matching of characteristic elements between an image and a geometric model is a particularly difficult process, as it requires the comparison of elements of different natures: pixels from the image and elements of the model. In reconstructing sporting scenes, work has naturally been carried out on matching pitch markings, often lines and ellipses as discussed in section 21.3, with the same elements defined in the model of the scene to reconstruct [FAR 05, HAY 05, OKU 04, THO 07]. The images for treatment are a partial representation of the model. Thus, detected elements form a very limited subset of the set of primitives defined in the model. Matching these elements with elements of the model may be guided by similarity measures based on knowledge of the model: relative line positions, distances and dimensions. This type of solution is too strongly linked to the characteristics of the model to be used in a more general context. However, the use of parallel lines as markers is common to many sports pitches; it is useful to identify this information within the detected elements in order to introduce it into the mapping stage. The following section offers a geometric method for selecting converging lines in an image.
21.4.1. Converging lines
The detection of converging lines has often been compared to the detection of receding points. There are intrinsic problems in the detection of receding points in an image, linked to the search space. This problem is often resolved by using methods based on the use of a Gaussian sphere for the search space [BAR 83, MAG 84]. These methods use accumulation-type approaches, which create certain other difficulties (discretization, maxima searches, etc.). In order to be robust, these methods require heavy calculations, additional knowledge or the use of uncertainty models. Furthermore, accumulation-type methods involve the implicit hypothesis that the number of occurrences of an observed phenomenon (converging lines) is high, something that is not guaranteed in images of sporting scenes. In reality, these images are projections of a model (the field), which is often made up of two sets of parallel lines (groups formed by small numbers of lines).
The use of certain geometric properties allows us to detect sets of converging lines in an image without needing to use an accumulation space. First, we must identify the sets formed by exactly three lines in the image. Second, these sets are combined by considering their shared lines.
Using a Thales circle (a semicircle whose diameter is the hypotenuse of a right-angled triangle), we may give the following corollary:
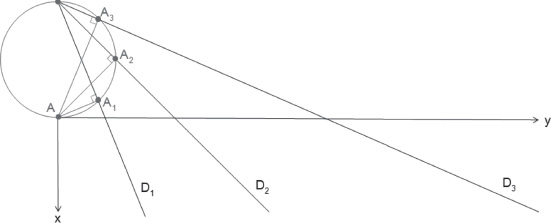
COROLLARY 21.1 (THALES).– Take three lines D1, D2 and D3. Let A be any point not belonging to D1, D2 or D3. Let A1, A2 and A3 be the orthogonal projections of A onto D1, D2 and D3, respectively. If the circle formed by A1, A2 and A3 passes through A, then we have a Thales circle. Thus, lines D1, D2 and D3 intersect at the same point.
Figure 21.10 illustrates this corollary. It is important to note that, by construction, lines A1, A2 and A3 form a set of lines that intersects the set defined by D1, D2 and D3 at a right angle. Moreover, the set formed by D1, D2 and D3 and the set formed by A1, A2 and A3 are in homographic correspondence. Thus, we obtain an application of the Chasles–Steiner theorem, which shows that a homography between two sets of lines defines a conic, in the Euclidean space. As the sets intersect at right angles, the conic is a circle.
Figure 21.10. Point A and its projections form a circle
It is not difficult to verify that point A and its projections are cocyclic, but this may be a source of numerical problems. To avoid explicit calculation of the parameters of the circle, we may use Ptolemy’s theorem, which simply requires calculation of the points (orthogonal projections of A onto the different lines in the image) located in the image (or in close vicinity).
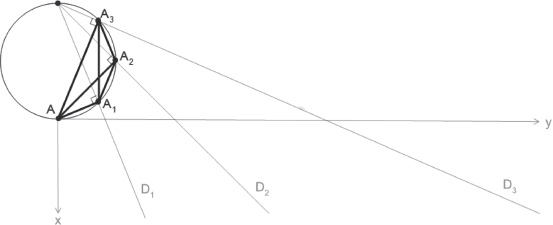
THEOREM 21.1 (PTOLEMY’S THEOREM).– A convex quadrilateral is inscribable if, and only if, the product of the lengths of the diagonals is equal to the sum of the products of the lengths of opposite sides.
It is interesting to note that infinite receding points are treated “naturally”. The Thales circle formed by a set of straight lines (participating in an infinite receding point) corresponds to a “flat circle”, and the lines therefore verify Ptolemy’s theorem.
Figure 21.11. The quadrilateral defined by points A, A1, A2, A3 is inscribable
A similarity criterion is needed to identify line triplets belonging to the same set. An intuitive idea would be to compare the Thales circles defined by these line triplets, but this requires us to calculate the parameters of these circles, something which we are able to avoid. Another possibility is the use of an accumulation space to highlight equivalent Thales circles, but this is meaningless given the limited number of circles shown in the images. By considering the lines shared between triplets, we are able to identify triplets with potential sets. If a triplet of competing lines shares none of its lines with another triplet, then it corresponds to a set of three lines. If, on the other hand, a triplet of competing lines shares two lines with other triplets, then each line of these triplets belongs to the same set. As the number of triplets is limited, we may simply combine triplets to verify these two properties and, where possible, to fuse them.
Figure 21.12 illustrates the results of detection of two sets of converging lines in the presented binary image. In this way, a line resulting from a detection error is eliminated. Moreover, in addition to providing additional information for the lines, this step allows us to validate the set of elements that are candidates for matching.
Figure 21.12. a) Set of detected lines; b) two groups are retained, and the line shown in black is excluded

The information associated with converging lines generally allows us to class lines that are candidates for matching into two groups. This greatly facilitates the matching stage, in that the problem is reduced to a “which is which?” search with a reduced set of parallel lines.
21.5. Conclusion
The segmentation of sequences in team sport scenes constitutes a major hindrance to the establishment of fully automatic reconstruction mechanisms. These sequences include variable bases and changing lighting, motion blurring and camera distortion, factors that explain the difficulties involved. The identification and tracking of multiple players on the pitch also remains difficult, both as a result of segmentation problems and because of multiple occultations in the course of a sequence. In terms of televised diffusion, the added value produced by player tracking does not justify the significant cost involved in installing specific cameras and the use of dedicated operators, although information such as player positioning and the distances covered in the course of a match constitutes a useful contribution to a post-match analysis.
In this chapter, we have demonstrated the possibility of automating certain stages of the reconstruction process. The proposed methods are robust, automatic and operate in real time. They have been implemented in the form of a software prototype that has been used by several football training centers [PET 08, POP 08, VAL 13]. Nevertheless, it is difficult to envisage fully automatic reconstruction without a material infrastructure offering several views of the same playing surface in order to resolve problems of occultation between players, for example. While these systems do already exist, the algorithms they use do not offer sufficiently good performances, and they only offer supervised reconstruction of short image sequences.
Figure 21.13 shows a circular movement at a constant height produced from the position of the camera: the first image (a) is that produced from the camera, image (b) is a combination of image (a) with a synthesized image (c), i.e. the 3D reconstruction of the image. Images (d), (e) and (f) are synthesized. These images are obtained by sequential rotation of the virtual camera by –10° around the vertical axis passing through the projection on the pitch in the center of the image.
Figure 21.13. Reconstruction of a real scene
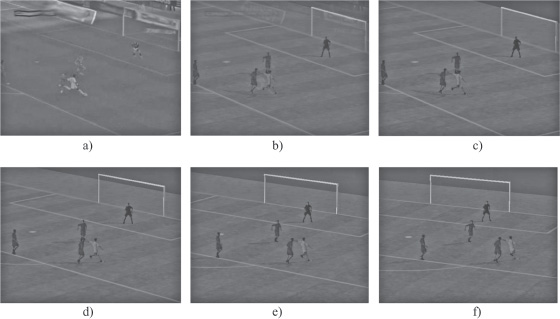
Figure 21.14 is an illustration of a real situation processed by the SimulFoot training program [MAV 13]: an image is selected from a video (a), and then reconstructed in a realistic (b) and symbolic manner (c). This virtual representation may then be viewed from different perspectives, including those of players (d). It may also be replayed, either identically or with a different outcome.
Figure 21.14. Different views of a reconstruction

21.6. Bibliography
[AGU 95] AGUADO A., MONTIEL M., NIXON M., “Ellipse extraction via gradient direction in the hough transform”, Proceedings of IEE 5th International Conference on Image Processing and its Applications, IEE, Edinburgh, UK, pp. 375–378, July 1995.
[AMI 13] AMISCO, “Sport universal”, available at http://www.sport-universal.com, 2013.
[BAR 83] BARNARD S.T., “Interpreting perspective images”, Artificial Intelligence, vol. 21, pp. 435–462, 1983.
[CAR 95] CARRON T., Segmentations d’images couleur dans la base teinte-luminance-saturation: approche numérique et symbolique, PhD Thesis, University of Savoie, France, 1995.
[DAI 95] DAILIANAS A., ALLEN R.B., PAUL E., “Comparison of automatic video segmentation algorithms”, Proceedings of SPIE Photonics West, IOP Publishing Ltd., pp. 2–16, 1995.
[EKI 03] EKIN A., TEKALP A.M., “Automatic soccer video analysis and summarization”, IEEE Transactions on Image Processing, vol. 12, pp. 796–807, 2003.
[FAR 05] FARIN D., HAN J., DE P.H.N., “Fast camera-calibration for the analysis of sports sequences”, Proceedings of IEEE International Conference on Multimedia and Expo (ICME), Amsterdam, The Netherlands, pp. 482–485, 2005.
[GRA 07] GRAU O., HILTON A., KILNER J., et al., “A free-viewpoint video system for visualisation of sport scenes”, Motion Imaging, vol. 116, no. 5–6, pp. 213–219, May 2007.
[HAY 05] HAYET J.-B, PIATER J.H., VERLY J.G., “Fast 2D model-to-image registration using vanishing points for sports video analysis”, Proceedings of IEEE International Conference on Image Processing, ICIP 2005, Genoa, Italy, pp. 417–420, 2005.
[HO 95] HO C.-T., CHEN L.-H., “A fast ellipse/circle detector using geometric symmetry”, Pattern Recognition, vol. 28, no. 1, pp. 117–124, 1995.
[ILL 88] ILLINGWORTH J., KITTLER J., “A survey of the Hough transform”, Computer Vision, Graphics and Image Processing, vol. 44, no. 1, pp. 87–116, August 1988.
[KAN 01] KANATANI K.-I., OHTA N., “Automatic detection of circular objects by ellipse growing”, Memoirs of the Faculty of Enginieering, vol. 36, no. 1, pp. 107–116, 2001.
[KIL 07] KILNER J., STARCK J., HILTON A., et al., “Dual-mode deformable models for free-viewpoint video of sports events”, Proceedings of the 6th International Conference on 3-D Digital Imaging and Modeling, 3DIM ’07, IEEE Computer Society, Washington, DC, pp. 177–184, 2007.
[LEF 00] LEFÈVRE S., HOLLER J., VINCENT N., “Real time temporal segmentation of compressed and uncompressed dynamic colour image sequences”, Proceedings of International Workshop on Real Time Image Sequence Analysis, Oulu, Finland, pp. 56–62, 2000.
[LE 04] LE TROTER A., MAVROMATIS S., SEQUEIRA J., “Soccer field detection in video images using color and spatial coherence”, Proceedings of ICIAR - International Conference on Image Analysis and Recognition, vol. 2, ICIAR, Porto, Portugal, pp. 265–272, 2004.
[LE 06] LE TROTER A., Mise en correspondance d’images et de modèles : application à la reconstruction 3D de scènes sportives, PhD Thesis, University of Aix-Marseilles, 2006.
[LLU 11] LLUCIA L., Suivi d’objets à partir d’images issues de caméras mobiles non calibrées, PhD Thesis, Université Aix-Marseille II, 2011.
[LUC 01] LUCCHESE L., MITRA S.K., “Color image segmentation: a state-of-the-art survey”, Proceedings of the of the Indian National Science Academy (INSA-A), vol. 67, pp. 207–211, 2001.
[MAG 84] MAGEE M.J., AGGARWAL J.K., “Determining vanishing points from perspective images”, Computer Vision, Graphics, and Image Processing, vol. 26, no. 2, pp. 256–267, 1984.
[MAT 00] MATEI B., MEER P., “Reduction of bias in maximum likelihood ellipse fitting”, Proceedings of the 15th International Conference Pattern Recognition, vol. 3, Barcelona, pp. 794–798, September 2000.
[MAV 13] MAVROMATIS S., “SimulFoot”, available at http://sebastien.mavromatis.perso.luminy.univ-amu.fr/SimulFoot/docs/assets/SimulFoot_08.pdf, 2013
[OKU 04] OKUMA K., LITTLE J.J., LOWE D.G., “Automatic rectification of long image sequences”, Asian Conference on Computer Vision, Jeju Island, Korea, January 2004.
[ORA 13] “ORAD – 3D replay”, available at http://www.orad.tv/products/3dreplay, 2013.
[PAO 93] PAO D.C.W., LI H.F., JAYAKUMAR R., “A decomposable parameter space for the detection of ellipses”, Pattern Recognition Letters, vol. 14, no. 12, pp. 951–958, 1993.
[PAR 62] PARZEN E., “On estimation of a probability density function and mode”, The Annals of Mathematical Statistics, vol. 33, no. 3, pp. 1065–1076, 1962.
[PET 08] PETIT J.-P., RIPOLL H., “Scene perception and decision making in sport simulation: A masked priming investigation”, International Journal of Sport Psychology, vol. 39, no. 1, pp. 1–19, 2008.
[POP 08] POPLU G., RIPOLL H., MAVROMATIS S.J.B., “How do expert soccer players encode visual information in order to make decisions in simulated game situations?”, Research Quarterly for Exercise and Sport, vol. 79, no. 3, pp. 392–398, 2008.
[RED 13] “Red Bee Media – Piero”, available at http://www.redbeemedia.com/piero/piero, 2013.
[REN 09] REN R., JOSE J., “General highlight detection in sport videos”, in HUET B., SMEATON A., MAYER-PATEL K., AVRITHIS Y., (eds), Advances in Multimedia Modeling, Lecture Notes in Computer Science, vol. 5371, Springer, Berlin, Heidelberg, pp. 27–38, 2009.
[SER 88] SERRA J., (ed.), Image Analysis and Mathematical Morphology, vol. 2, Theoretical Advances, Academic Press, London, San Diego, New York, 1988.
[THO 07] THOMAS G.A., “Real-time camera tracking using sports pitch markings”, Journal of Real-Time Image Processing, vol. 2, no. 2–3, pp. 117–132, 2007.
[TRI 13] TRIC TRAC, “TricTrac”, available at http://www.multitel.be/trictrac/?mod=1, 2013.
[VAL 13] VALORPACA, “SimulFoot”, available at http://valorpaca.univmed.fr/IMG/fiches marketing/fiche marketing_simulfoot.pdf, 2013.
[VAN 00] VANDENBROUCKE N., Segmentation d’images couleur par classification de pixels dans des espaces d’attributs colorimétriques adaptés. Application à l’analyse d’images de football, PhD Thesis, University of Lille, 2000.
[YAN 08] YAN F., CHRISTMAS W., KITTLER J., “Layered data association using graph-theoretic formulation with application to tennis ball tracking in monocular sequences”, IEEE Transactions on Pattern Analysis and Machine Intelligence, vol. 30, no. 10, pp. 1814–1830, October 2008.
[YUE 89] YUEN H.K., ILLINGWORTH J., KITTLER J., “Detecting partially occluded ellipses using the Hough transform”, Image and Vision Computing, vol. 7, no. 1, pp. 31–37, February 1989.