Microcontroller-Based Project Development Cycle
Abstract
Before developing a microcontroller-based system it is worthwhile to know the microcontroller-based system development cycle. Microcontroller-based project development cycle has two stages: program development cycle (PDC) and hardware development cycle (HDC). The PDC includes computer-aided tools such as the program description language (PDL) flow charts and so on, used to ease the task of programming and testing a microcontroller-based system. The HDC also uses computer-aided tools such as printed circuit design tools and hardware testing tools. Both development cycles are based around simple loops. This chapter describes briefly both the PDC and the HDC when developing a microcontroller-based system.
Keywords
Hardware development cycle; Software development cycle; Program description language; IDE; PDL; UML
2.1 Overview
Microcontroller-based project development cycle has two stages: program development cycle (PDC) and hardware development cycle (HDC). Both development cycles are based around simple loops. In this section we briefly look at both the development cycles.
2.1.1 The Program Development Cycle (PDC)
Fig. 2.1 shows the program development cycle (PDC) which basically consists of developing the application program. This is usually carried out using a development board (or a development kit) incorporating the target microcontroller and additional components and interface devices (e.g., transistors, LEDs, motors, relays, sensors, etc.) that may be required for the project. At the beginning of the PDC we write the source code using the in-built text editor of the chosen integrated development environment (IDE). We then compile the source code and remove any syntax errors or any other compile time errors. Notice that at this stage we are not sure whether our source code is logically correct or not. At this stage we can either simulate or debug our source code using the tools offered by the IDE. Using the simulator has the advantage that we can test our source code on our PC without having to upload the executable code to the program memory of the target microcontroller. With the help of the simulator we can single step through our source code, examine the variables, insert breakpoints, modify the variables, and so on. Simulators are available almost on all IDEs and they are very easy to use. Simulation helps the programmer to verify that the source code may be logically correct and the application is probably working. Of course simulation is not same as the real testing using the target hardware. There still could be logical errors and the application may not behave as desired and such errors will not be shown during the simulation stage. If any errors are detected at the simulation stage we should go back and correct the source code to remove these errors. After a successful simulation the next stage in the PDC cycle is to upload the executable code to the program memory of the target microcontroller (on the development board). The program is then tested on the real hardware to ensure that the project is working as desired. Enough time should be spent at this stage in order to find out if there are any application errors. If any errors are detected then we should go back to the beginning of the cycle and correct our source code to remove these errors. The above loop should be repeated until all the errors are removed from the project and we are completely satisfied with the correctness of the project.

2.1.2 The Hardware Development Cycle (HDC)
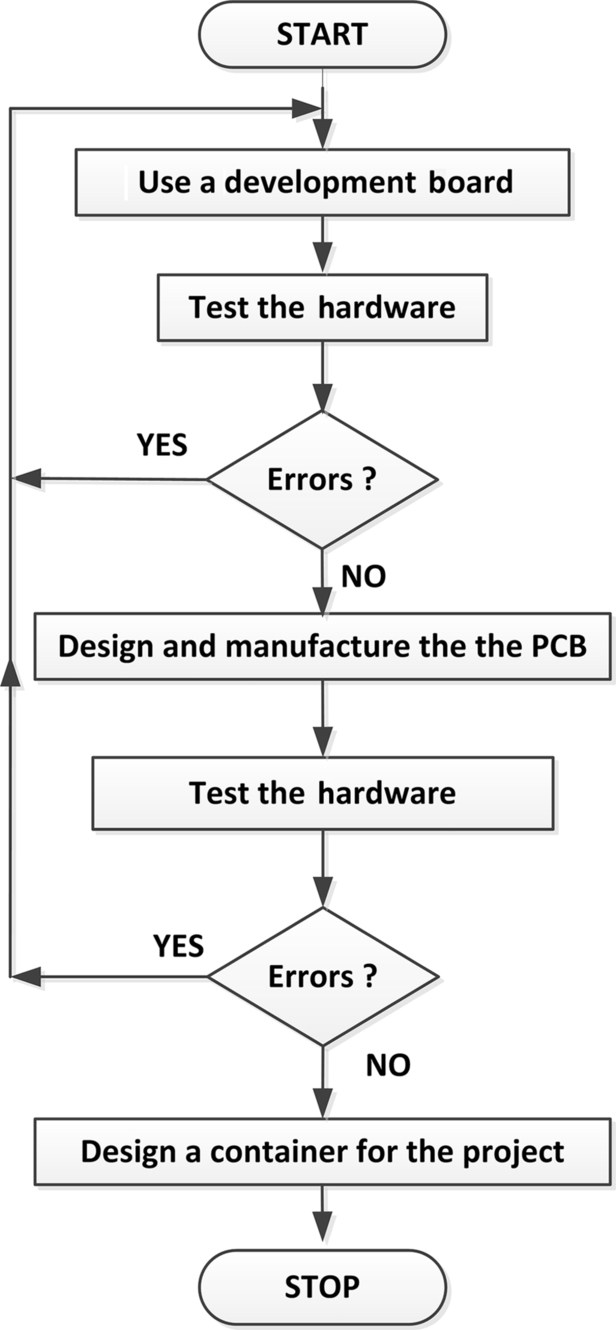
A typical hardware development cycle (HDC) is shown in Fig. 2.2. After testing our project with the developed source code and using the microcontroller development board together with the required support components and interfaces devices, the next stage of the project is to build the hardware on a printed circuit board (PCB). The complete circuit diagram is designed using an integrated schematic and PCB design software. The size of the final PCB is determined and the target microcontroller chip and all the other required components are placed on the PCB board using the PCB design software. The auto-router option is then used to interconnect all the components as is shown in the schematic. The next stage is the manufacturing of sample PCB boards which is normally done by sending the necessary PCB files to a qualified PCB manufacturer. The executable code is uploaded to a target microcontroller chip and all the components are then mounted and soldered on the PCB board (this step can also be done by the PCB manufacturers). The prepared hardware is then tested together with any external devices. If the project is successful the final stage is usually the design and manufacturing of a suitable container for the project.
2.2 Program Development Tools
Simple programs consisting of no more than 10 lines of code can easily be developed by writing the code without any prior preparation. The development of large and complex programs is easier if an algorithm is first derived and the program is broken down into smaller modules. The actual coding becomes an easy task after the algorithm is available. An algorithm describes the operational steps of a program and it can be in the form of graphical or text based, such as flow charts, data flow diagrams, structure charts, program description languages (PDLs), and unified modeling languages (UMLs). Flow charts can be very useful tools to describe the flow of control in small programs where there are no more than a few pages of diagrams. The problem with graphical tools is that it can be time consuming to draw or to modify them, especially if there is more than one diagram extending over several pages. PDL is not a programming language. It is a collection of text-based keywords and actions that help the programmer to describe the flow of control and data in a program in a stepwise and logical manner. The main advantage of the PDL is that it is very easy to modify a given PDL since it only consists of text.
In this book we shall be using PDLs wherever possible, and flow charts will also be given where it is felt to be useful. In the next section we shall be looking at the basic constructs of PDL and at the same time show the equivalent flow chart of each PDL construct.
Note: There are many free of charge programs available on the Internet that can be used to help draw flow chart easily. Some of these programs are as follows: Microsoft Visio, Dia, yEd Graph Editor, ThinkComposer, Pencil Project, LibreOffice, Diagram Designer, LucidChart, etc.
2.2.1 BEGIN-END
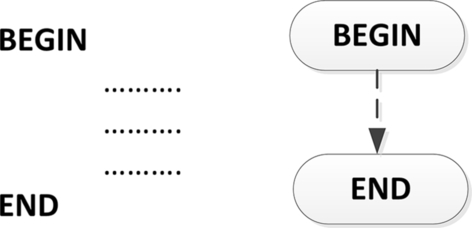
Every PDL description must start with a BEGIN and terminate with an END. The keywords should be in bold and the statements inside these keywords should be indented to make the reading easier. An example is shown in Fig. 2.3.
2.2.2 Sequencing
In normal program flow, statements are executed in sequence one after the other. The operations to be performed in each step are written in plain text. An example of sequencing is shown in Fig. 2.4 together with its flow chart equivalent.

2.2.3 IF-THEN-ELSE-ENDIF
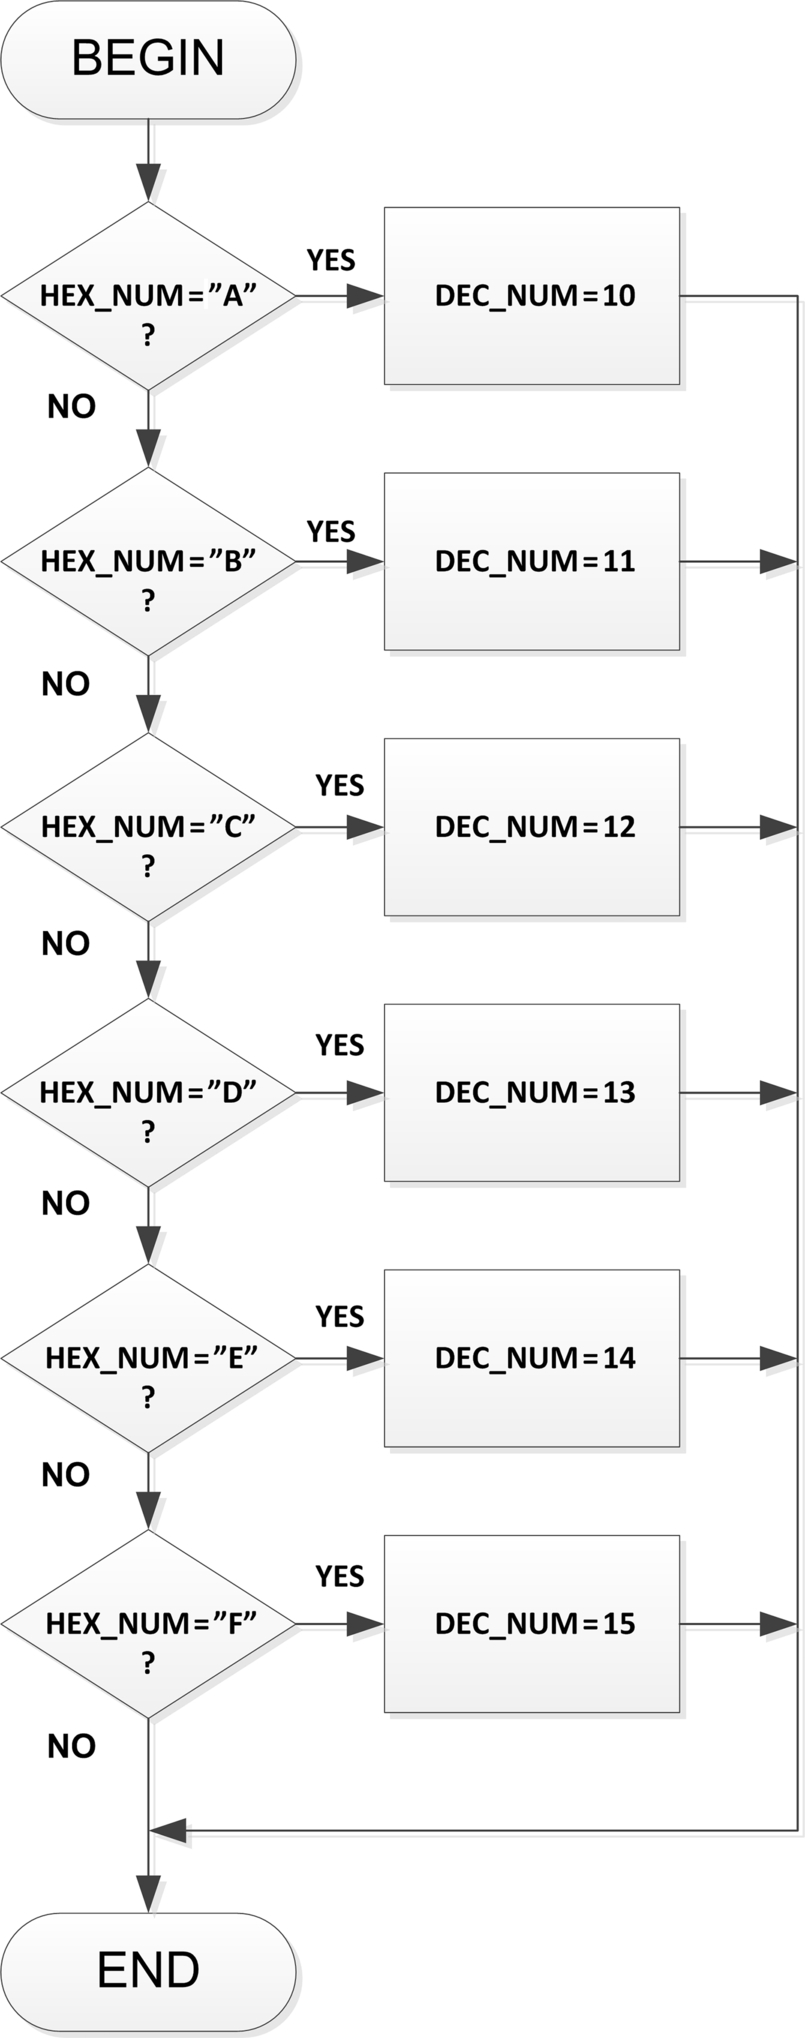
The IF-THEN-ELSE-ENDIF statements are used to create conditional statements and thus to change the flow of control in a program. Every IF statement must be terminated with an ENDIF statement. The ELSE statement is optional and if used it must be terminated with an ENDIF statement. It is also permissible to use ELSE IF statements in programs where multiple decisions have to be made. Figs. 2.5–2.7 show various examples of using the IF-THEN-ELSE-ENDIF statements.


2.2.4 DO-FOREVER-ENDDO
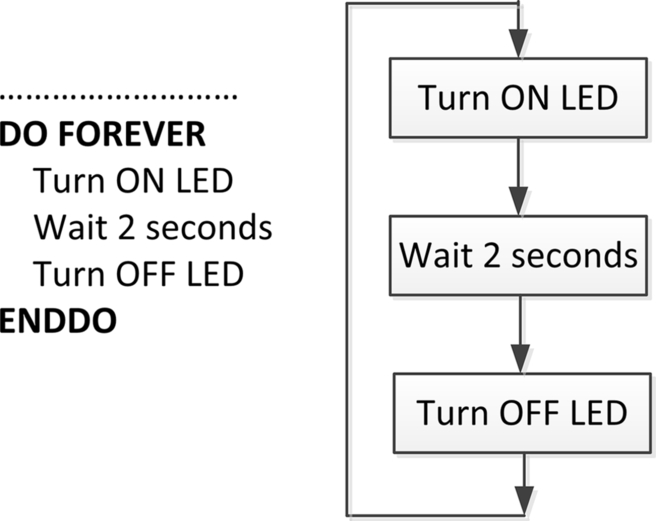
The DO-FOREVER-ENDDO statement is used to repeat a loop forever. This kind of loop is commonly used in microcontroller applications where an operation or a number of operations are executed continuously. Fig. 2.8 shows an example of using the DO-FOREVER-ENDDO statement.
2.2.5 DO-ENDDO
The DO-ENDDO statement is used to create loops (or iterations) in programs. Every Do statement must be terminated with an ENDDO statement. It is permissible to use conditions after the DO statement to create conditional loops. An example DO-ENDDO loop is shown in Fig. 2.9 where the LED is flashed 10 times with 2 s delay between each output. Another example DO-ENDDO loop is shown in Fig. 2.10.


2.2.6 REPEAT-UNTIL
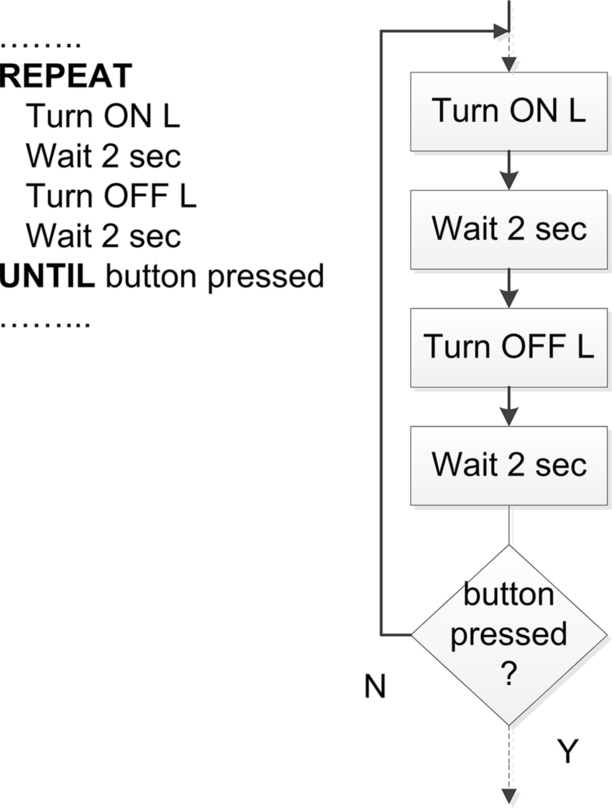
The REPEAT-UNTIL statement is similar to DO-ENDDO statement but here the condition to terminate the loop is checked at the end and therefore the loop is executed at least once. Fig. 2.11 shows an example of REPEAT-UNTIL loop.
2.2.7 Subprograms
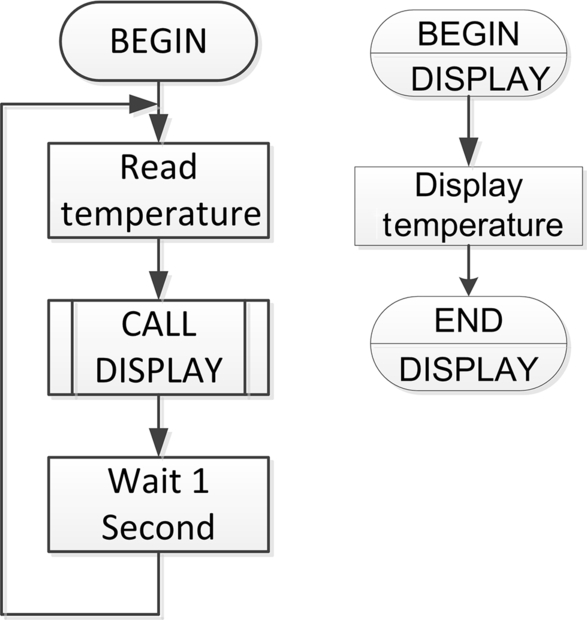
There are many ways that subprograms can be represented in PDLs and in flow charts. Since subprograms are independent program modules they must start and finish with the BEGIN and END statements, respectively. We should also include the name of the subprogram after the BEGIN and END keywords. Fig. 2.12 shows an example of subprogram called DISPLAY. Both the PDL and the flow chart representation of the subprogram are shown in this figure.

2.2.8 Calling a Subprogram
A subprogram can be called from the main program or from another subprogram. In PDLs, a subprogram is called by using the keyword CALL, followed by the name of the subprogram. In flow charts it is common practice to insert vertical lines at the two sides of the box where the subprogram is called. Fig. 2.13 shows an example of where subprogram DISPLAY is called from a program.

2.3 Examples
Some simple examples are given in this section to show how the PDLs and their equivalent flow charts can be used in program development.
The required flow chart is shown in Fig. 2.14. Notice that it is much easier to write the PDL statements than drawing the flow chart shapes and writing text inside them.
The required flow chart is shown in Fig. 2.15.

The required flow chart is shown in Fig. 2.16.

The required flow chart is shown in Fig. 2.17.
2.4 Summary
In this chapter we have learned about the following:
- • Program development cycle
- • Hardware development cycle
- • Program development tools
- • PDLs
- • Flow charts
2.5 Exercises
- 1. What are the advantages and disadvantages of flow charts?
- 2. It is required to write a program to calculate the sum of even integer numbers from 1 to 10. Draw the flow chart to show the algorithm for this program.
- 3. Write the PDL statements for exercise (2) above.
- 4. It is required to write a function to calculate the area of a cylinder given its radius and height. Draw flow charts to show how this function can be implemented. Also, draw a flow chart to show how the function can be called from a main program to calculate the area of a cylinder whose height is 2.5 cm and its radius is 3 cm.
- 5. Draw the equivalent flow chart for the following PDL statements:
- BEGIN
- DO 10 times
- Turn ON relay
- Wait 1 second
- Turn OFF relay
- Wait 1 second
- ENDO
- END
- 6. A push-button switch is connected to a microcontroller input ports. Also, an LED is connected to an output port. It is required to flash the LED three times when the button is pressed. Draw a flow chart to show how the program can be designed.
- 7. Write the PDL statements for exercise (6) above.
- 8. It is required to write a function to convert meters to inches. Draw a flow chart to show how this function can be designed. Also, draw a flow chart to show how the function can be called from a main program to convert 5 m to inches.
- 9. Write the PDL statements for exercise (8) above.
- 10. A temperature sensor chip is connected to an input port of a microcontroller. At the same time an LCD is connected to the output ports. Write a program to read the temperature every minute and then display it on the LCD both in degrees Fahrenheit and in degrees Centigrade.
- 11. Draw the flow chart equivalent of the following PDL:
- BEGIN
- Configure the output port
- IF switch 1 is pressed THEN
- Start the motor
- ELSE IF switch 2 is pressed THEN
- Start the pump
- ELSE
- Turn ON the LED
- ENDIF
- END
- 12. Draw the flow chart equivalent of the following PDL:
- BEGIN
- Wait for switch to be pressed
- Turn ON the buzzer
- Wait 5 seconds
- Turn OFF buzzer
- Wait until switch is released
- END
- 13. Draw the flow chart equivalent of the following PDL:
- BEGIN
- DO FOREVER
- IF motor is ON THEN
- Turn ON pump
- Wait for 5 seconds
- ELSE
- Turn ON alarm
- Wait for 10 seconds
- Turn OFF alarm
- ENDIF
- ENDDO
- END