
Chapter 20
Headers and Footers and Groups, Oh My!
In This Chapter
![]() Placing your records in ordered groups
Placing your records in ordered groups
![]() Resizing your report’s sections
Resizing your report’s sections
![]() Customizing your report’s layout
Customizing your report’s layout
![]() Using headers and footers exactly as you need them
Using headers and footers exactly as you need them
![]() Expressing yourself through footers
Expressing yourself through footers
![]() Inserting date and time information
Inserting date and time information
The Report Wizard takes much of the stress and decision-making out of creating reports. This is also true of the Report tool, which asks no questions at all and just turns your table into a report — bang, zoom, no fuss, no muss. The Report Wizard is almost that simple; it asks just a few simple questions that you won’t have any trouble answering.
Well, maybe no trouble. A few of the questions, which I address in this chapter, may give you a moment’s pause, if only because you may not understand what’s being asked or how your answer can affect your report. Given that this book is all about eliminating any stress or concern for the Access user, my goal is to explain those questions — and to help you make the Report Wizard even more wizardly.
In addition to simplifying the already-simple Report Wizard, this chapter also covers the use of two very convenient and powerful report features — headers and footers. These stalwart additions appear at the top and/or bottom of your reports, performing whatever role you dictate — from eye candy to outright informers. They can be very spare and simply tell your readers what the name of the report is, or they can be really useful and tell people when the report was created, when it was last printed, or that the data within it is proprietary or confidential. What you include in your headers and footers is entirely up to you.
A Place for Everything and Everything in Its Place
The secret to successful report organization lies in the way you set up the information included in the report. Access enables you to choose how your fields are laid out on the report, enabling you to achieve the most effective layout for the data in question.
A report is effective when the reader can glance at it and see exactly what information is offered:
- What data is included
- How much detail is available
- Where to look on the page to find specific pieces of information
Achieving an effective layout is simple; the automatic reporting tools in Access create a very basic, no-confusion-here layout by default.
Layout basics
Reports come in two layouts, Columnar or Tabular.
 The layout that’s right for your report is totally subjective. You can preview your report in both layouts and make your decision accordingly.
In either layout, each of the fields you choose to include in your report appears in two parts:
- Fields
- Labels (a name for the field, essentially)
The fields and labels are paired and laid out in either Columnar or Tabular format.
This chapter shows how you can take the default layouts that Access’s automatic reporting features give you and tweak them by working in Design view. You can drag labels and fields around to achieve a completely custom report layout.
Here’s the skinny on how Columnar and Tabular layout options look and work:
- Columnar layout:
-
Field descriptions print with every record’s data (side by side), as shown in Figure 20-1.
The layout behaves this way because both the field descriptions and data area are in the report’s Detail section.
- The report title prints only once, at the very beginning of the report (because the title is in the Report Header section).
-
- Tabular layout:
- Field descriptions (labels) print once per page in the Page Header section, as shown in Figure 20-2.
- The data areas are in the Detail section.
- The title prints only at the top of the report.

Figure 20-1: In a Columnar report, labels are to the left of the fields and repeat for each record.

Figure 20-2: In a Tabular report, labels become column headings.
Sections
Reports are divided into sections. The information that appears in each section is dictated by your chosen layout.
Understanding the section concept is a prerequisite for performing any serious surgery on your report — or for running off to build a report from scratch. Otherwise, your report groupings don’t work right, fields are out of place, and you end up with a very frustrating, unfriendly report that neither you nor anyone else will want to read (or be able to use effectively).
 The most important point to understand about sections is that the contents of each section are printed only when certain events occur. For example, the information in the Page Header is repeated at the top of each page, but the Report Header prints on only the first page.
Getting a grip on sections is easy when you look at the innermost section of your report first and work your way outward, like so:
- Detail: Access prints items in this section each time it moves to a new record. Your report includes a copy of the Detail section for each record in the table.
-
Group headers and footers: You may have markers for one or more group sections.
In Figure 20-3, information in the report is grouped by Status. (You can tell by the section bar labeled Status Header — the section bar identifies which field is used for grouping.)
Group sections may contain:
- The group header section is above the Detail section in the report design.
- The group footer is always below Detail.
Information in these sections repeats for every unique value in the groups’ fields. For example, the report shown in Figure 20-3 reprints everything in the Status Header for each volunteer in the database, grouped by Status. Within the section for each status, Access repeats the information for each volunteer.
-
Page Header and Page Footer: These sections appear at the top and bottom, respectively, of every page. They’re among the few sections not controlled by the contents of your records.
Use the information in the Page Header and Footer sections to mark the pages of your report. - Report Header and Footer: These sections appear at the start and end of your report. They each make only one appearance in your report — unlike the other sections, which pop up many times.

Figure 20-3: Grouping volunteer records by Status.
Here’s what you can do with headers and footers:
- The Report Header provides general information about the report. This is a good place to add the report title, printing date, and version information.
- The Page Header contains any information you want to appear at the top of each page (such as the date or your company logo). If your report layout is set to Tabular, the column headings (field names) for the data included in the report are found in this section.
- The headers for each group usually identify the contents of that group and the field names.
- The footers for each group generally contain summary information, such as counts and calculations. For example, the footer section of the Department group may hold a calculation that totals the minimum bids.
- The Page Footer, which appears at the bottom of every page, traditionally holds fields for the page number and the report date.
-
The Report Footer in your report can be a good place to put things like these:
- Confidentiality statements
- Information regarding the timeliness of the data in the report
- The name(s) of the report’s author(s)
- An email address or phone number to contact the person who made the report
Grouping your records
When the Report Wizard creates a report for you, it includes a header and footer section for each group you want. If you tell the Report Wizard to group by the State field, for example, it automatically creates both the State Header and the State Footer sections. You aren’t limited to what the wizard does, though. If you’re a little adventuresome, you can augment the wizard’s work with your own grouping sections.
 Before making any big adjustments to the report, take a minute to save the report (choose Save from the Quick Access Toolbar). That way, if something goes wrong and the report becomes horribly chewed up, just close it (click the X at the end of the report’s tab) without saving your changes. Ahhh. Your original report is safe and sound.
The key to creating your own grouping sections is the Group, Sort, and Total panel — which is available after you’ve created a report with the Report Wizard or while you’re in Design view working on a customized report. To display the panel (shown in Figure 20-4), click the Ribbon’s Design tab and then click the Group & Sort button in the Grouping & Totals section.
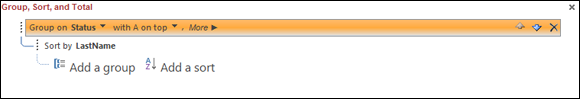
Figure 20-4: The Group, Sort, and Total panel.
This panel allows you to control how Access organizes the records in your report — augmenting the sorting and grouping you may have already set up, whether through the Report Wizard dialog box or while building a report from scratch in Design view.
You can completely customize how your report’s records are grouped and sorted and sort by multiple fields quickly and easily. The next set of steps shows you how.
To build your own groupings and add sorting with the Group, Sort, and Total panel, follow these steps:
- Click the Design tab in the Report Design Tools tab group.
-
Click the Group & Sort button in the Grouping & Totals section.
The Group, Sort, and Total panel appears beneath your report’s sections.
-
View any existing grouping or sorting, each represented by a Sort By or Group On bar, as shown in Figure 20-5.
The tree-like display shows the hierarchical groups and sorting currently set up for your report.
-
Click Add a Group (you may need to scroll down within the Group, Sort, and Total Section, as shown in Figure 20-6); when the pop-up menu appears, select a field by which to group.
Access displays a list of available fields you can choose and use to group your report’s records.
-
Click Add a Sort and select a field by which to sort from the pop-up menu.
Again, a list of fields appears. You can click a field to choose a new field on which to sort your records. If you can’t see these boxes (Add a Group and Add a Sort), scroll down, using the scroll bar on the right side of the workspace.
If you’ve already sorted by a field within the report, your subsequent sorting will be applied to the sort already applied. Here’s an example using the employee database: If you already elected to sort by Department (say, while you were setting up the report in the Report Wizard), that sort will appear in the panel. If you click Add a Sort, your next logical field on which to sort might be JobTitleorLastName. The resulting sort would then put the list — already in order by Department — in further order: putting the departments in order by field chosen for the added sort. All the Accounting department people will be ordered by that second field, all the Operations people, and so on. It’s a lot like the phone book (remember those?) — all the records in that book are in order by last name, and for those listings with the same last name, the records are in order by first name. If the first names are the same, a third order — by Street — is applied; if there are two John Smiths, the one on Elm Street comes before the one on Walnut Street. -
To change the settings for an existing group or sort, click the Group On or Sort By bar and change the sort order or pick a different field by which to sort.
Your sorting and grouping options are determined by the nature of the existing sort or group. For example, when the sort is based on a field that’s a
ShortorLong Textdata type, you can sort alphabetically. -
Close the Group, Sort, and Total panel.
You can close the panel after you’ve finished using it by
- Clicking the X in its upper-right corner.
- Clicking the Group & Sort button again (in the Grouping & Totals section of the Design tab).

Figure 20-5: Choose a new field by which to group or sort your records.

Figure 20-6: Choose the field you want to use for further grouping of your records in the report.
To remove a group, click the X on the far right end of the Group On or Sort By bar (visible in Figure 20-6). There is no confirming prompt; when you click that X, your group or sort is gone. Of course, you can re-group or re-sort by using the Add a Group or Add a Sort buttons.
So you want more?
In addition to adding and removing groups and sorts with the Group, Sort, and Total panel, you can make the following adjustments/selections:
-
On the Sort By bar, click More and view a list of options, including “By Entire Value,” “With No Totals,” “With Title” (click the Click to Add link to insert a title), and options for adding headers and footers for the sorted records.
To hide these options, click Less.
-
On the Group On bar, click More to make the same choices as to how to group the records, whether to include totals, and how to use headers and footers.
Click Less to hide the options on the bar when you’ve finished using them.
If you don’t see the More button, be sure to click the Group On bar to activate it.
With the appropriate fields in the correct header, footer, and detail sections, you’ve successfully finished the biggest step in building your report. Now you’re down to the little things — tweaking, adjusting, and touching up the details of how your report presents itself. The properties described in the following sections govern the visual aspect — the look and feel — of your report.
 Some of the stuff in the coming paragraphs looks a little technical at first glance because these settings dig deep into the machinery of report-making. Don’t let the high-tech look scare you. By organizing your headers, footers, and detail rows, you’ve already conquered the hard part of building the report. This other stuff’s just the window dressing.
Customizing Properties
In an amazing stroke of usability, Access keeps all property settings for your report in a single panel — the Property Sheet, which appears on top of your report (as shown in Figure 20-7, which shows the daunting All tab). But before you can start using the Property Sheet, you have to have it on your screen:
-
To start adjusting the details of any component of your report, either
- Click the item you want to modify.
- Right-click the item and choose Properties from the pop-up menu that appears.
- You can also display the Properties panel by clicking the Property Sheet button, found in the Tools section of the Design tab. The Design tab is one of four tabs available in the Report Design Tools section of the Ribbon.
When displayed, you can widen the Property Sheet panel by pointing to its left side. Your mouse pointer turns to a two-headed arrow; click and drag to the left — essential if you want to use the second column in the panel (which shows values and settings for each property). - To display the Property Sheet for the report, double-click the little box where the two rulers meet, just to the left of the Report Header.
- You can also double-click any part of the report to display the Property Sheet, focused on the part you double-clicked.
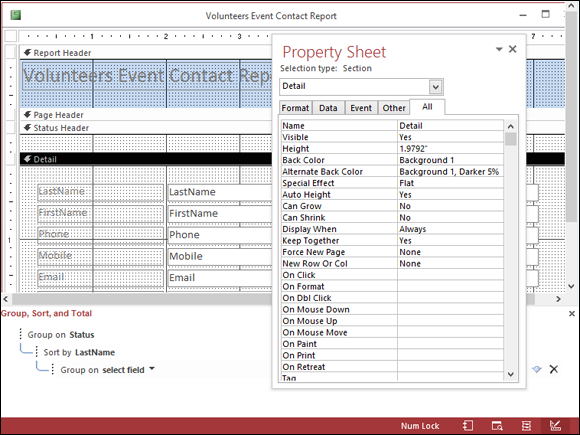
Figure 20-7: Double-click any piece of the report to see that item’s properties.
When the Property Sheet appears, its title bar indicates which part of the report you’re about to tweak. You can also click the drop-down list (which repeats the name of the currently displayed portion of the report’s properties) and choose a different component to work with.
The Property Sheet is very long and a bit scary-looking — but don’t worry about it. Regardless of which report component you choose to tweak (or if you’re looking at the properties for the entire report), some of the settings won’t need to be tweaked, and you’ll probably have no idea how to tweak them anyway. And that’s fine at this stage of the game. Seasoned Access users often leave many of these properties in their default state, because default settings are the defaults for a reason — they’re effective in most situations (and suit most users’ needs) without adjustment.
The Property Sheet has five tabs along the top of the list of properties — Format, Data, Event, Other, and All (which is the active tab in Figure 20-7). The only tab that’s really worth looking at is Format; the others are really only of interest to programmers, and All is just plain frightening because it lists every possible property you can adjust.
So, with the Format tab clicked, as shown in Figure 20-8, feel free to tweak away. Change the caption, decide whether you want scroll bars on the report when viewed onscreen, decide which pages should have a header or footer, and so on. Most of the properties’ names are pretty self-explanatory, so you should be fine.
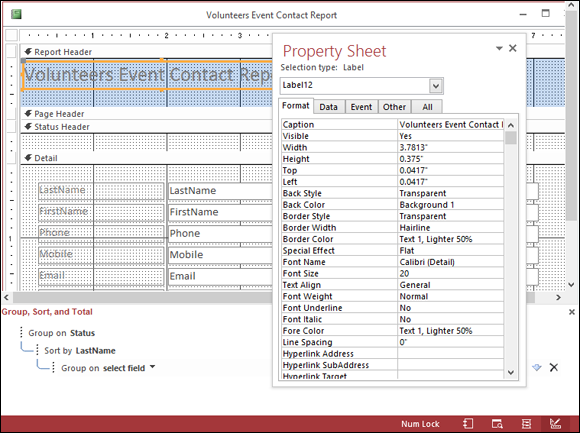
Figure 20-8: The Format tab’s Properties list varies depending on which report component you’re working with; (here it’s the Report Header label).
If you’re at a loss as to what one of the properties does or means, click the setting to its right and see the drop-down arrow (as shown in Figure 20-9); then you can use the drop-down list to see the options for the chosen property. In many cases, seeing those options clarifies what the property is and does. (Note that if there’s a numerical value in the column, no drop-down arrow appears — instead, you can simply edit the value.)

Figure 20-9: Find out more about a property (Text Align is shown here) by using its drop-down list to make alternative selections.
Controlling report and page headings
To adjust when various headings appear in your report, start with the Property Sheet. After the panel appears (open it by double-clicking the report component of your choice), try these settings:
-
The default setting for both the Page Header and the Page Footer is Yes (or All Pages when Report is selected at the top of the Property Sheet) — meaning that Access prints a header and footer on every page in the report.
Choose Display When to tell Access to
- Always show the header.
- Show the header when the report is printed.
- Only show the header onscreen.
The Keep Together option allows you to decide if a given part of the report should be kept with the adjacent parts. The default is Yes, with your alternative being No. Note that this option is not listed in the Property Sheet for the Page Header and Page Footer.
- The Page Header section of the Property Sheet panel comes with a bunch of options, too. Double-click the Page Header to display the PageHeaderSection panel, as shown in Figure 20-10.
-
Click the Format tab on the Property Sheet for the following options:
- Visible: Controls whether the Page Header appears at all.
- Height: Access sets this property automatically as you click and drag the section header up and down on the screen.
To specify an exact size, type the size in this section. (Access automatically uses the units of measurement you choose for Windows itself.) - Back Color: If you want to adjust the section’s color, follow these steps:
- Click the currently selected color.
-
Click the small gray button with three dots (the Ellipsis button) that appears to the right of the entry.
This button displays a color palette.
-
Click your color choice.
Let Access worry about the obnoxious color number that goes into the Back Color box.
- Special Effect: This property adjusts the visual effect for the section heading, much as the Special Effect button does for the markers in the report itself — though in this case your choices are limited. Click the Special Effect box and then click the down arrow to list what’s available. Choose Flat (the default setting), Raised, or Sunken.
- Auto Height: This option is set to Yes, but you can choose No if you’d prefer not to have an automatic height setting applied to your page heading.
- Display When: This is set to Always by default, but allows you to choose from Print Only or Screen Only, should those options appeal to you.
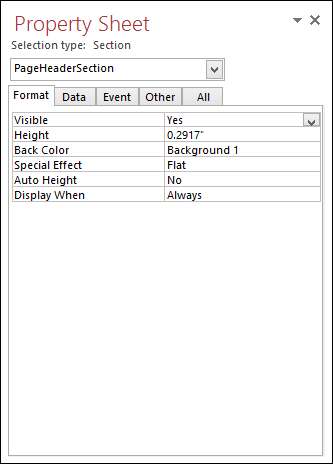
Figure 20-10: Use the Property Sheet drop-down list to display PageHeaderSection properties.
Adjusting individual sections
If you want to change the format for just one section of the report, double-click the header for that section to display its GroupHeader properties in the Property Sheet, as shown in Figure 20-11. (You can also choose the associated GroupHeader item from the drop-down menu at the top of the Property Sheet panel.
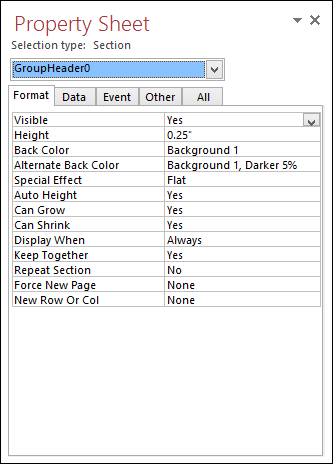
Figure 20-11: Choose a section of your report to adjust by double-clicking the section.
If your report doesn’t include any groups, GroupHeader won’t be in the list of components for which you can view properties, nor will there be a Group heading to double-click in Design view.
If your report does have a group (or groups) in it, you can tweak 13 different Group Header settings. The settings you’re most likely to want to adjust include the following:
-
Force New Page: This option controls whether the change for that group automatically forces the information to start on a new page. When you set this option, you can determine whether this page break occurs
- Only before the header
- Only after the footer
-
In both places
or
- None, to insert no page break at all
You can control the way in which section beginnings and endings are handled for multiple-column reports (such as having the group always start in a separate column). You can control whether
- The group is kept together (Keep Together)
- The section is visible (Visible)
-
Can Grow: The section expands as necessary, based on the data in it.
Can Grow is particularly useful when you’re printing a report that contains a Long Text field: - Set the width of the field so it’s as wide as you want.
- Use the Can Grow property to enable Access to adjust the height available for the information.
-
Can Shrink: The section can become smaller if, for example, some of the fields are empty.
To use the Can Grow and Can Shrink properties, you have to set them for both the section and the items in the section that can grow or shrink.
- Repeat Section: Controls whether Access repeats the heading on each page when a group is split across pages or columns.
Itemized adjustments
Double-clicking works for more than sections. When you want to adjust the formatting of any item of your report — a field, a label, or something you’ve drawn on your report — just double-click that item in Design view. Access again leads you to the Property Sheet, from which you can do all manner of technical nitpicking.
Customizing headers and footers
Although Access includes several default settings for headers and footers, those settings aren’t personalized or imaginative. You can do much more with headers and footers than simply display labels for your data. Why not build expressions in these sections — or insert text that introduces or summarizes your data? (Now, that’s a header or footer that impresses your friends, influences your co-workers, and wins over your boss. In a perfect world, anyway.)
A good header on your report’s shoulders
How you place the labels in the report’s header sections controls how the final report both looks and works, so you really need to put some thought into your headers. You want to make sure that all your headings are easy to understand and that they add useful information to the report.
When you’re setting up a report, feel free to play around with the header layouts. Experiment with your options and see what you can come up with — the way the information repeats through the report may surprise you.
For example, when you use a wizard to create a grouped report, Access puts labels for your records in the page header by default. Figure 20-12 shows such a report in action. Notice that the Status accompanies the volunteers’ actual status (the data). This appears at the top of each and every page because that label is in the Page Header section.

Figure 20-12: The Status field has been promoted within the report to Page Header content.
If you want to promote other labels to the page header, simply drag those labels to the Page Header section. You can do this in Layout view (as shown in Figure 20-13). Also in Figure 20-13, the Status label is in transit.

Figure 20-13: Dragging labels is easy in Layout view.
Solid footing with page numbers and dates
Access can insert certain information for you in either the header or the footer. Most notably, Access can insert
- Page numbers: Insert them by using the Page Numbers command found in the Header/Footer section of the Design tab.
- Dates: Click the Date and Time command, also found in the Header/Footer section of the Design tab.
And this is page what?
If you click the Page Numbers button on the Header/Footer section of the Ribbon’s Design tab, the Page Numbers dialog box appears (as shown in Figure 20-14).

Figure 20-14: Control your report’s page numbers.
The Page Numbers dialog box has several options for your page-numbering excitement:
- Format:
- Page N: Prints the word Page followed by the appropriate page number.
- Page N of M: Counts the total number of pages in the report and prints that number with the current page number (as in Page 2 of 15).
- Position: Tells Access whether to print the page number in the Page Header or the Page Footer.
-
Alignment: Sets the position of the page number on the page.
Click the arrow at the right edge of the list box to see your options. - Show Number on First Page:
- Select this option to include a page number on the first page of your report.
- Deselect this option to keep your first page unnumbered.
To change how the page numbers work on your report, follow these steps:
-
Manually delete the existing page number field.
To delete the field, click it (you should be in Report view at the time) and press the Delete key.
- Click the Page Numbers button in the Header/Footer section of the Design tab.
- Set up new page numbers.
Time-stamping your reports
Click the Date and Time button — in the Header/Footer section of the Ribbon’s Design tab — to display the Date and Time dialog box (shown in Figure 20-15).

Figure 20-15: Choose dates and times here.
The most important options are
- Include Date
- Include Time
Select the exact format of your date and/or time from the set of choices. The dialog box displays a sample of your settings in the section cleverly marked Sample.
Including the date and time makes a huge difference with information that changes regularly. By printing the information at the bottom of your report pages, Access automatically documents when the report came out. It never hurts to include a date stamp (or a time and date stamp) in report footers.
You probably noticed the Logo and Title buttons in the Header/Footer section of the Design tab, too. The Logo button opens an Insert Picture dialog box, where you can choose an image to add to the report (such as your company logo or a photo of the people or objects your report is about). The Title button inserts the report’s name (the name that appears on the report’s tab).
When inserted, the logo or title can be dragged to any position on the report. Figure 20-16 shows an image on the report, to the right of the report’s header.

Figure 20-16: Your organization’s logo is a great addition to the report header.
As shown in Chapter 19, you can add images (like your logo) to any report, and not just by adding them to a header or footer. Check it out!